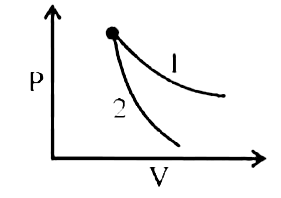
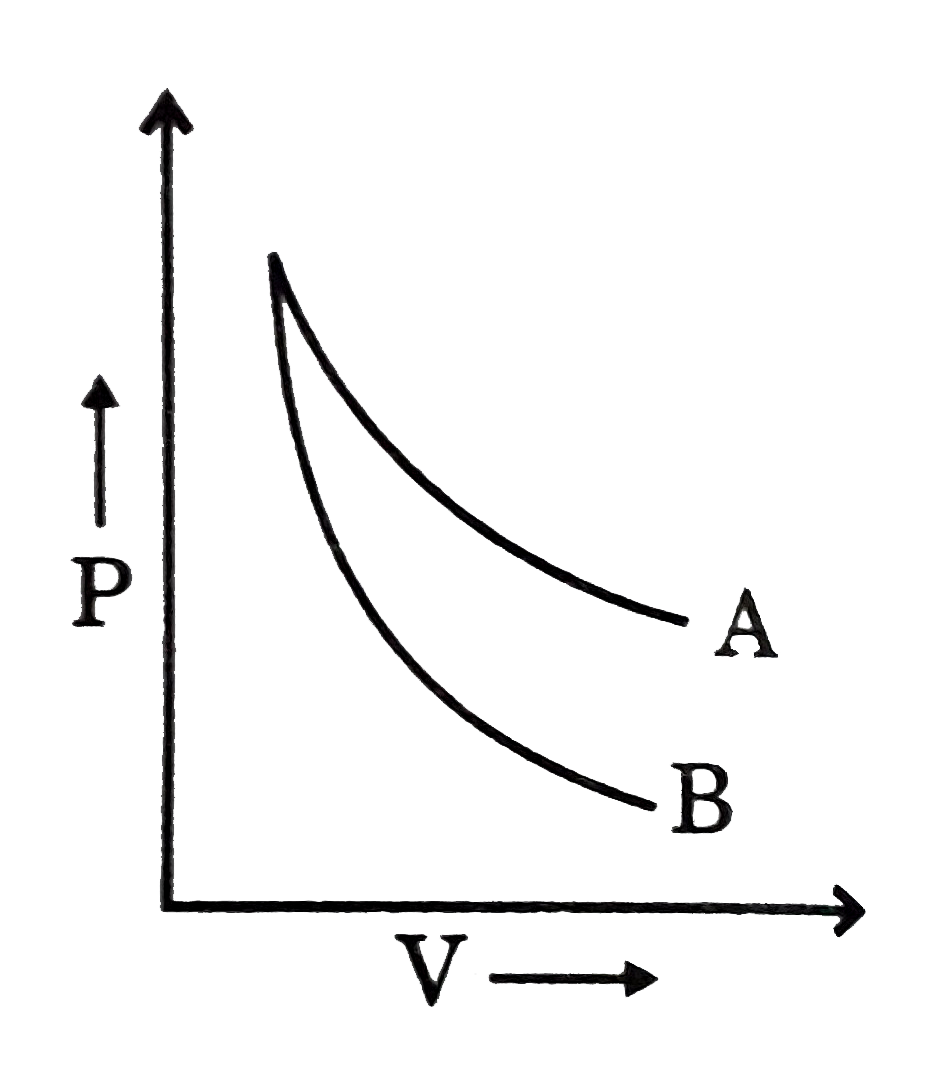
P-V plots for two gases during adiabatic processes are shown in the figure. Plots 1 and 2 should corresponds respectively to
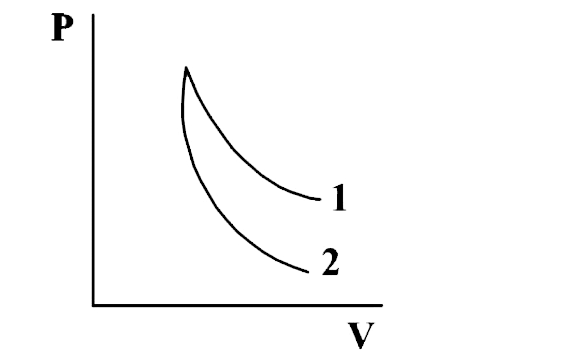
HeandO2
O2andHe
HeandAr
O2andN2
The correct Answer is:B
(b) For adiabatic process Pvγ=constant
Also for monoatomic gas γ=CPCV=1.67
for diatomic gas γ=1.4
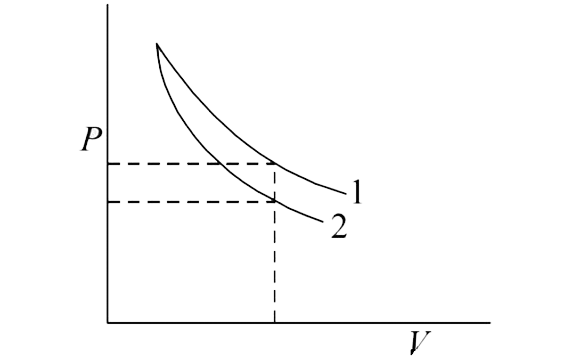
Since, γdia→mic<γmonoa→mic
Pdia→mic<Pmonoa→mic
⇒ Graph 1 is for diatomic and graph 2 is for mono
atomic.
Topper's Solved these Questions
Similar Questions
Knowledge Check
- Question 1 - Select One
P-V plots for two gases during adiabatic processes are shown in the figure. Plots 1 and 2 should corresponds respectively to
 AHe and O2BO2 and HeCHe and ArDO2 and N2
 - Question 2 - Select One
P−V plots for two gases during P4 adiabatic process are shown in the figure. Plots 1 and 2 should correspond respectively to
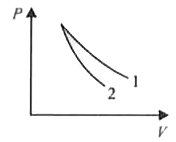 AHe and O2BO2 and HeCHe and ArDO2 and N2.
 - Question 3 - Select One
P−V plots for two gases during adiabatic expansion are shown in figure. Plot I and II should correspond respectively to :
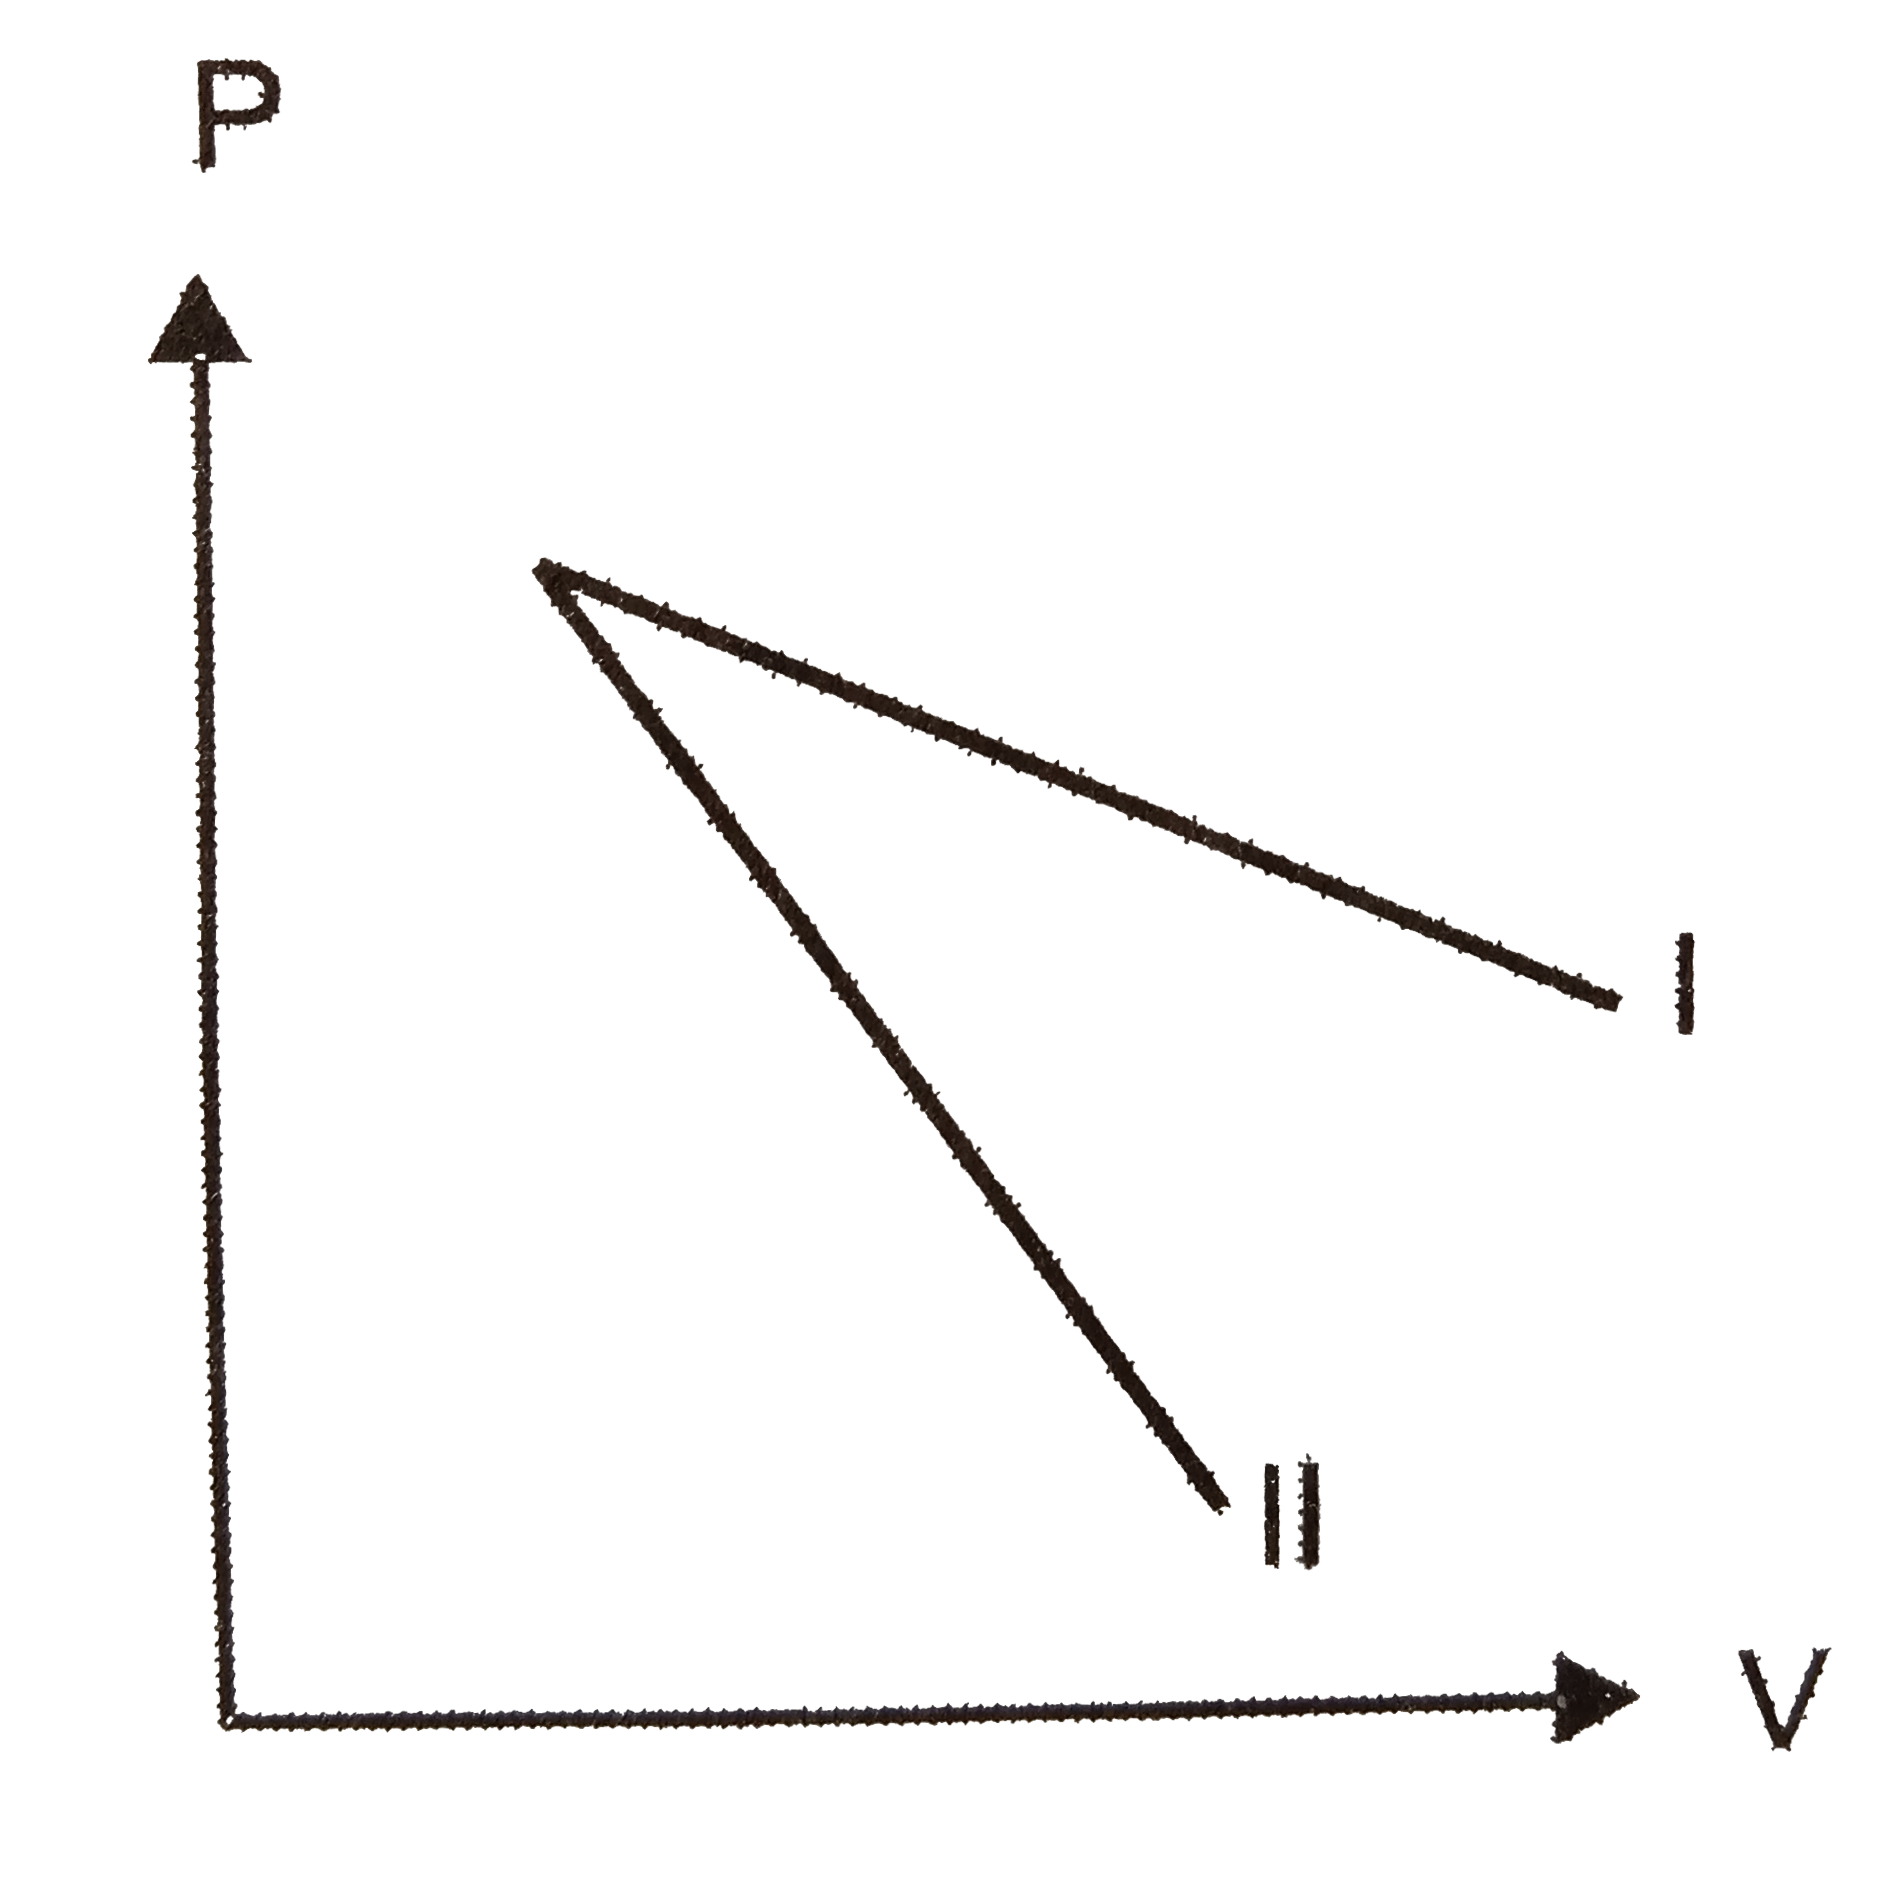 AO2 and N2BO2 and HeCHe and O2DHe and Ar
P-V plots for two gases during adiabatic processes are shown in the figure. Plots 1 and 2 should corresponds respectively to
 View Solution
P-V plots for two gases during an adiabatic process are given in the figure:
Plot A and plot B should correspond to : (Assume ideal behaviour)
 View Solution
The pressure-volume of varies thermodynamic process is shown in graphs:
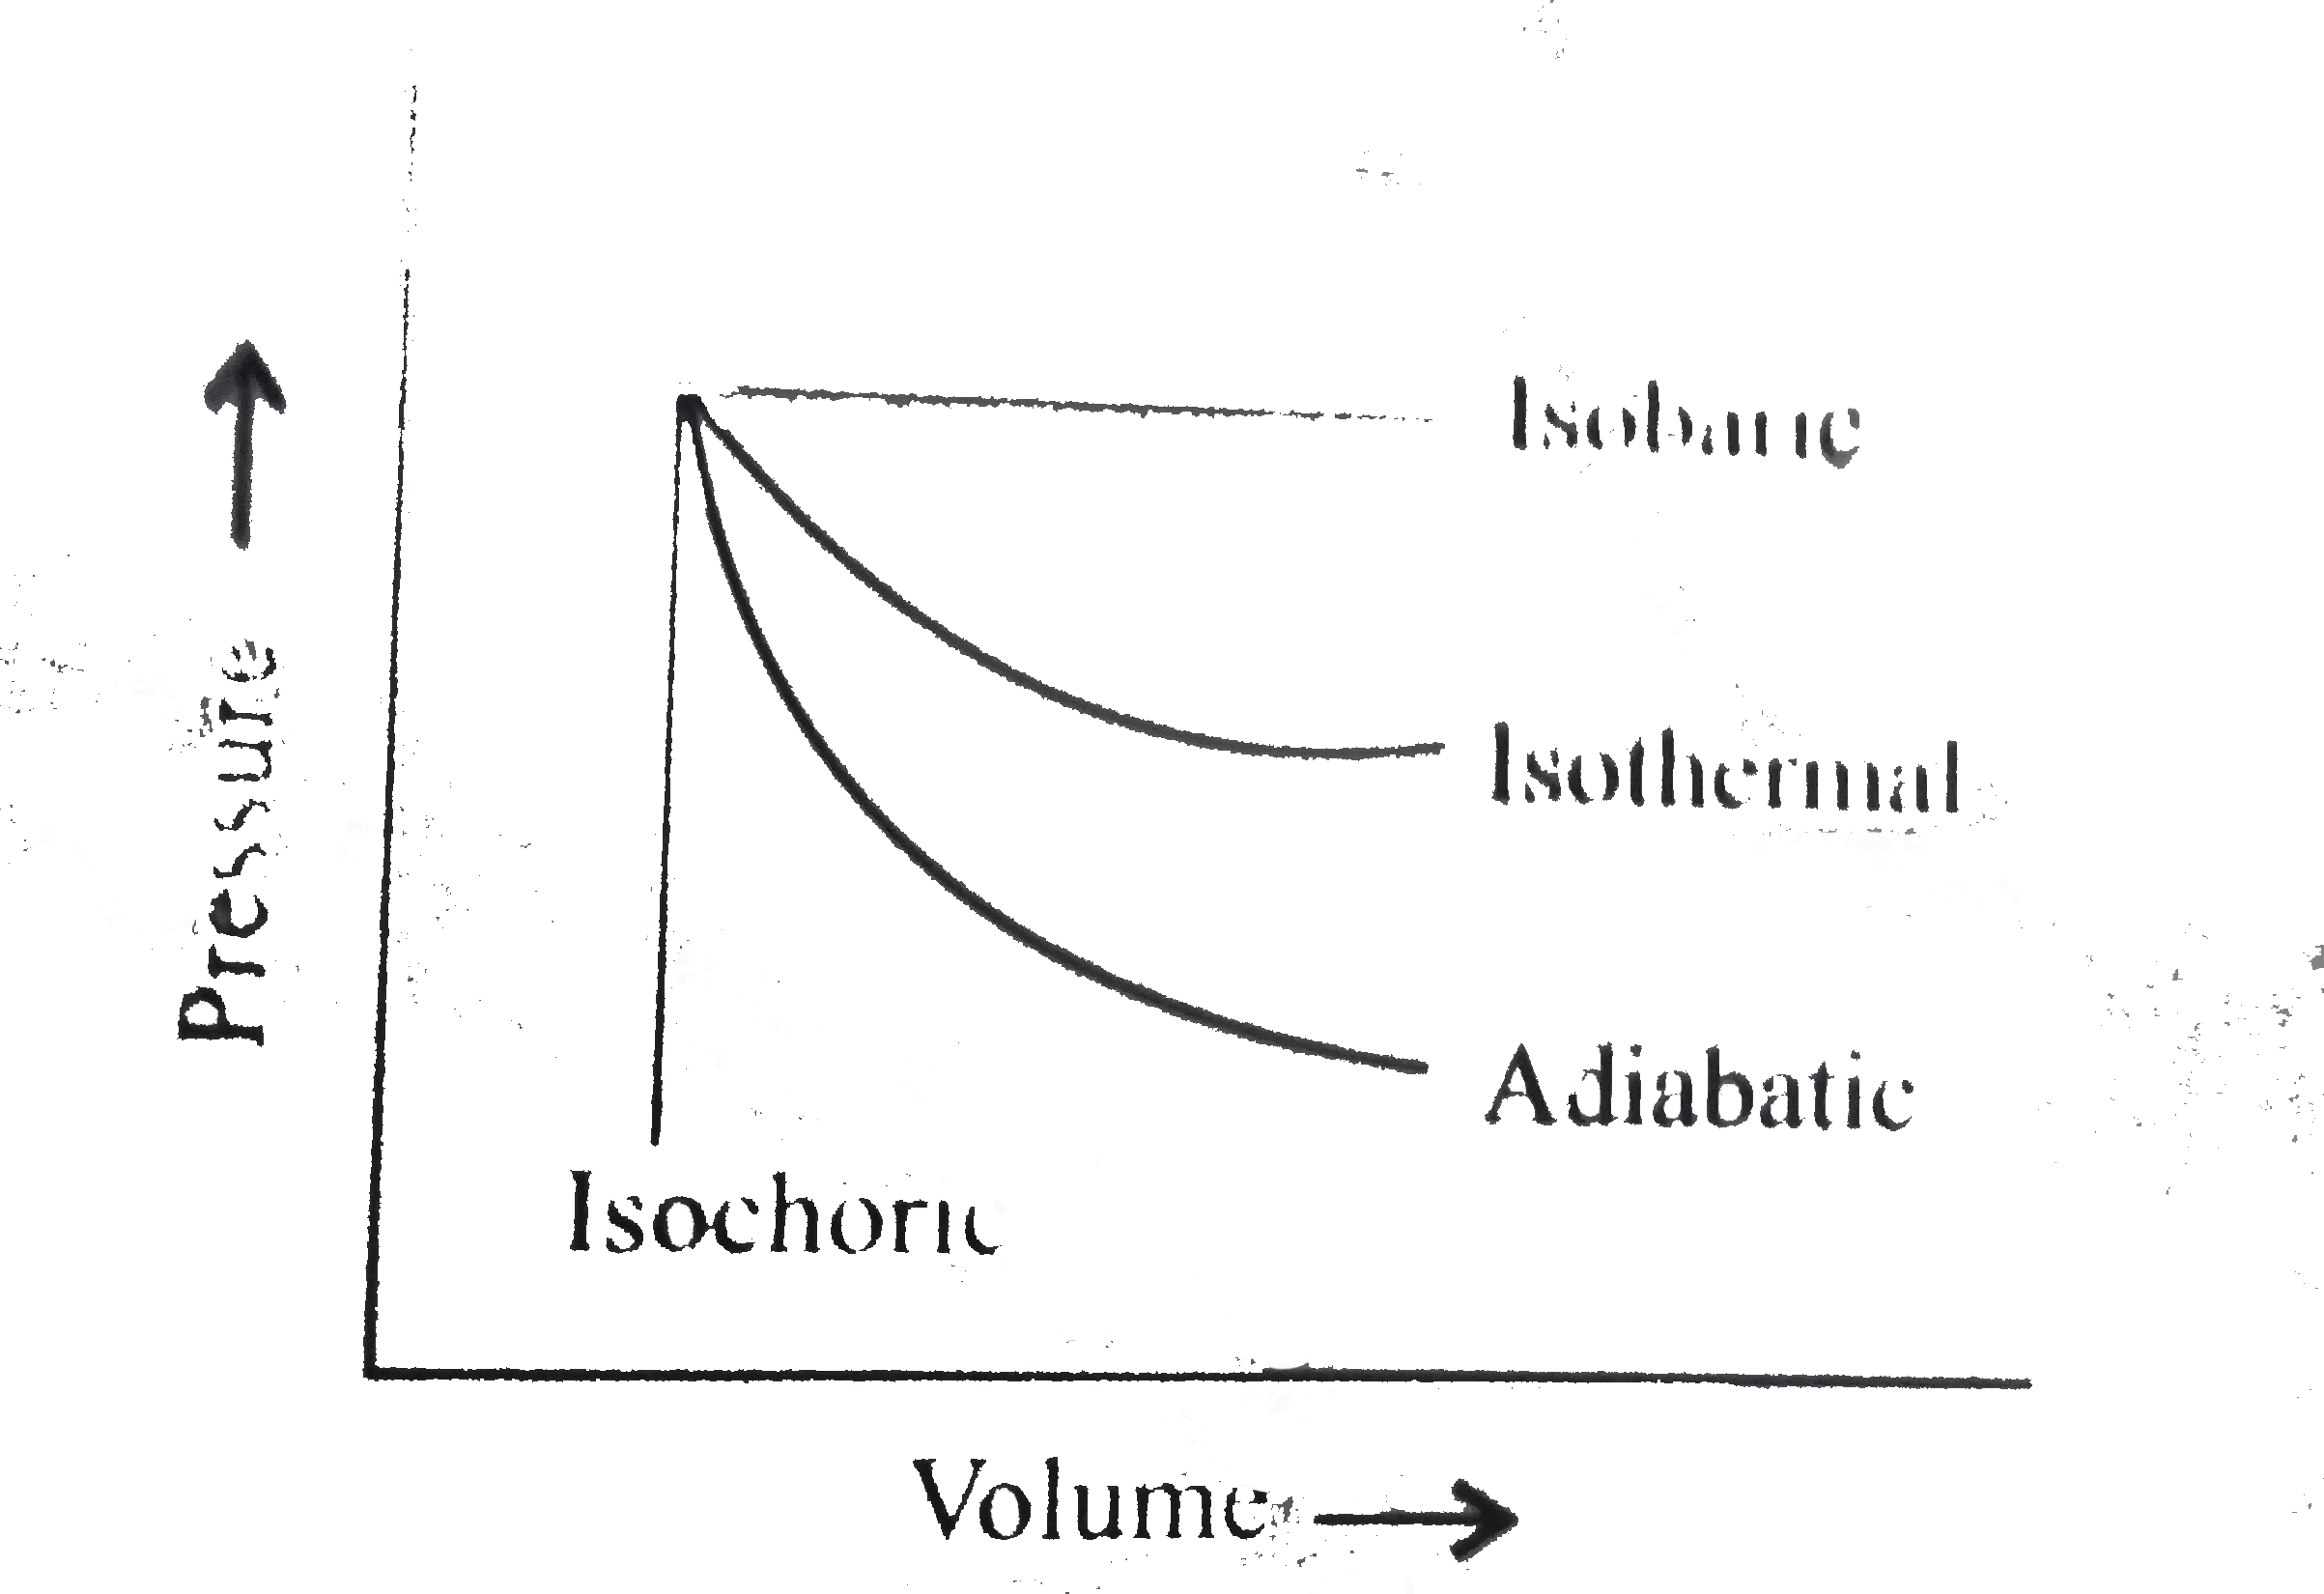
Work is the mole of transference of energy. It has been observed that reversible work done by the system is the maximum obtainable work.
wrev>wirr
The works of isothermal and adiabatic processes are different from each other.
wisothermal reversible=2.303nRTlog10(V2V1)
=2.303nRTlog10(P2P1)
wadiabatic reversible=CV(T1−T2)
P−V plots for two gases during adiabatic processes are given in the given figure:
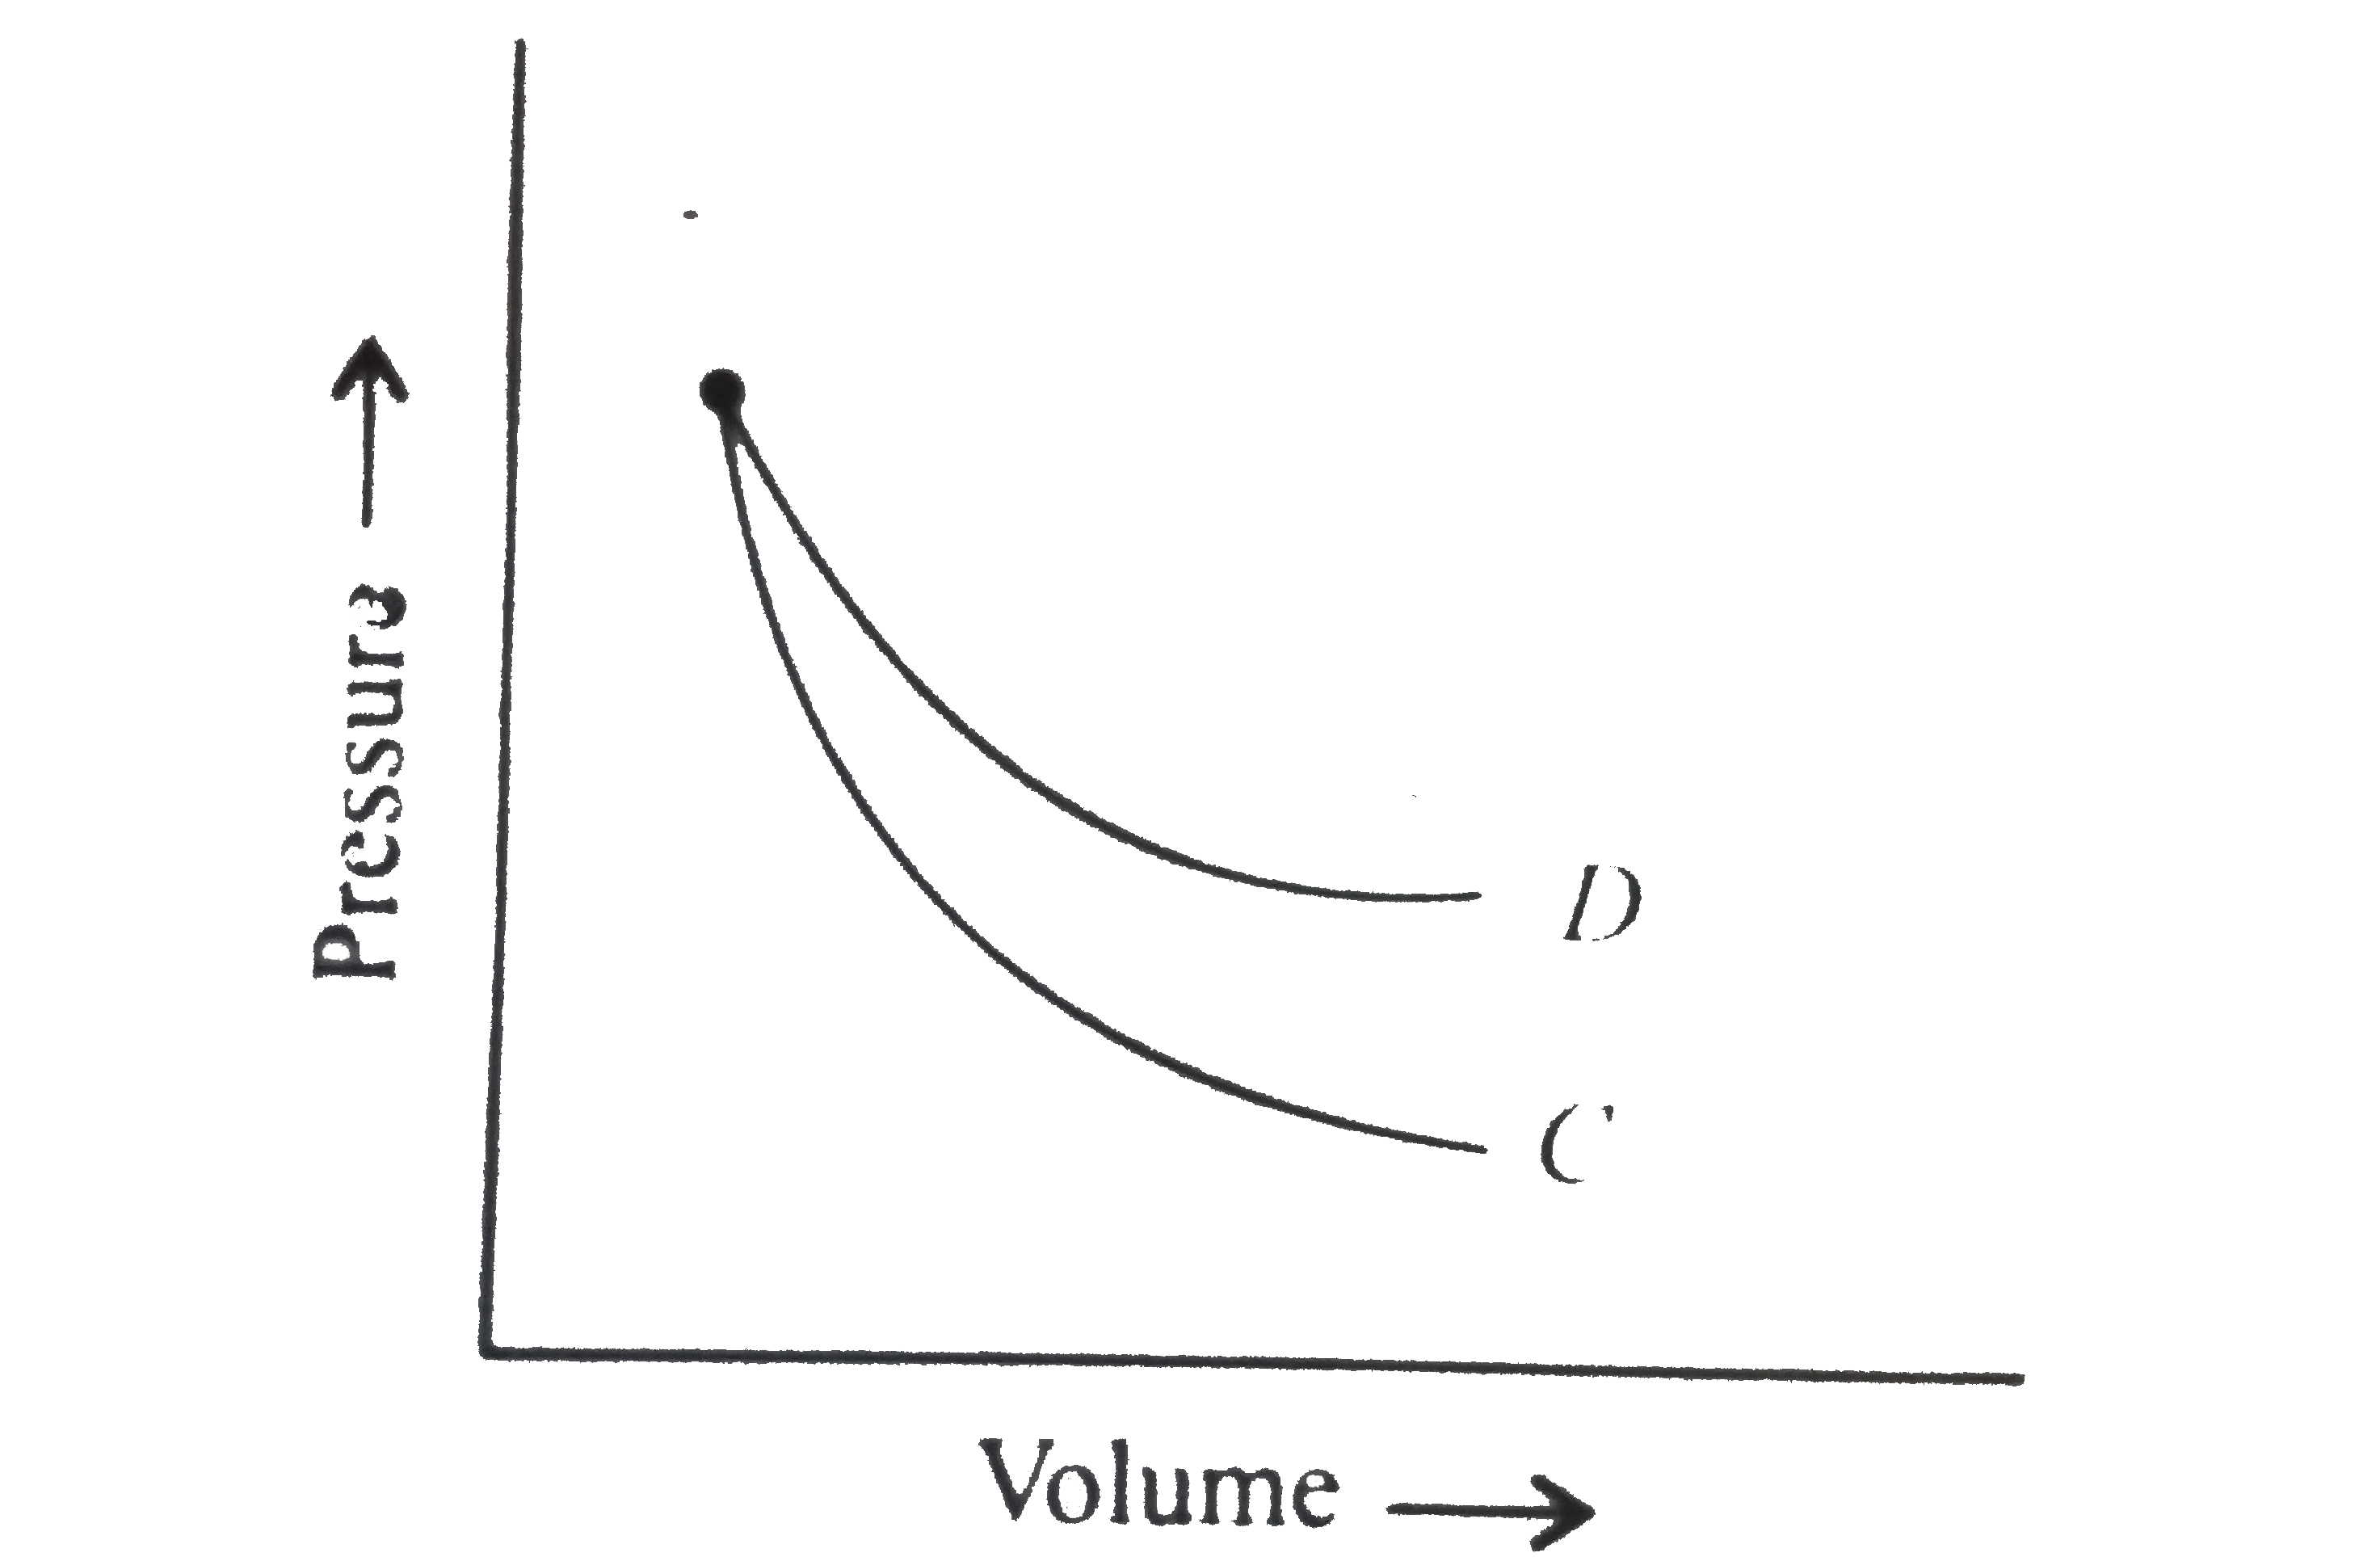
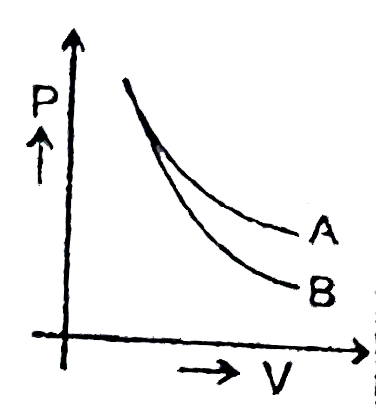
Plot D and Plot C should correspond toView SolutionP−V plot for two gases ( assuming ideal ) during adiabatic processes are given in the fig.
Plot A and B should correspond respectively to :
 View Solution
P-V plot for two gases (assuming ideal) during adiabatic processes are given in the figure. Plot A and plot B should correspond respectively to :
 View Solution


