Conisder a thin spherical shell of radius R with centre at the origin, carrying uniform poistive surface charge denisty. The variation of the magnitude of the electric field ∣∣→E(r)∣∣ and the electric potential V(r) with the distance r from the centre, is best represented by which graph?
(a) 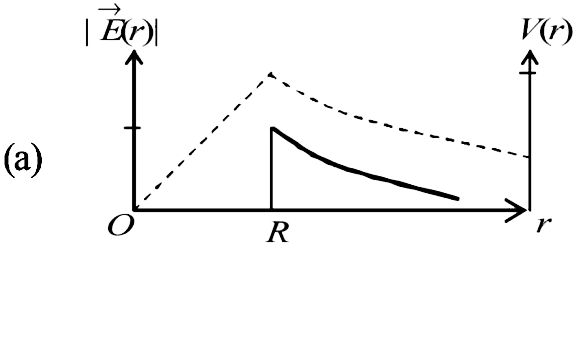
(b) 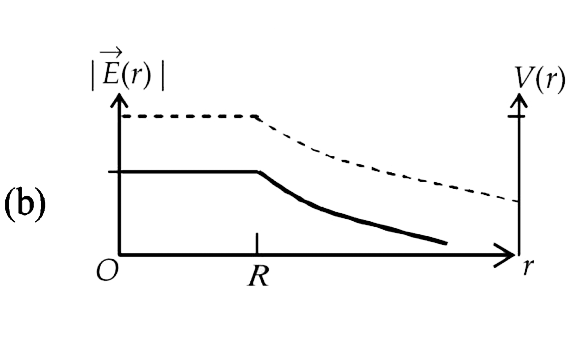
(c) 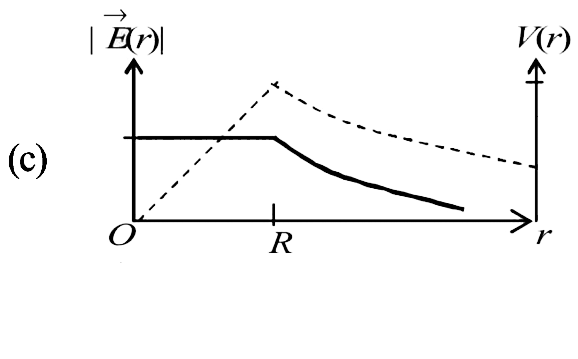
(d) 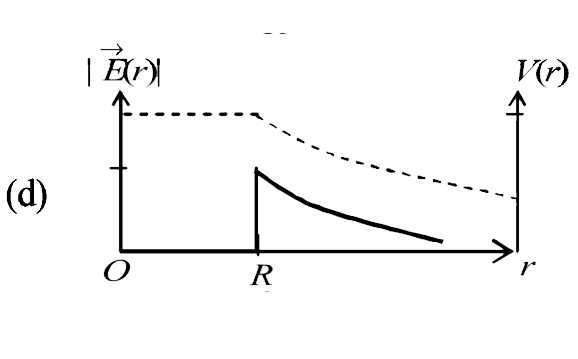
The correct Answer is:D
For a thin uniformly poistive charged spherical shell
(i) Inisde the shell at any point
E=O and V=14π∈0=qR=constt.
where q=charge on sphere
R=Radius of sphere
(ii) Outisde the shell at any point at any distance r
from the centre E∝1r2 and V∝1r
Topper's Solved these Questions
- ELECTROSTATICSBOOK - SUNIL BATRA (41 YEARS IITJEE PHYSICS)CHAPTER - ELECTROSTATICSEXERCISE - Subjective Problems
2 Videos
- ELECTROSTATICSBOOK - SUNIL BATRA (41 YEARS IITJEE PHYSICS)CHAPTER - ELECTROSTATICSEXERCISE - Comprehension Based Questions
2 Videos
- ELECTROMAGNETIC INDUCTION AND ALTERNATING CURRENTBOOK - SUNIL BATRA (41 YEARS IITJEE PHYSICS)CHAPTER - ELECTROMAGNETIC INDUCTION AND ALTERNATING CURRENTEXERCISE - JEE Main And Advanced
107 Videos
- MODERN PHYSICSBOOK - SUNIL BATRA (41 YEARS IITJEE PHYSICS)CHAPTER - MODERN PHYSICSEXERCISE - MCQ (One Correct Answer
1 Videos
Similar Questions
Draw a graph of electric field E(r) with distance r from the centre of the shell for 0≤r≤0 .
View SolutionAn isolated solid metal sphere of radius R is given an electric charge. The variation of the intensity of the electric field with the distance r from the centre of the sphere is best shown by
View Solution
Knowledge Check
Consider a thin spherical shell of radius R with its centre at the origin, carrying uniform positive surface charge density. The variation of the magnitude of the electric field ∣∣→E(r)∣∣ and the electric potential V (r ) with the distance r from the center is best represented by which graph, Fig.
Altimg src="https://d10lpgp6xz60nq.cloudfront.net/physics_images/PR_XII_V01_C01_E01_319_O01.png" width="30%"gtBltimg src="https://d10lpgp6xz60nq.cloudfront.net/physics_images/PR_XII_V01_C01_E01_319_O02.png" width="30%"gtCltimg src="https://d10lpgp6xz60nq.cloudfront.net/physics_images/PR_XII_V01_C01_E01_319_O03.png" width="30%"gtDltimg src="https://d10lpgp6xz60nq.cloudfront.net/physics_images/PR_XII_V01_C01_E01_319_O04.png" width="30%"gtThe dependence of electric potential V on the distance 'r' from the centre of a charged spherical shell is shown by :
A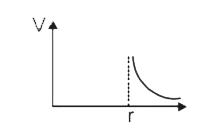 B
B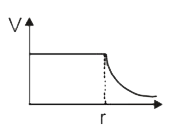 C
C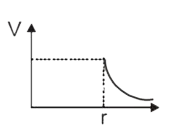 D
D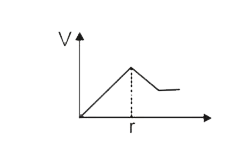
A thin spherical shell of radius R has charge Q spread uniformly over its surface. Which of the following graphs most closely represents the electric field E(r) produced by the shell in the range 0≤r<∞, where r is the distance from the centre of the shell?
A B
B C
C D
D
The volume charge density of a sphere carrying charge Q and of radius R is proportional to the square of the distance from the centre. The ratio of the magnitude of the electric field at a distance 2R from the centre to that at a distance of R2 from the centre is
View SolutionConsider a thin spherical shell of radius R consisting of uniform surface charge density σ. The electric field at a point of distance x from its centre and outside the shell is
View SolutionA thin spherical shell of radius R has charge Q spread uniformly over its surface. Which of the following graphs most closely represents the electric field E(r) produced by the shell in the range 0≤r<∞, where r is the distance from the centre of the shell?
View SolutionThe electric field due to uniformly charged sphere of radius R as a function of the distance from its centre is represented graphically by
View SolutionA non-conducting solid sphere of radius R is uniformly charged. The magnitude of the electric filed due to the sphere at a distance r from its centre
View Solution
