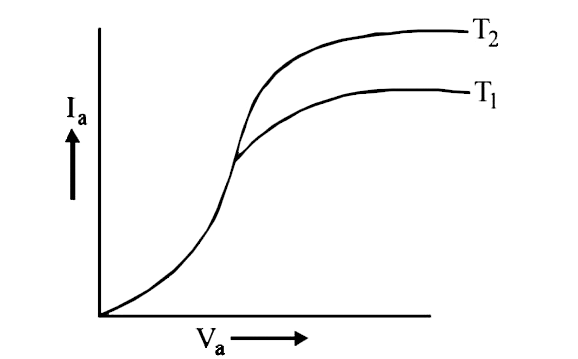
For a dlode the variation of its anode current 1a with the anode vollage Va at two different cathode lemperatures T1 and T_(1)
NA
Topper's Solved these Questions
- MODERN PHYSICSBOOK - SUNIL BATRA (41 YEARS IITJEE PHYSICS)CHAPTER - MODERN PHYSICSEXERCISE - MCQ (One Correct Answer
1 Videos
- ELECTROSTATICSBOOK - SUNIL BATRA (41 YEARS IITJEE PHYSICS)CHAPTER - ELECTROSTATICSEXERCISE - Comprehension Based Questions
2 Videos
- MOVING CHARGES AND MAGNETISMBOOK - SUNIL BATRA (41 YEARS IITJEE PHYSICS)CHAPTER - MOVING CHARGES AND MAGNETISMEXERCISE - MCQs(d )
1 Videos
Similar Questions
Knowledge Check
The current in a metallic conductor is plotted against voltage at two different temperatures T1 and T2. Which is correct
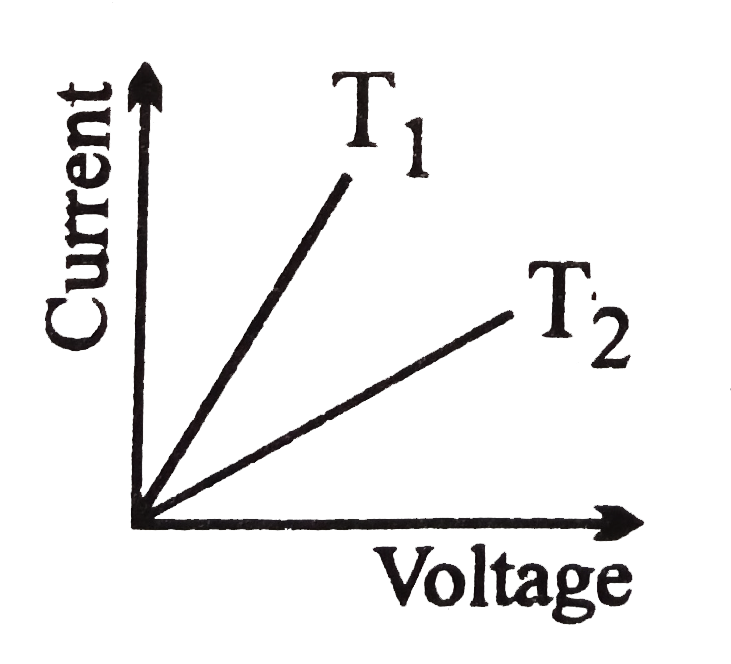 AT1>T2BT1<T2CT1=T2Dnone
The current (I) and voltage (V) graphs for a given metallic wire at two different temperature (T1) and (T2) are shown in fig. It is concluded that
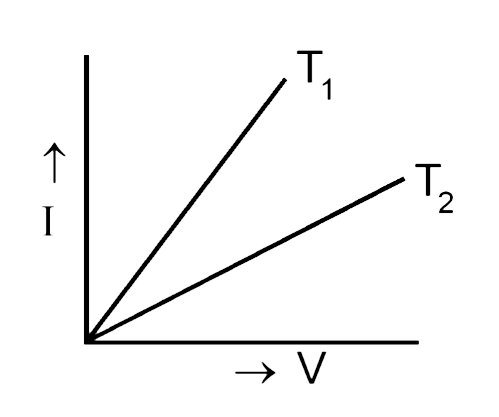 AT1=T2BT1>T2CT1<T2DNone of these
For the following graph, drawn from two different samples of gases at two different temperatures T1andT2, which of the following statements is/are necessarily true?
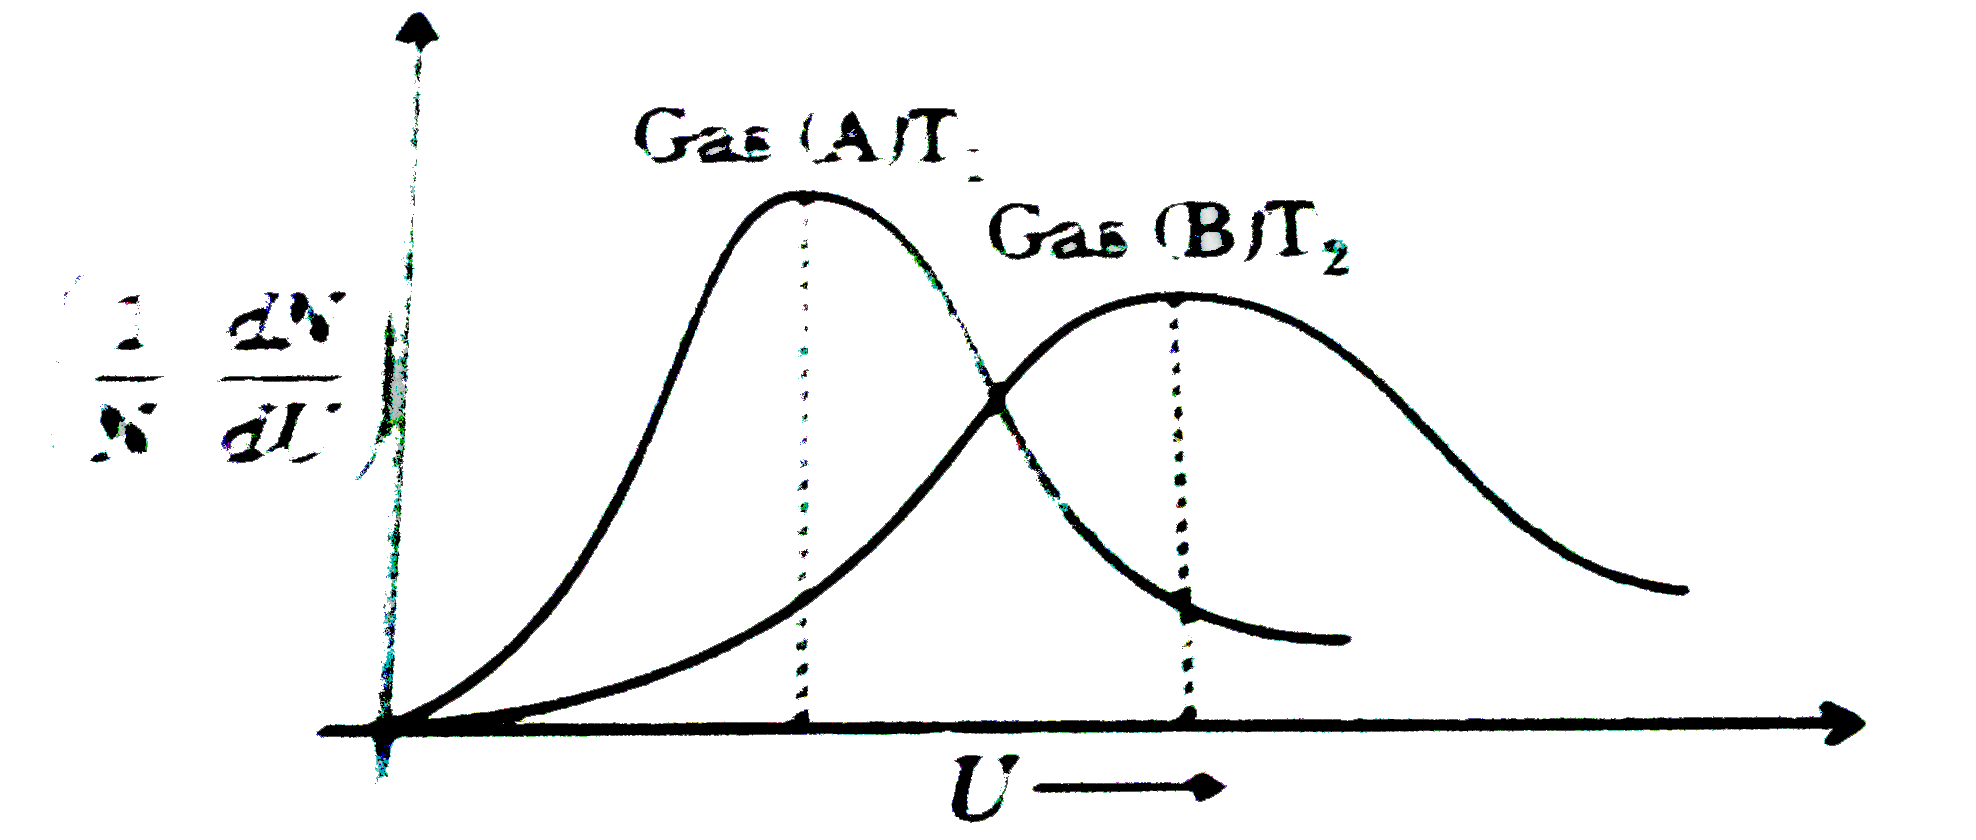 Aif T2>T1,MB is necessarily greater than MABif T1>T2,MA is necessarily greater than MBCT2MB>T1MADNothing can be predicted.
Plot a graph showing the variation of photoelectric current with anode potential for two light beam of same wavelength but different intensity.
View SolutionThe current I and voltage V variations for a given metallic wire at tow different temperature T1andT2 are shown in the figure. Then which one of the following is correct
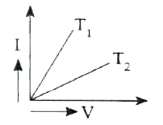
View SolutionAssertion : Current versus potential difference (i-V) graph for a conductor at two different temperatures T1 and T2 is shown in figure. Hence T1>T2.
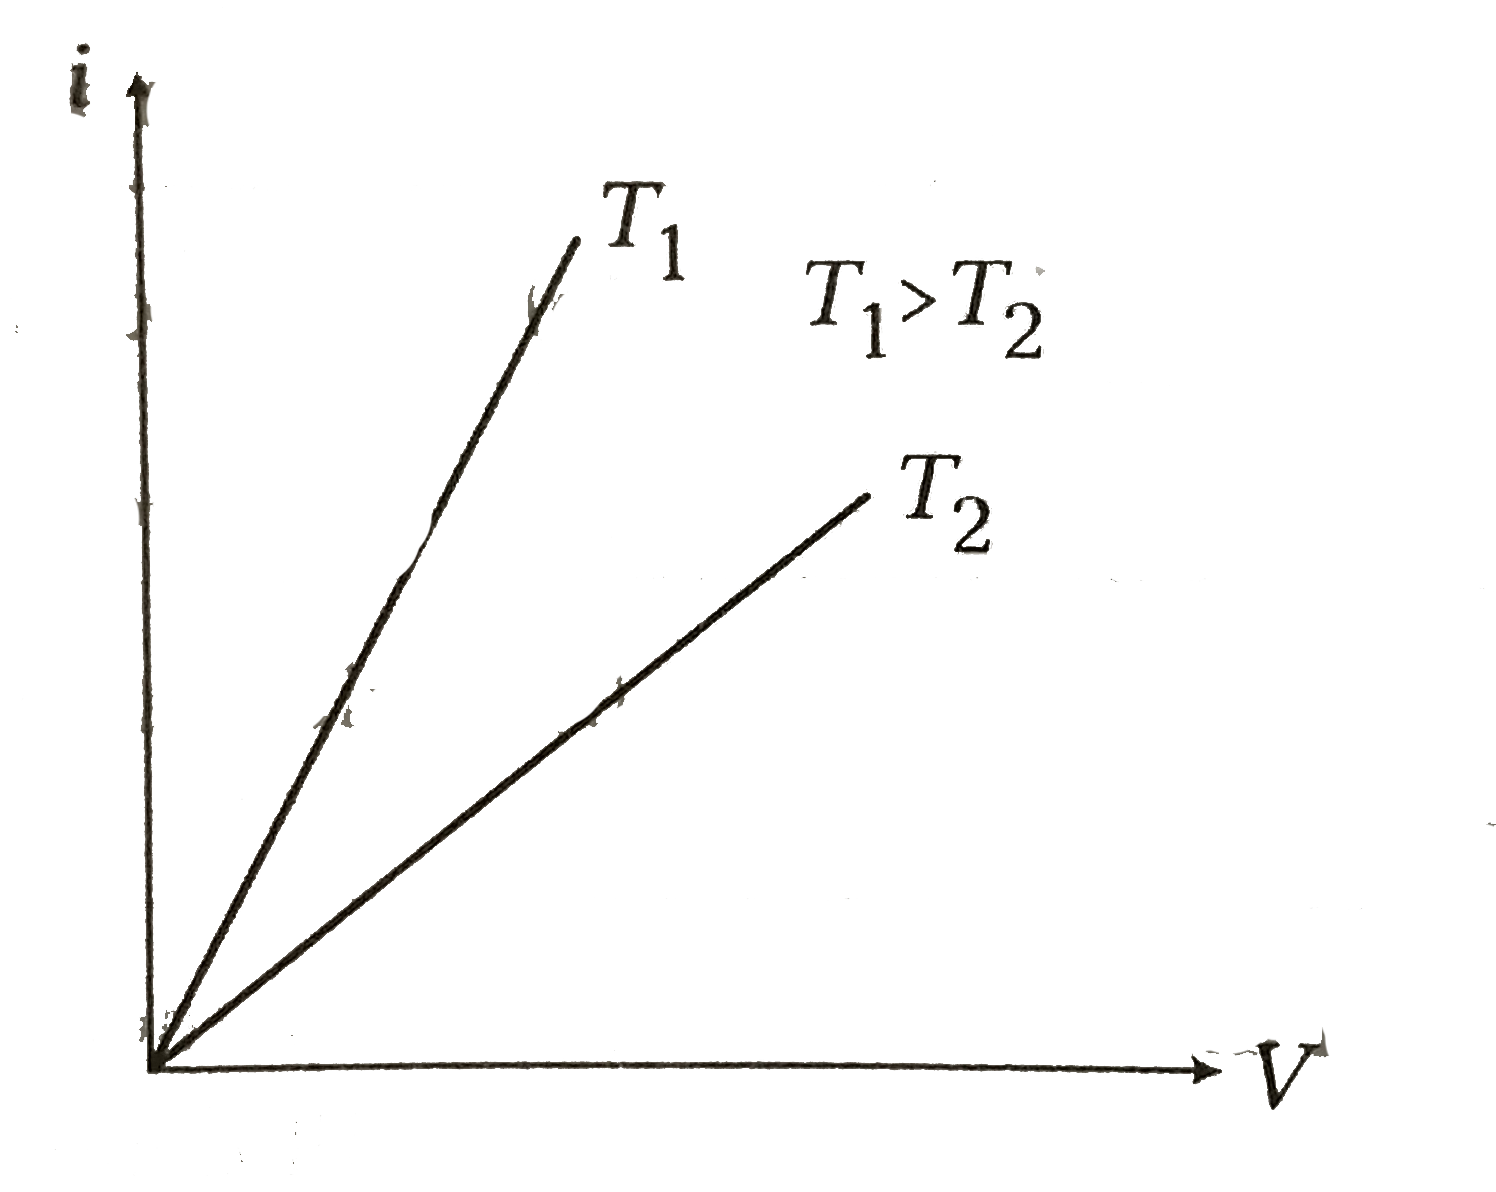
Reason : Resistance of a conductor increases with rise in temperature.
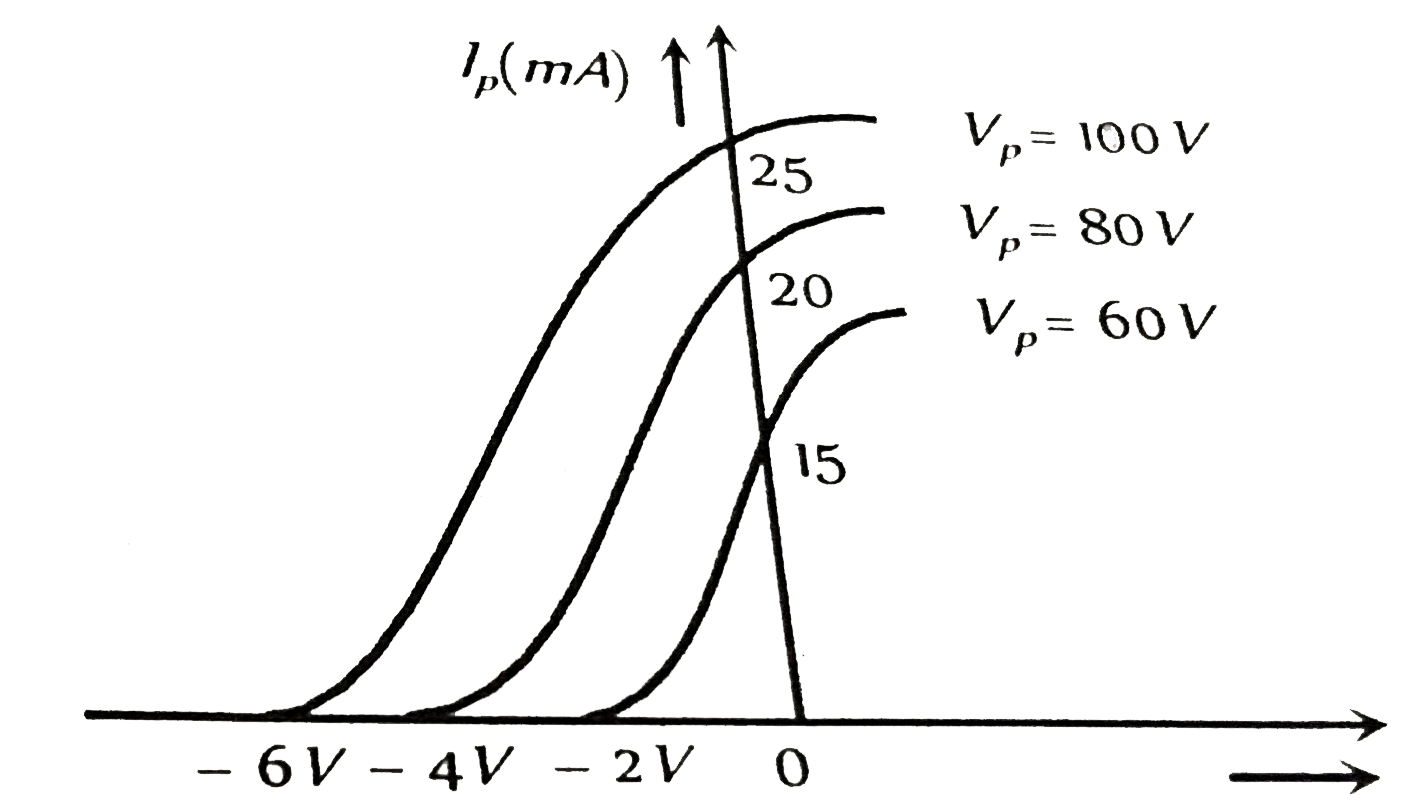
View SolutionThe variation of anode current in a triode corresponding to a change in grid potential at three different values of the plate potential is shown in the diagram. The mutual conductance of the triode is
View SolutionThe voltage V and current I v graphs for a conductor at two different temperatures T1andT2 are shown in the figure. The relation between T1andT2 is

View Solution

