Explain Maxwell distribution of molecular speed with necessary graph.
Step-by-Step Text Solution:
1. Introduction to Maxwell Distribution of Molecular Speed:
The Maxwell distribution describes the distribution of speeds of particles in a gas. It is a statistical distribution that shows how the speeds of molecules in an ideal gas are distributed at a given temperature.
2. Graph Representation:
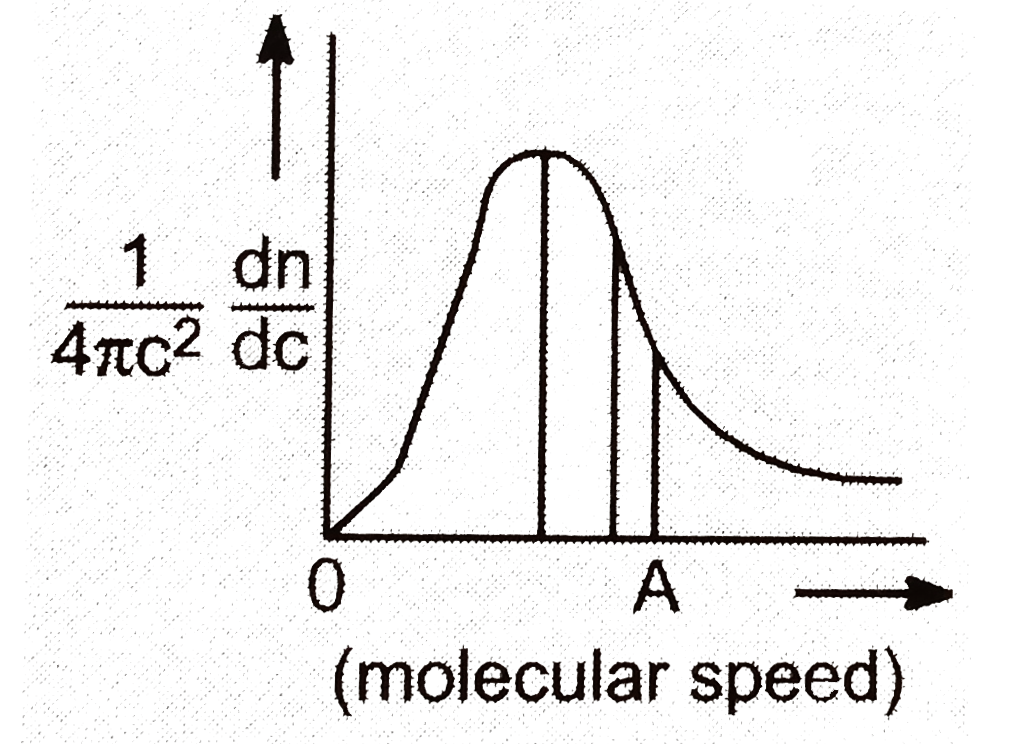
To represent the Maxwell distribution graphically, we plot the speed (v) on the x-axis and the fraction of molecules (f) with that speed on the y-axis. The graph typically has a bell-shaped curve.
3. Key Points on the Graph:
- The peak of the curve represents the most probable speed (v_mp), which is the speed at which the maximum number of molecules are found.
- The average speed (v_avg) is the mean speed of all molecules in the gas.
- The root mean square speed (v_rms) is the square root of the average of the squares of the speeds of the molecules.
4. Mathematical Expressions:
- The most probable speed (v_mp) is given by:
vmp=√2kTm
- The average speed (v_avg) is given by:
vavg=√8kTπm
- The root mean square speed (v_rms) is given by:
vrms=√3kTm
Where:
- k is the Boltzmann constant,
- T is the absolute temperature,
- m is the mass of a gas molecule.
5. Relationship Between Speeds:
In the Maxwell distribution:
- The most probable speed is less than the average speed, which in turn is less than the root mean square speed:
vmp<vavg<vrms
This indicates that as we move from the most probable speed to the root mean square speed, the values increase.
6. Conclusion:
The Maxwell distribution provides a comprehensive understanding of the speeds of molecules in a gas, illustrating how temperature and mass affect molecular motion. The graph visually represents the distribution, highlighting the most probable, average, and root mean square speeds.
---
The Maxwell distribution describes the distribution of speeds of particles in a gas. It is a statistical distribution that shows how the speeds of molecules in an ideal gas are distributed at a given temperature.
To represent the Maxwell distribution graphically, we plot the speed (v) on the x-axis and the fraction of molecules (f) with that speed on the y-axis. The graph typically has a bell-shaped curve.
- The peak of the curve represents the most probable speed (v_mp), which is the speed at which the maximum number of molecules are found.
- The average speed (v_avg) is the mean speed of all molecules in the gas.
- The root mean square speed (v_rms) is the square root of the average of the squares of the speeds of the molecules.
- The most probable speed (v_mp) is given by:
vmp=√2kTm
- The average speed (v_avg) is given by:
vavg=√8kTπm
- The root mean square speed (v_rms) is given by:
vrms=√3kTm
Where:
- k is the Boltzmann constant,
- T is the absolute temperature,
- m is the mass of a gas molecule.
In the Maxwell distribution:
- The most probable speed is less than the average speed, which in turn is less than the root mean square speed:
vmp<vavg<vrms
This indicates that as we move from the most probable speed to the root mean square speed, the values increase.
The Maxwell distribution provides a comprehensive understanding of the speeds of molecules in a gas, illustrating how temperature and mass affect molecular motion. The graph visually represents the distribution, highlighting the most probable, average, and root mean square speeds.
Topper's Solved these Questions
Similar Questions
Knowledge Check
- Question 1 - Select One
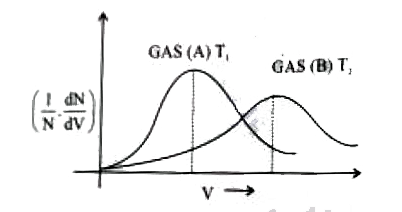
According to Maxwell.s distribution of molecular speeds, for the below graph drawn for two different samples of gases A and B al temperature T1 and T2 respectively, which of the following statements in are incorrect?
 AIf T1=T2 then molecular mass of gas B(MB) is greater than molecular mass of gas A(MA).BIf molecular mass of gas A(MA)is equal to molecular mass of gas B(MB) then T1>T2CIf T1>T2, then molecular mass of gas B(MB) is necessarily less than molecular mass of gas A(MA)DAll of these
 - Question 2 - Select One
According to Maxwell.s distribution of molecular speeds, for the below graph drawn for two different samples of gases A and B al temperature T1 and T2 respectively, which of the following statements in are incorrect?
 AIf T1=T2 then molecular mass of gas B(MB) is greater than molecular mass of gas A(MA).BIf molecular mass of gas A(MA)is equal to molecular mass of gas B(MB) then T1>T2CIf T1>T2, then molecular mass of gas B(MB) is necessarily less than molecular mass of gas A(MA)DAll of these
 - Question 3 - Select One
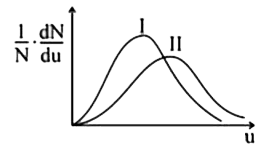
Following curves are plotted according to Maxwell distribution of molecular speed.
 AFor He gas, temperature corresponding to I curve is higher than II curve.BAt same temperature, I and II curve may represent N2andO2 gas respectively.CFraction of molecules having Umps is more in curve I than curve II.DI and II curve may represent O2(g) at 300 K and SO2(g) at 500 K respectively.
Molecular Speeds
View SolutionMaxwell Distribution Curves
View SolutionThe Maxwell-Boltzmann distribution law of molecular speeds is graphically represented as
 The curve has which of the following characteristics ?.View Solution
Maxwell distribution is true when
View SolutionWhich one of the following statement is NOT true about the effect of an increase in temperature on the distribution of molecular speed in a gas?
View Solution

