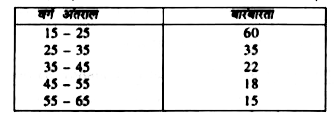
For the given frequency polygon make a continuous grouped frequency distribution table and hence find the mean.
Step by step video solution for For the given frequency polygon make a continuous grouped frequency distribution table and hence find the mean. by Maths experts to help you in doubts & scoring excellent marks in Class 9 exams.
Updated on:21/07/2023Similar Questions
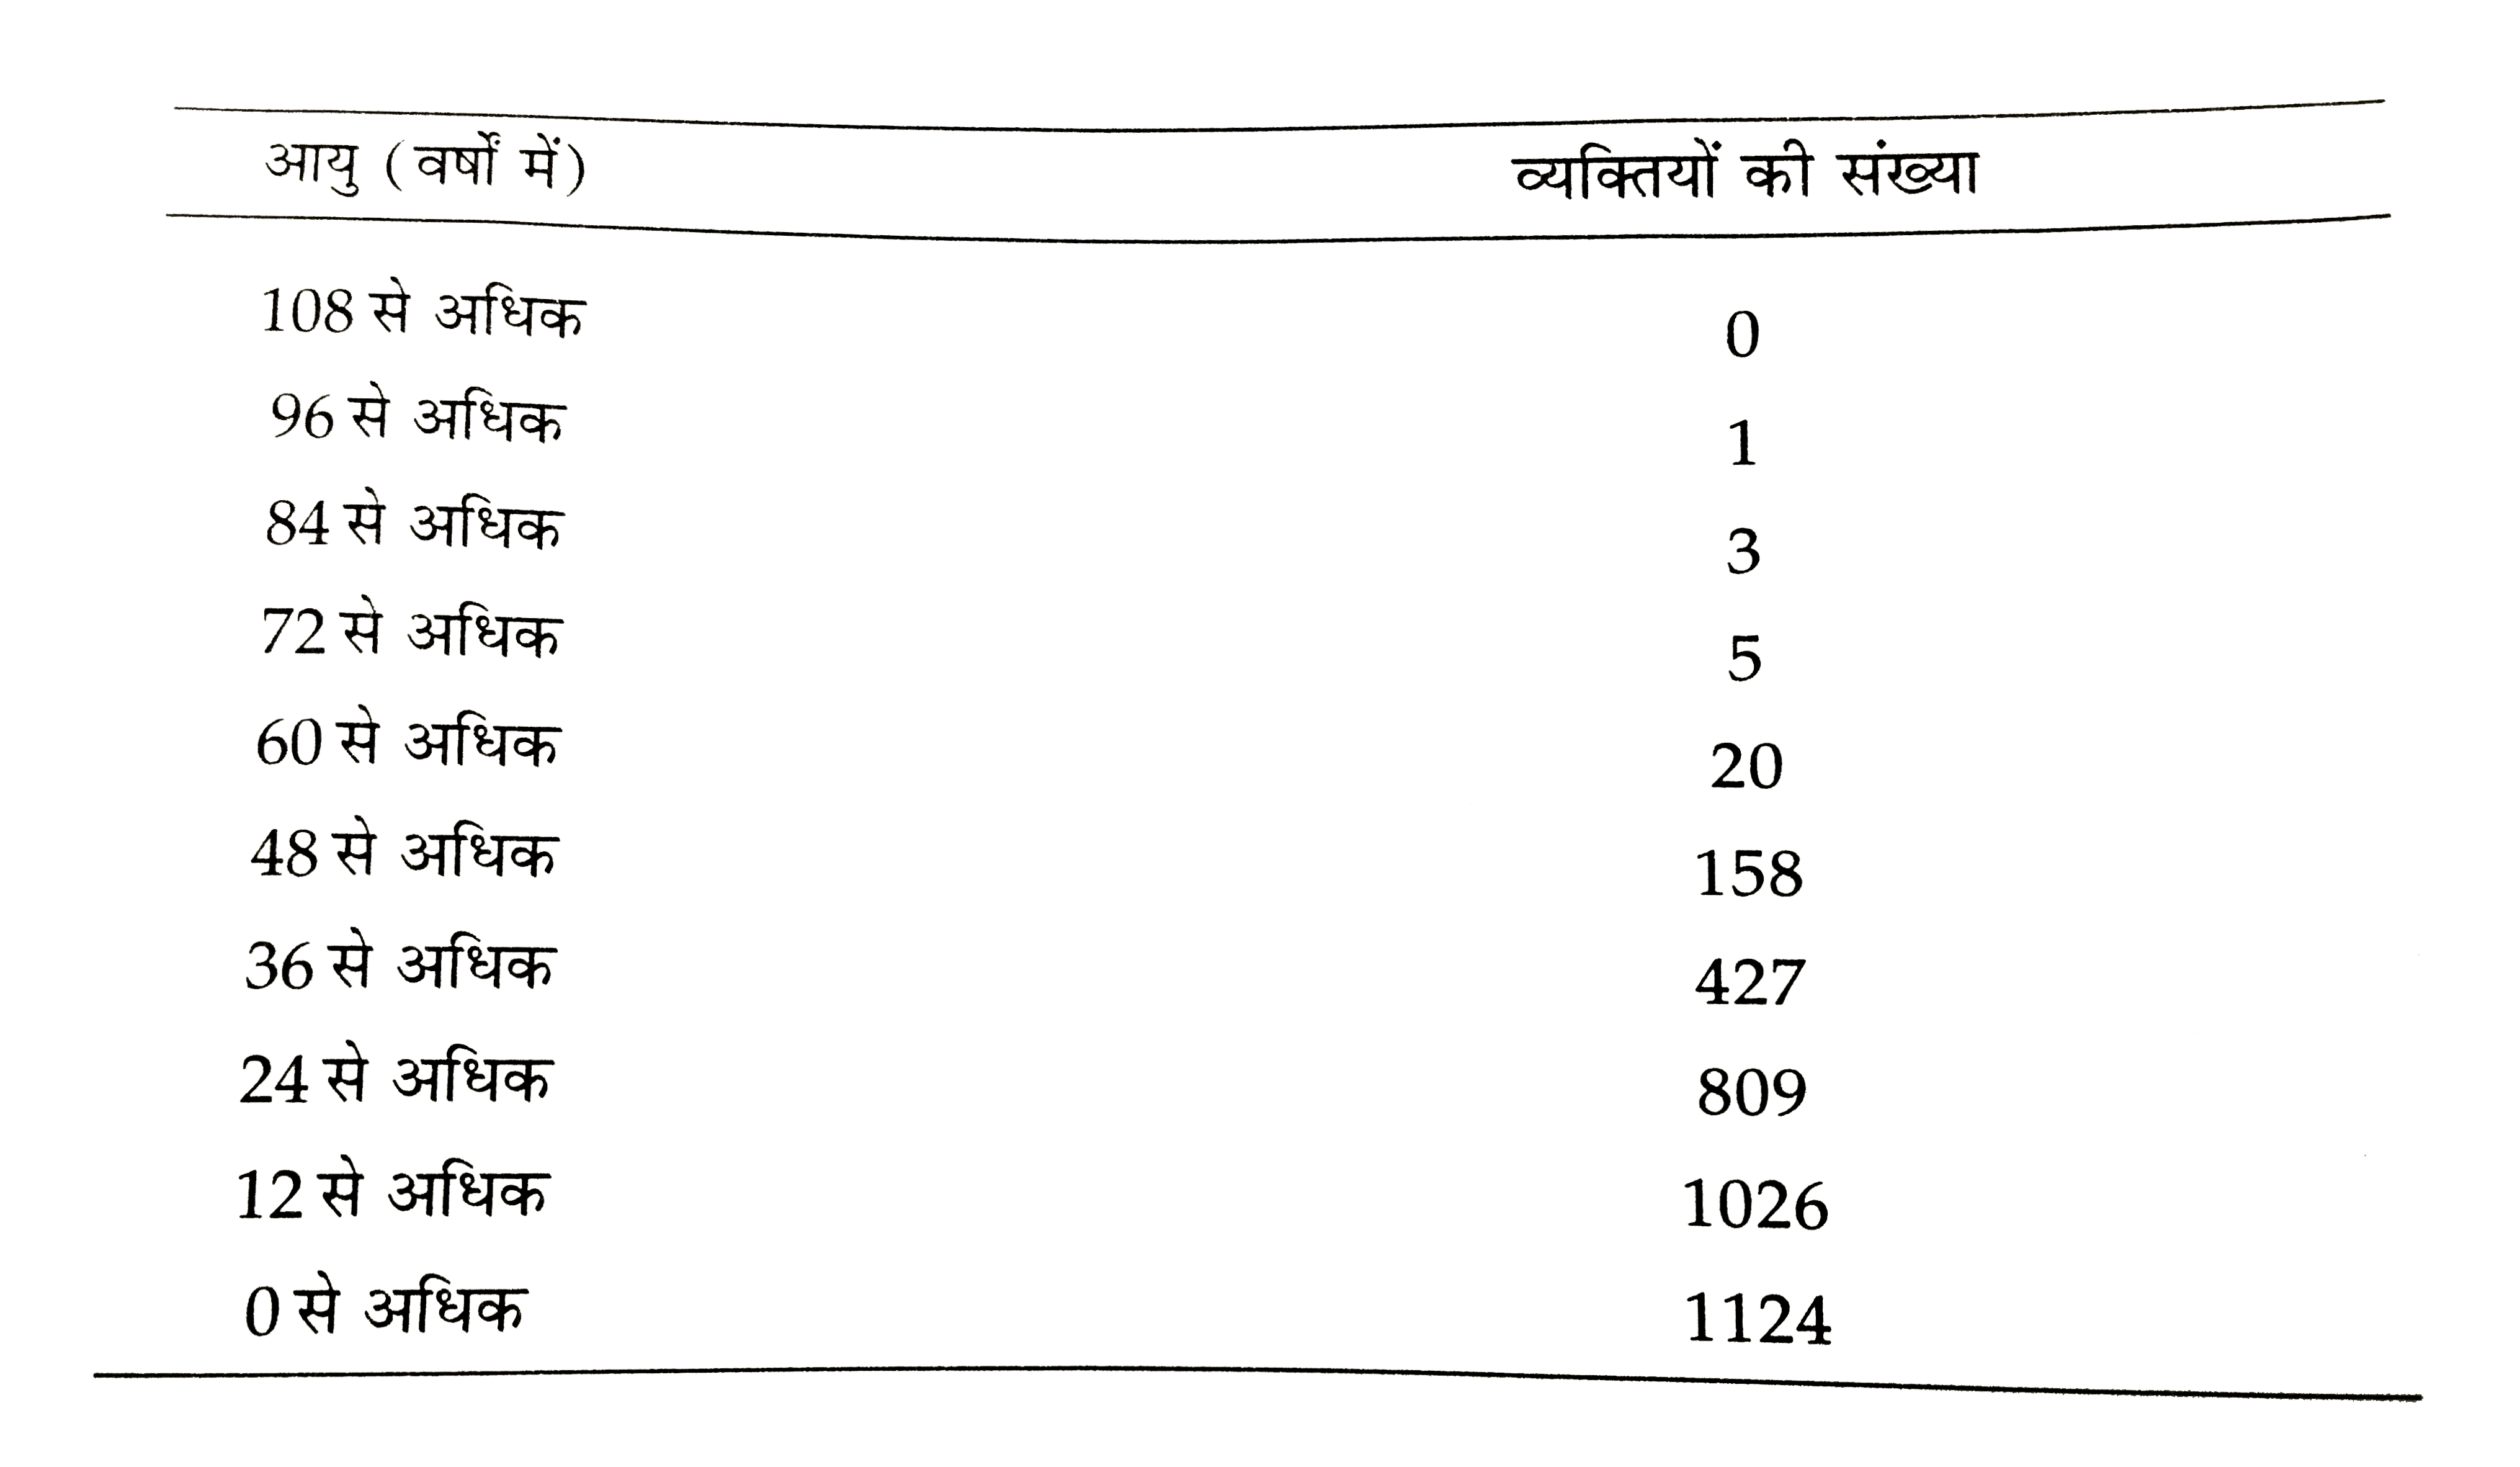
किसी स्थान में रहने वाले व्यकितयों की आयु को प्रदर्शित करने वाली एक सचयी बारम्बारता बंटन सारणी नीचे दी गयी है :

इन आकड़ो से एक बारम्बारता बंटन सारणी बनाइये |
View SolutionDraw a frequency polygon for the following grouped frequency distribution table :

View SolutionDraw a frequency polygon for the following grouped frequency distribution table.

View Solutionनिम्नलिखित बारंबारता बंटन सारणी की माध्यिका ज्ञात कीजिए-

View SolutionWhat do you mean by frequency distribution polygon?
View SolutionMean Deviation Of Grouped Data | Continuous Frequency Distribution
View Solutionनीचे दी गई बारंवारता बंटन सारणी से माध्य ज्ञात कीजिए:

View SolutionConsider the following grouped frequency distribution

find the mean of the given data
View Solution
