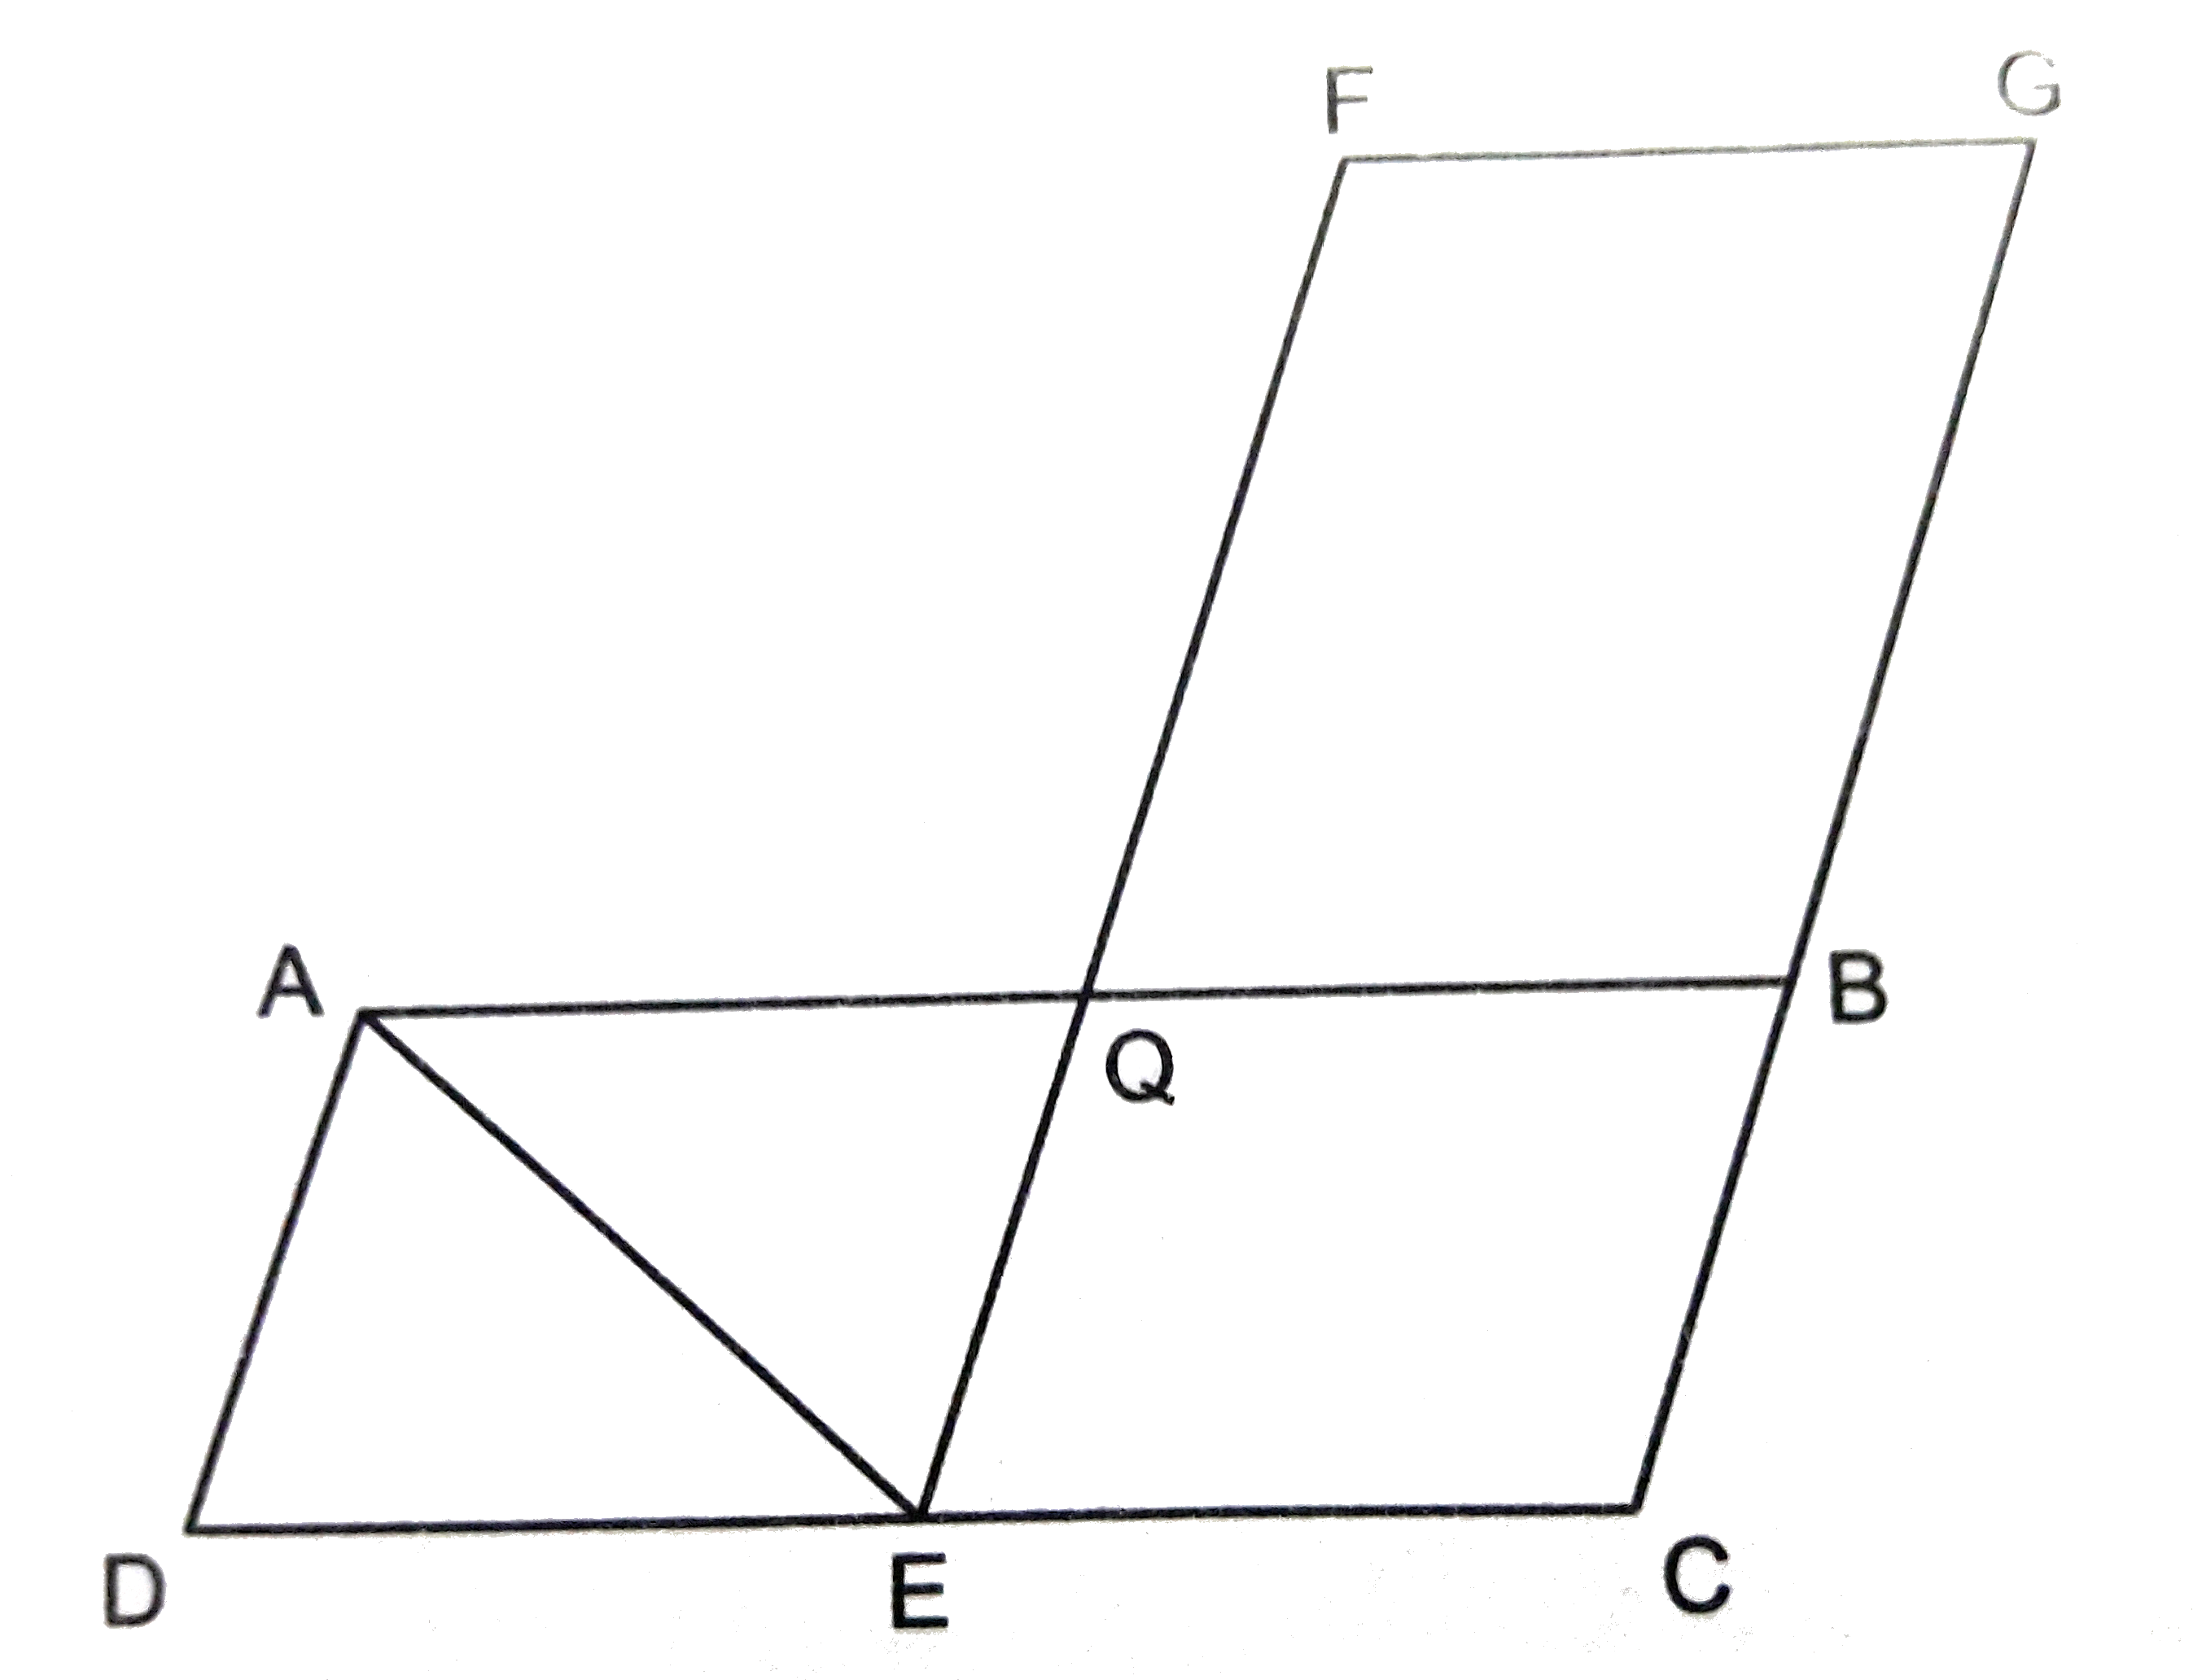
चित्र में ABCD तथा FECG समान क्षेत्रफल की दो समांतर चतुर्भुज है। यदि ar(ΔAQE)=12 वर्ग सेमी, ar(।।gmFGBQ)=

12 वर्ग सेमी
20 वर्ग सेमी
24 वर्ग सेमी
36 वर्ग सेमी
The correct Answer is:C
Step by step video & image solution for चित्र में ABCD तथा FECG समान क्षेत्रफल की दो समांतर चतुर्भुज है। यदि ar(DeltaAQE)=12 वर्ग सेमी, ar("।।"^(gm)FGBQ)= by Maths experts to help you in doubts & scoring excellent marks in Class 9 exams.
Updated on:21/07/2023Topper's Solved these Questions
- समांतर चतुर्भुजों और त्रिभुजों के क्षेत्रफल Book:RD SHARMAChapter:समांतर चतुर्भुजों और त्रिभुजों के क्षेत्रफल Exercise:अति लघुत्तरात्मक प्रश्न
Explore 9 Videos
- संख्यिकीय आंकड़ों का आलेखीय निरूपण Book:RD SHARMAChapter:संख्यिकीय आंकड़ों का आलेखीय निरूपण Exercise:बहु विकल्पीय प्रश्न
Explore 8 Videos
- सर्वांगसम त्रिभुजेंBook:RD SHARMAChapter:सर्वांगसम त्रिभुजेंExercise:बहु विकल्पीय प्रश्न
Explore 17 Videos
Similar Questions
यदि ABC व BDE दो समबाहु त्रिभुज इस प्रकार है कि बिंदु D भुजा BC का मध्य बिंदु है, तो त्रिभुज ABC और त्रिभुज BDE के क्षेत्रफल का अनुपात ज्ञात करो।
View Solutionनिम्न में से कौन - सा , सांख्यिकीय आकड़ो का लेखा चित्रीय निरूपण नहीं है ?
View Solutionयदि ΔABC≅ΔLKMहों, तो ΔLKMकी कौन सी भुजा ΔABCकी भुजा BC के एक बराबर होगी ?
View SolutionIdentify the cell organelle 'A' :-
ltimg src="https://d10lpgp6xz60nq.cloudfront.net/physics_images/ALN_BIO_C10_E08_018_Q01.png" width="80%"gt
View SolutionHow many lines of symmetry does the above figure have ?
View SolutionWhich of the following are correct chain isomers of butane ? (i)
View SolutionDetermine the point of symmetry of a regular hexagon.
View SolutionDtermine the images of the following figure about the given line :
View SolutionMatch the following Column A to Column B

View SolutionMatch the following Column A to Column B

View SolutionMatch the following Column A to Column B

View SolutionFind the area of the figure given below.

View SolutionThe area of the shaded part in the figure given below is ______.

View SolutionThe inequation represented by the graph given below is :
View SolutionThe inequation that best describes the graph given below is _________
View Solution
