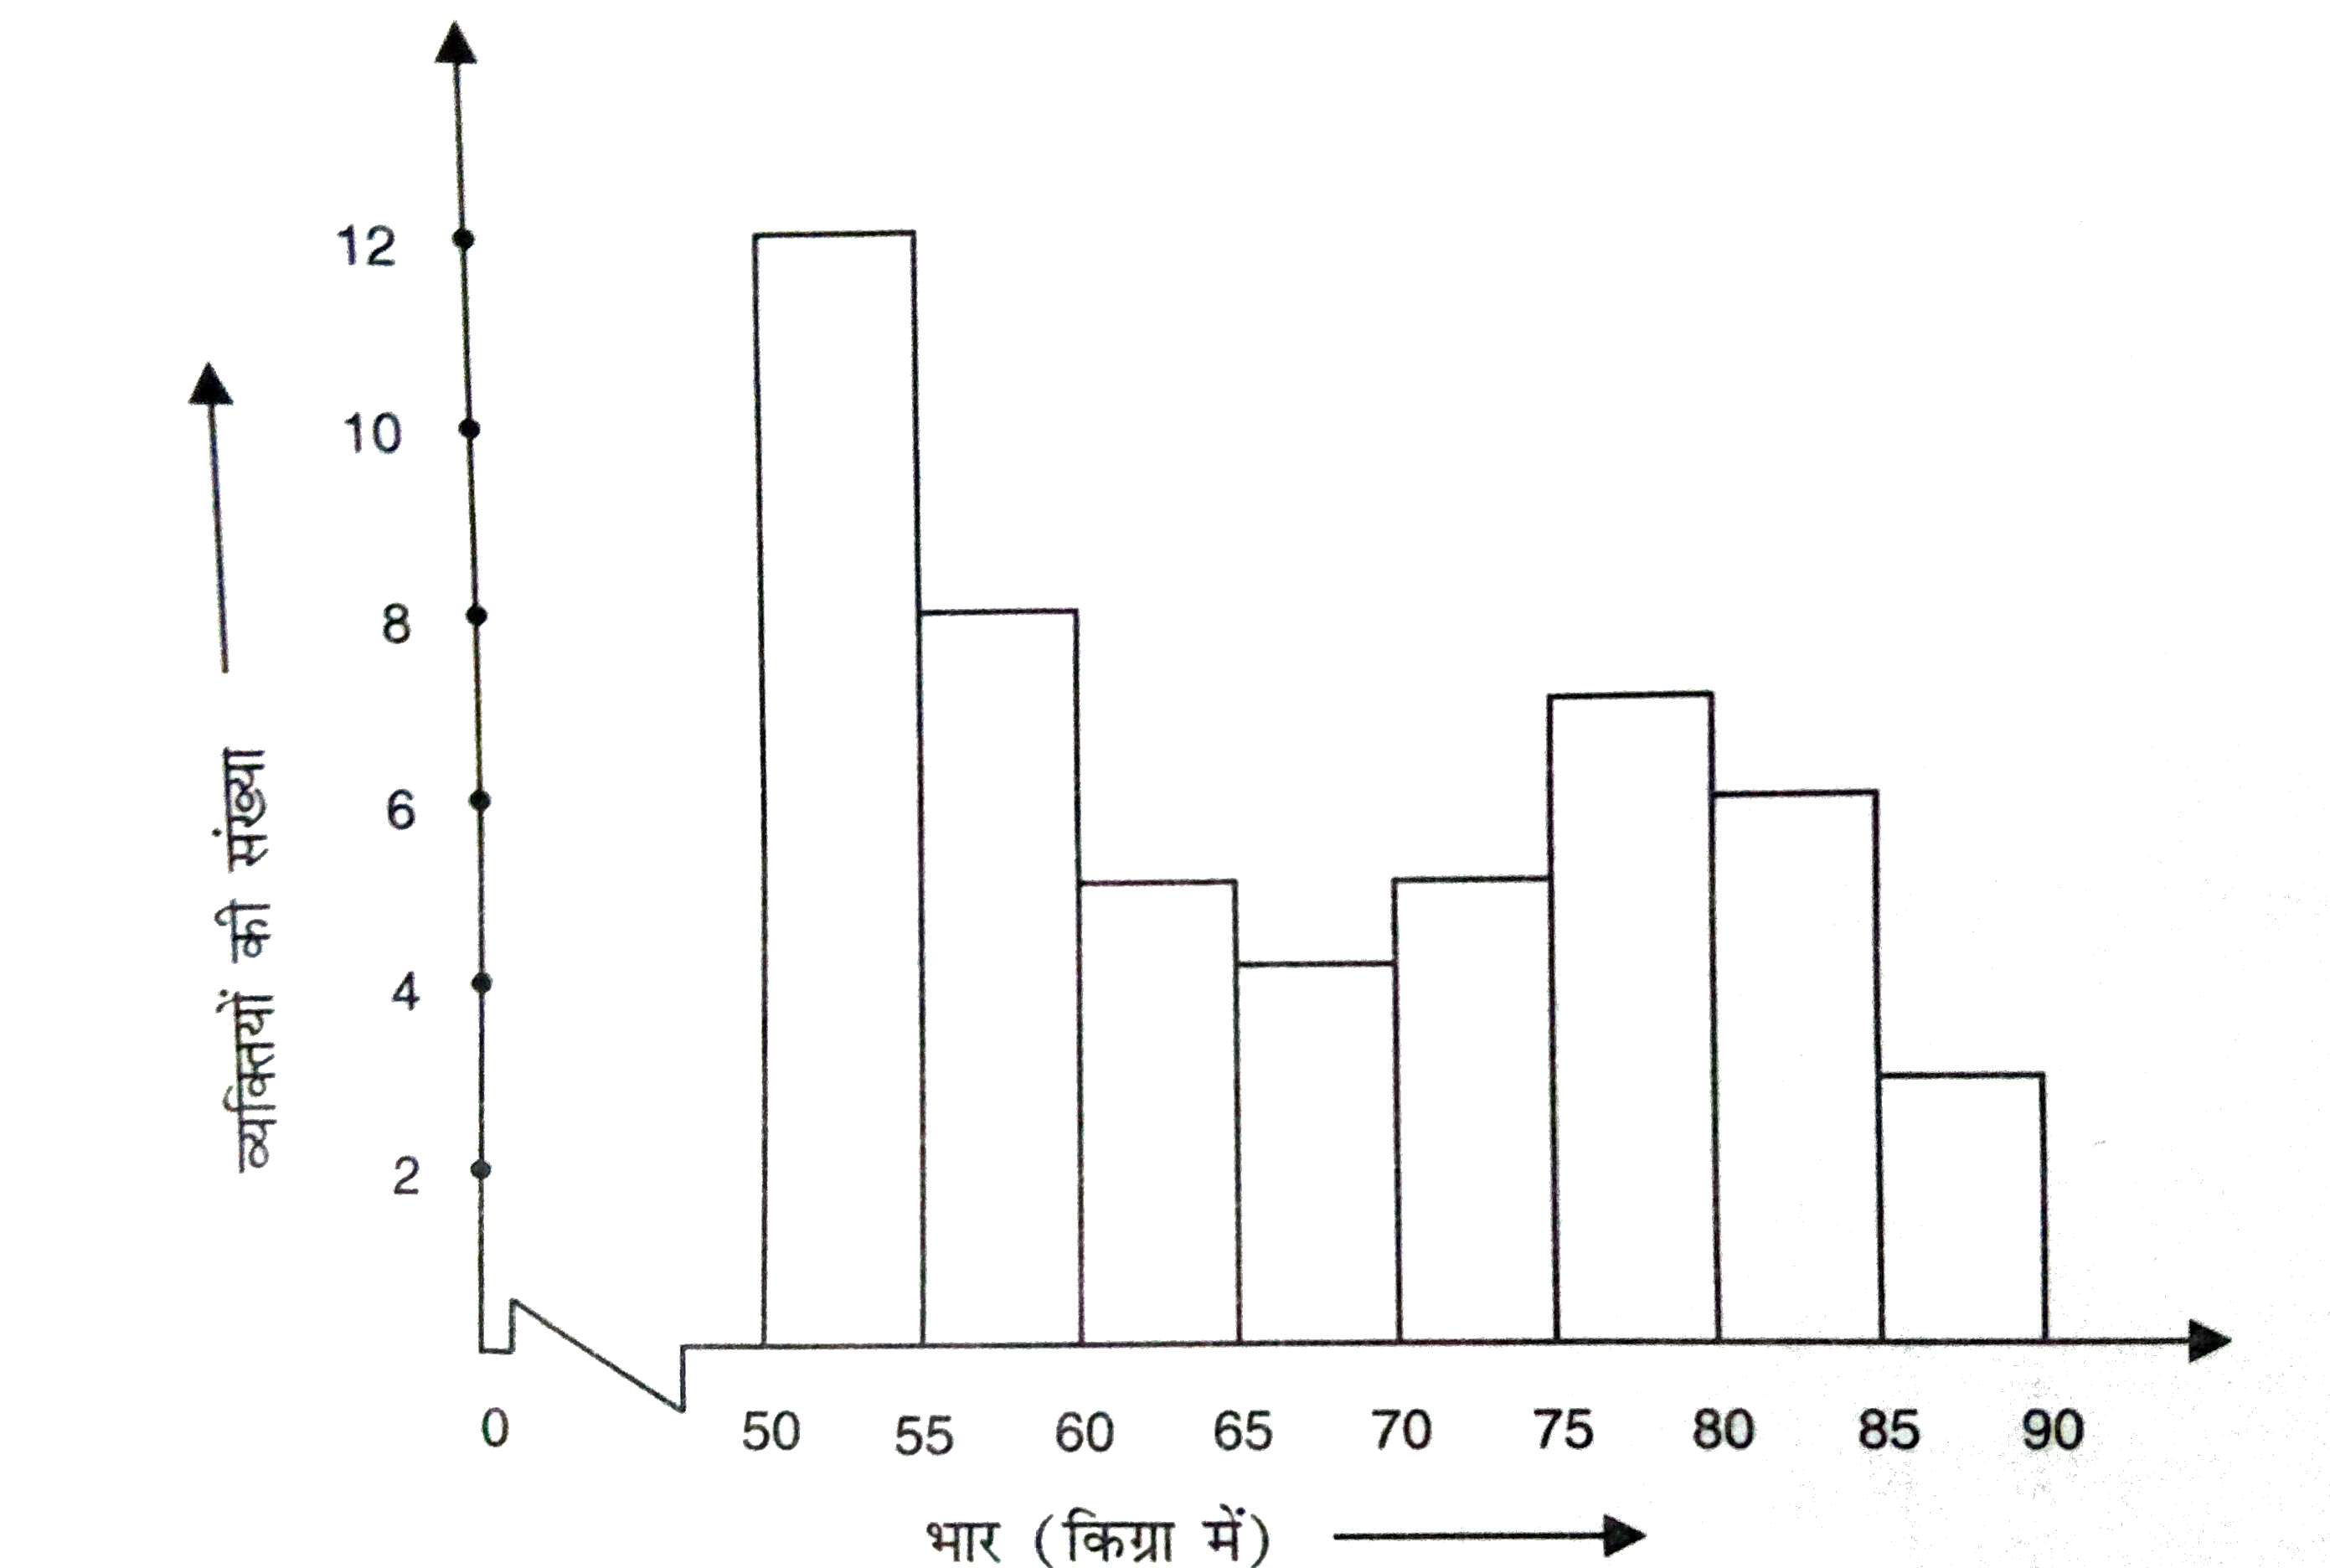
50 व्यक्तियों के भारो ( किग्रा में ) का बारम्बारता बंटन निम्नवत है :

उपरोक्त आकड़ो को एक आयत चित्र द्वारा निरूपित कीजिये ।
हम एक उचित पैमाना लेकर वर्ग सीमाओं को X- अक्ष के अनुदिश तथा बारम्बारताओ को Y- अक्ष के अनुदिश निरूपित करते है ।
चूँकि X- अक्ष पर पैमाना 50 से प्रारम्भ होता है । , अतः मूलबिंदु के निकट एक रिक्त स्थान इस बात को स्पष्ट करता है खींचा गया आलेख 50 पर प्रारम्भ होता है , मूलबिंदु पर नहीं ।

Topper's Solved these Questions
- BOOK - RD SHARMACHAPTER - संख्यिकीय आंकड़ों का आलेखीय निरूपण EXERCISE - प्रश्नावली 23.14videos
संख्यिकीय आंकड़ों का आलेखीय निरूपण
- BOOK - RD SHARMACHAPTER - संख्यिकीय आंकड़ों का आलेखीय निरूपण EXERCISE - प्रश्नावली 23.27videos
संख्यिकीय आंकड़ों का आलेखीय निरूपण
- BOOK - RD SHARMACHAPTER - संख्या पद्धति EXERCISE - बहु विकल्पीय प्रश्न21videos
संख्या पद्धति
- BOOK - RD SHARMACHAPTER - समांतर चतुर्भुजों और त्रिभुजों के क्षेत्रफल EXERCISE - बहु विकल्पीय प्रश्न20videos
समांतर चतुर्भुजों और त्रिभुजों के क्षेत्रफल
Similar Questions
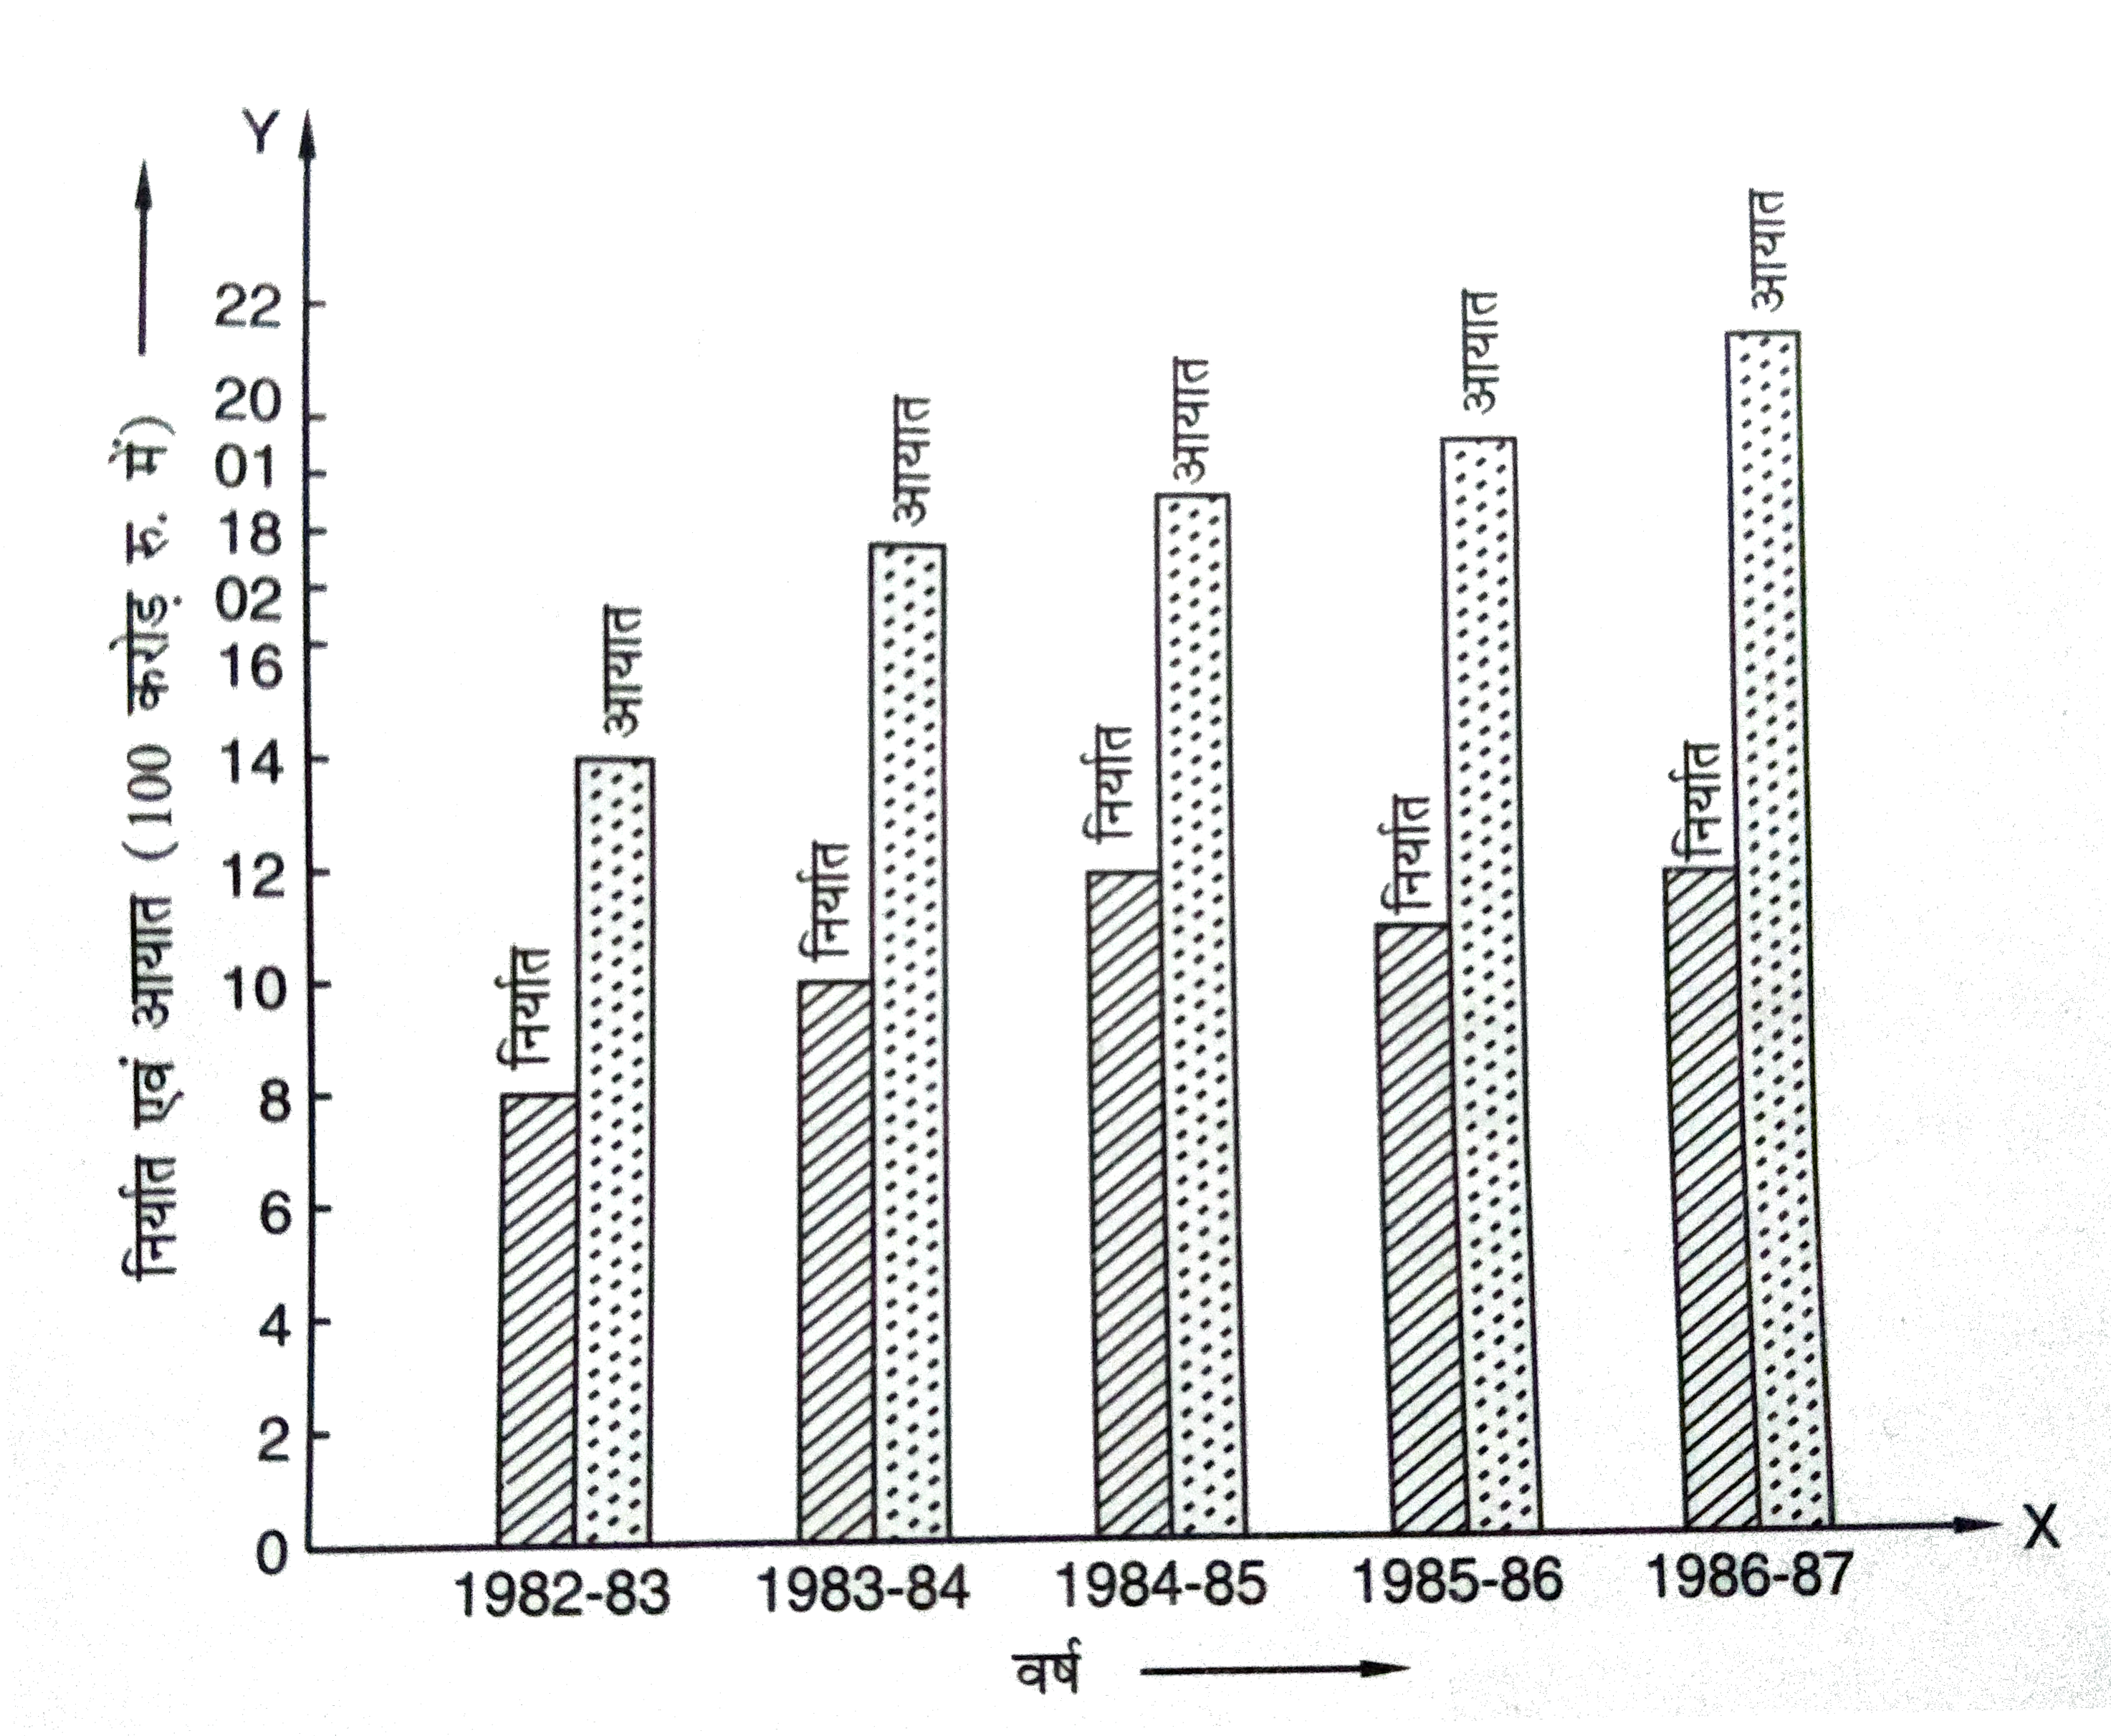
निम्न दंड आलेख को पढ़कर निम्न प्रश्नो के उत्तर दीजिए ।
(i) दंड आलेख से क्या सुचना प्राप्त होती है ?
(ii) किस वर्ष में निर्यात निम्नतम है ?
(iii) किस वर्ष में आयात अधिकतम है ?
(iv) आयात और निर्यात के मानो का अन्तर किस वर्ष में अधिकतम है ?

(i)01:37View Solutionनिम्नलिखित आंकड़ों से एक आयत चित्र बनाइये :
 06:07View Solution
निम्न में से कौन सा कथन सत्य है?
02:11View Solutionयदि दो समांतर चतुर्भुजों का एक ही आधार है और समान समांतर रेखाओं के बीच स्थित है तो उनके क्षेत्रफलों के बीच क्या अनुपात होगा :
01:31View SolutionHow many lines of symmetry does the above figure have ?
02:45View SolutionWhich of the following are correct chain isomers of butane ? (i)
02:17View SolutionDetermine the point of symmetry of a regular hexagon.
05:41View SolutionDtermine the images of the following figure about the given line :
02:21View SolutionMatch the following Column A to Column B
 02:03View Solution
Match the following Column A to Column B
 02:10View Solution
Match the following Column A to Column B
 02:17View Solution
Find the area of the figure given below.
 02:10View Solution
The area of the shaded part in the figure given below is ______.
 04:23View Solution
The inequation represented by the graph given below is :
01:13View SolutionThe inequation that best describes the graph given below is _________
03:12View SolutionThe inequation that best describes the following graph is _________
05:46View Solution

