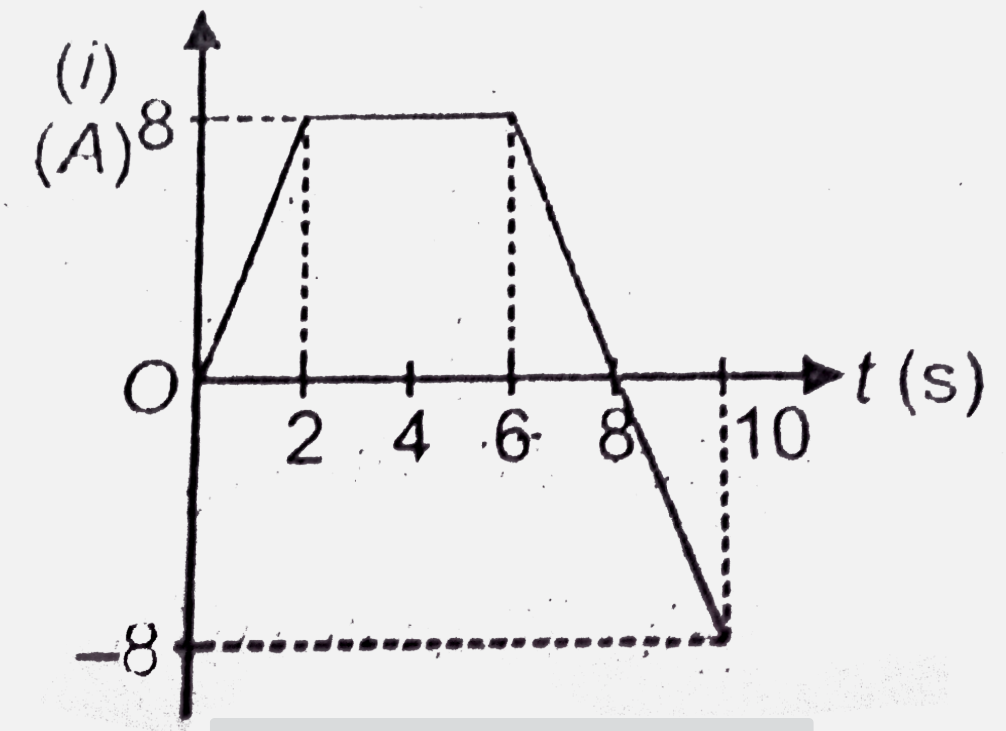
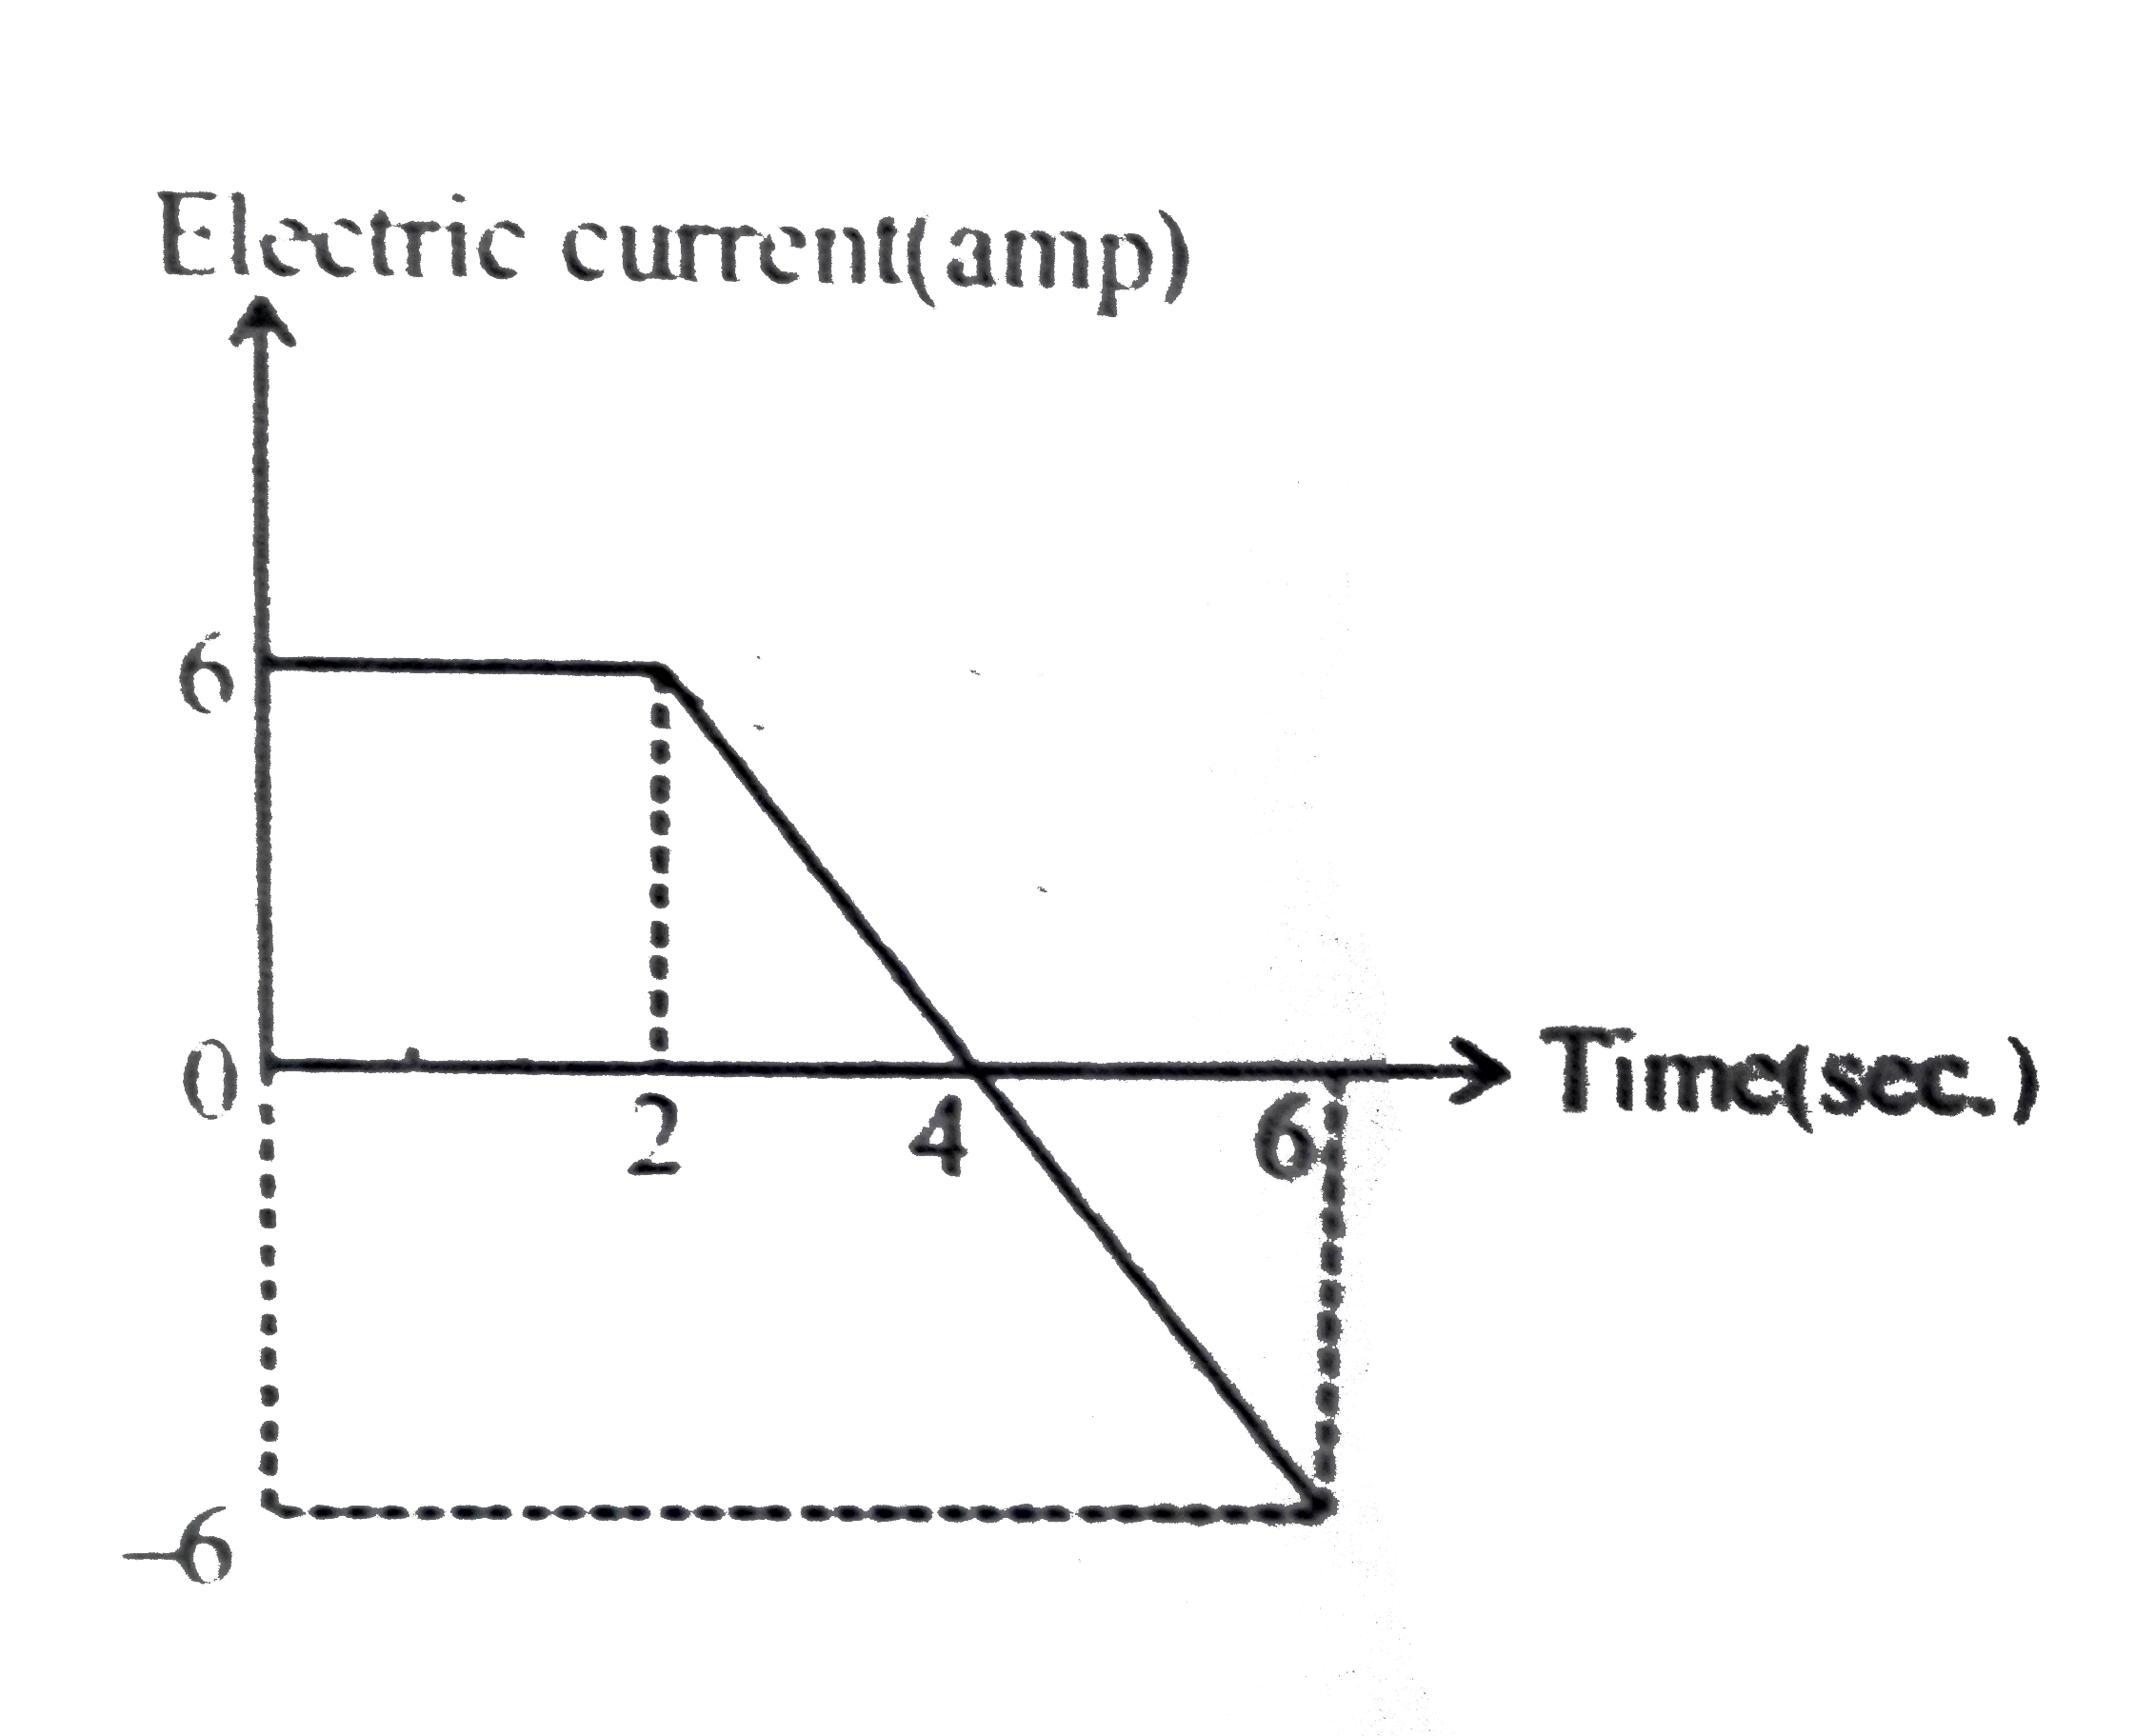
If Electric-current 'i' time (t) graph shown in figure. The average current in first 6 sec. is :-
A
1 amp
B
2 amp
C
6 amp
D
3 amp
Video Solution
Text Solution
The correct Answer is:B
iavg=area under (i-t) vurve(0−6)time interval(0−6)
=6×2(12×2×6)−12×2×66−0
=2amp.
|
Updated on:21/07/2023
Topper's Solved these Questions
Similar Questions
Knowledge Check
- Question 1 - Select One
Find current (i) in circuit shown in figure.
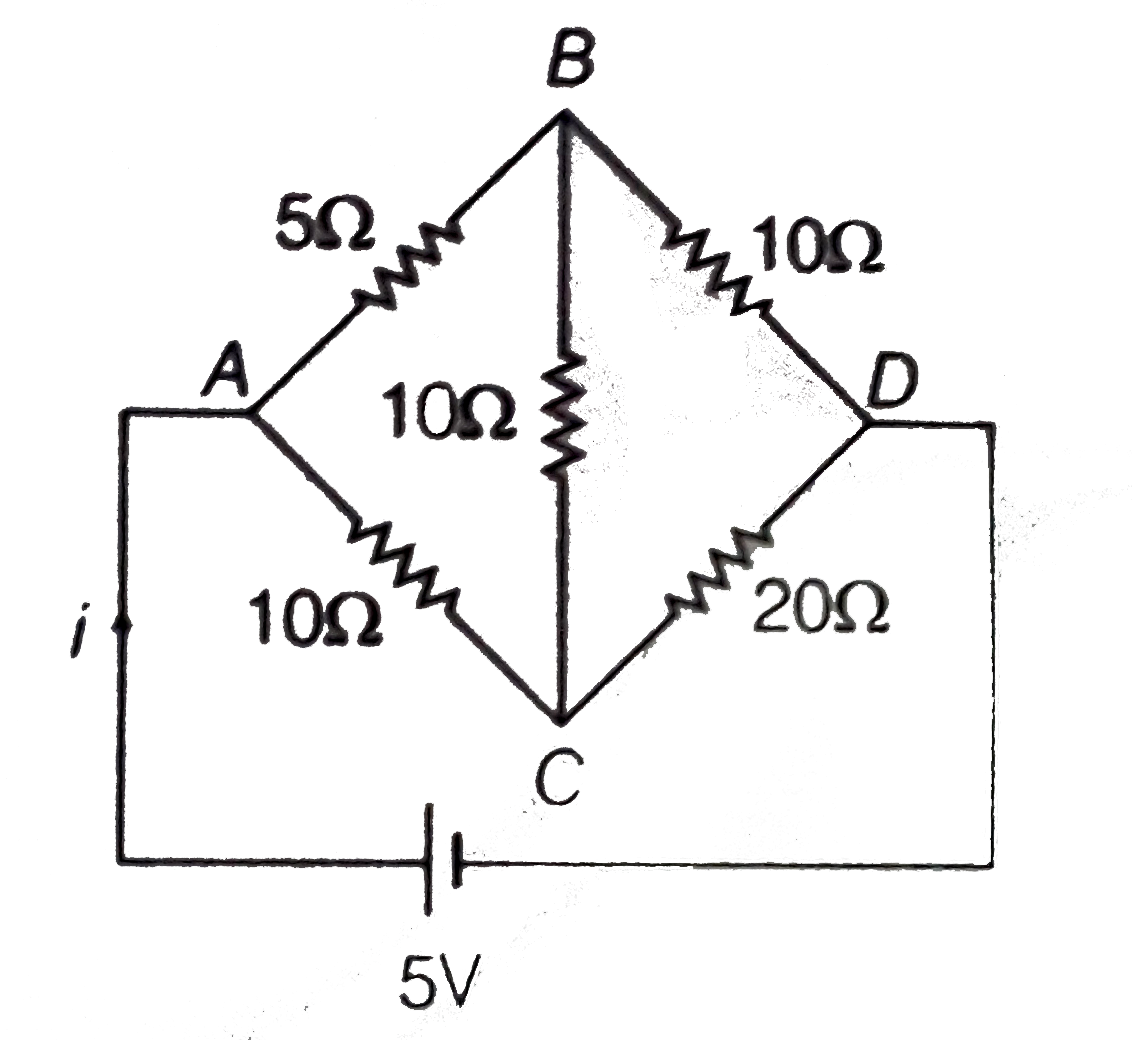 A0.5 AB0.2 AC0.041666666666667D0.083333333333333
 - Question 2 - Select One
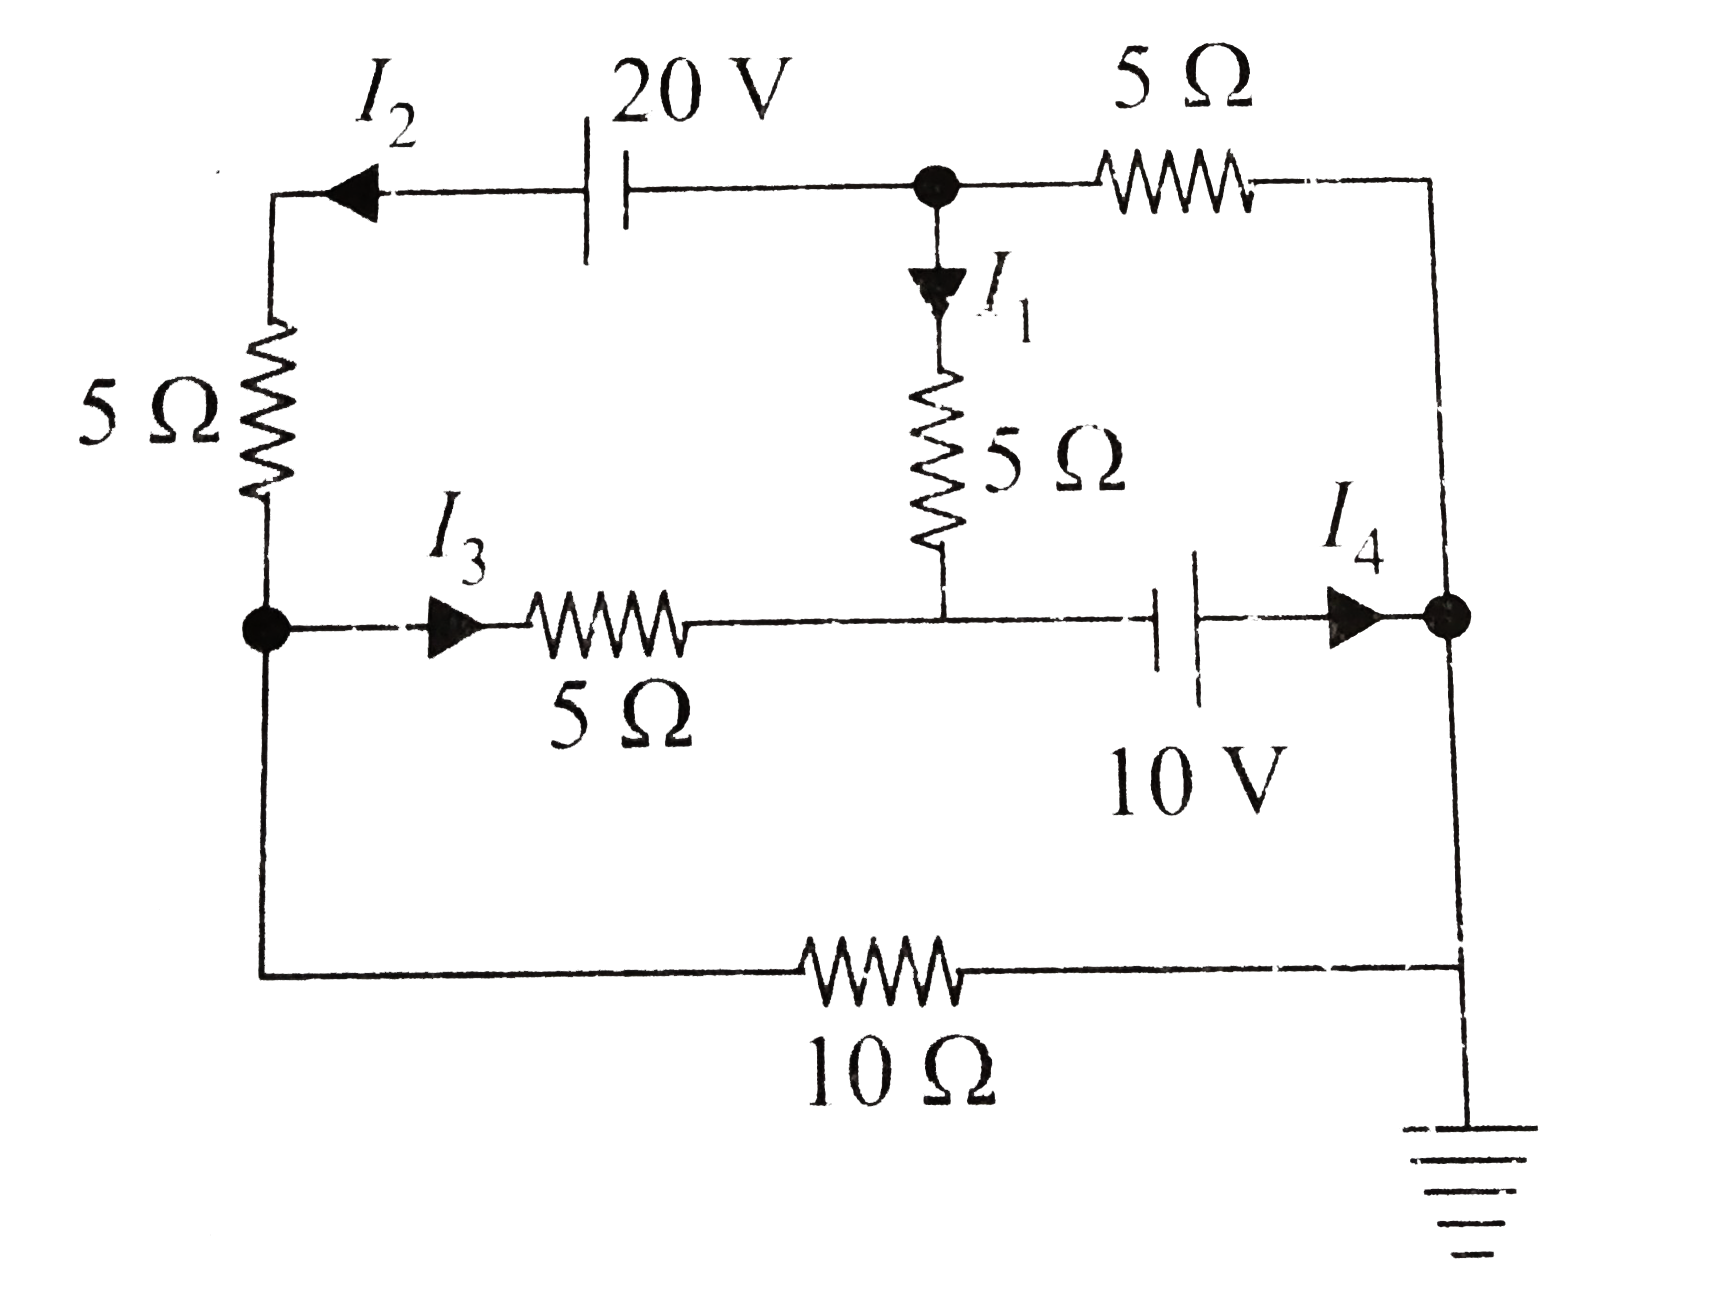
In the circuit shown in the figure
 .
.
The value of current I4 isA2ABzeroC2.5 ADnone of these - Question 3 - Select One
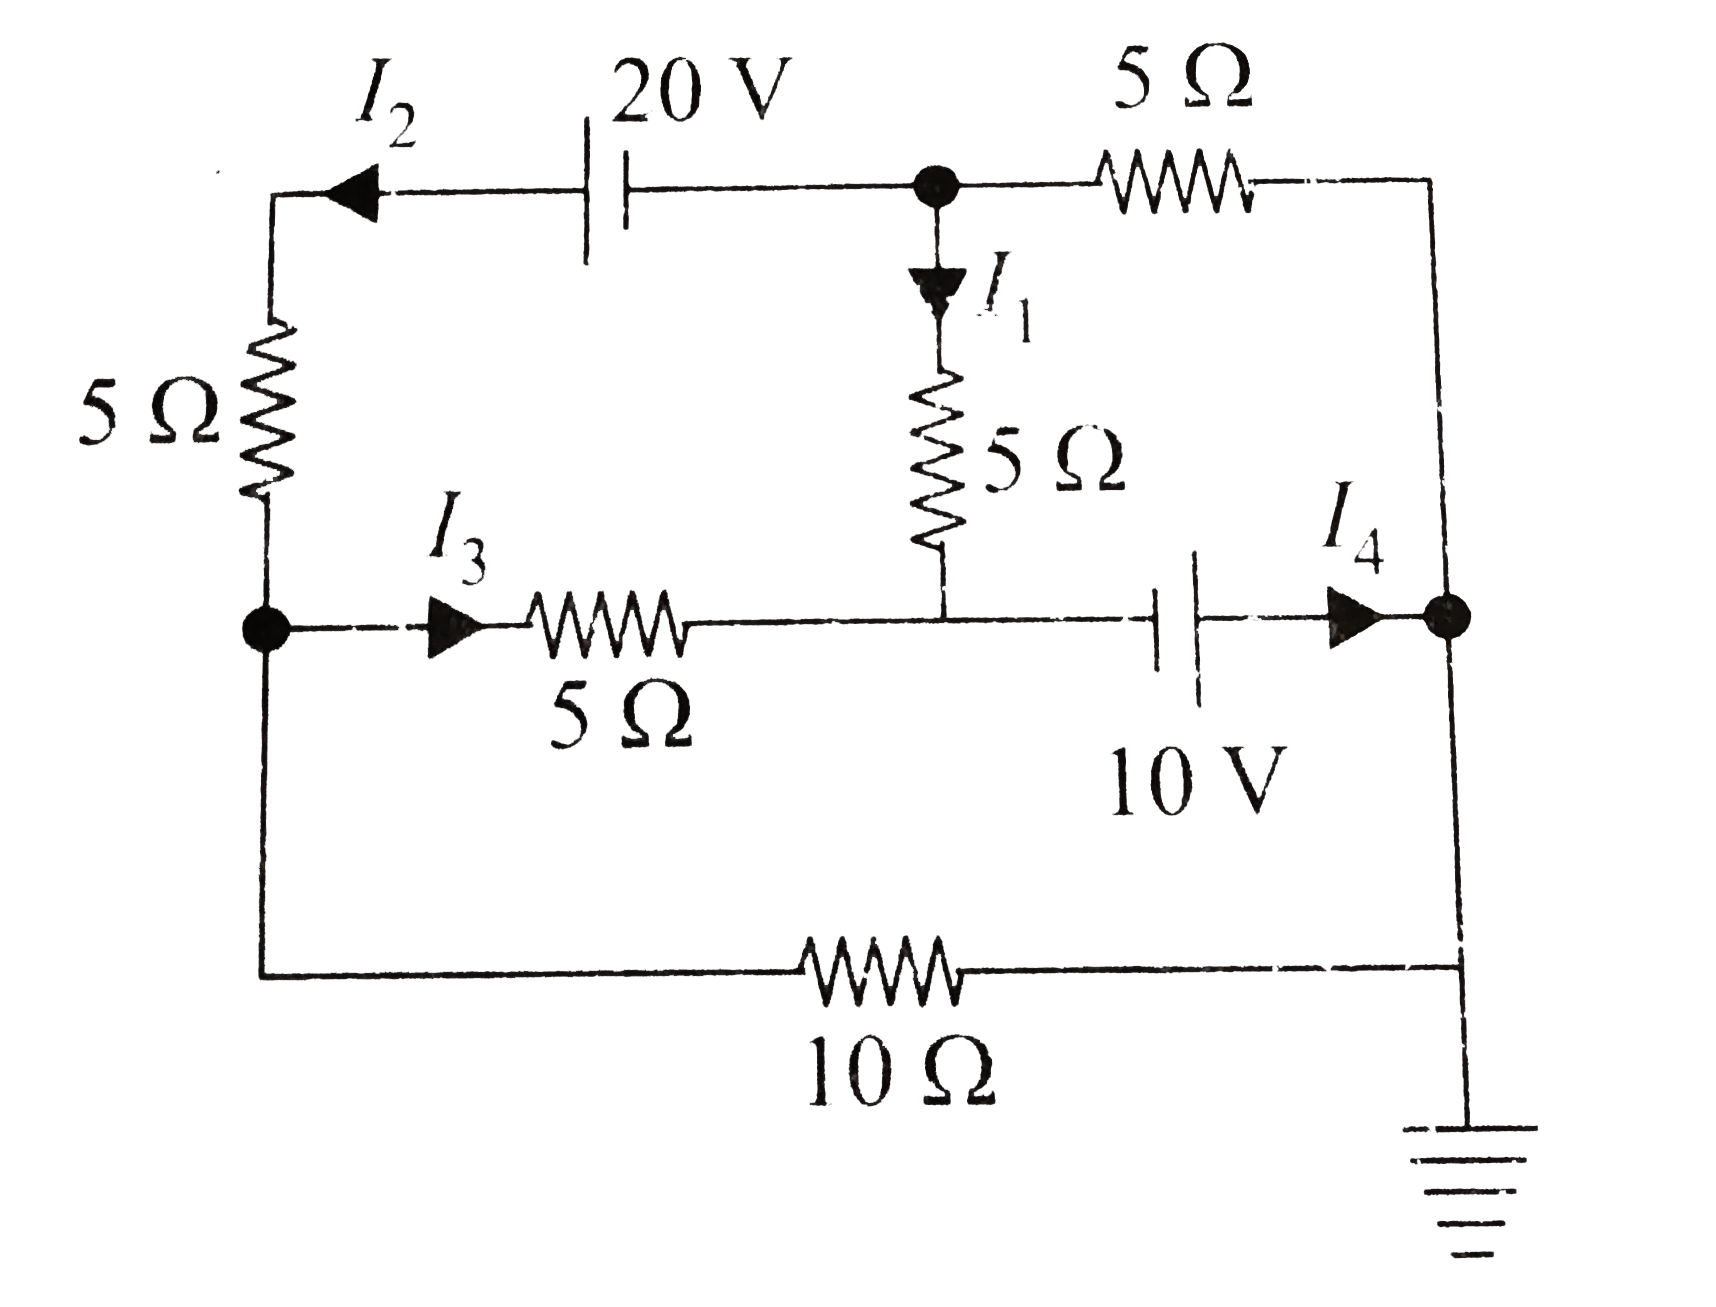
In the circuit shown in the figure
 .
.
The value of current I1 isA2ABzeroC2.5 ADnone of these
The current in a certain circuit varies with time as shown in figure. Find the average current and the rms current in terms of I0
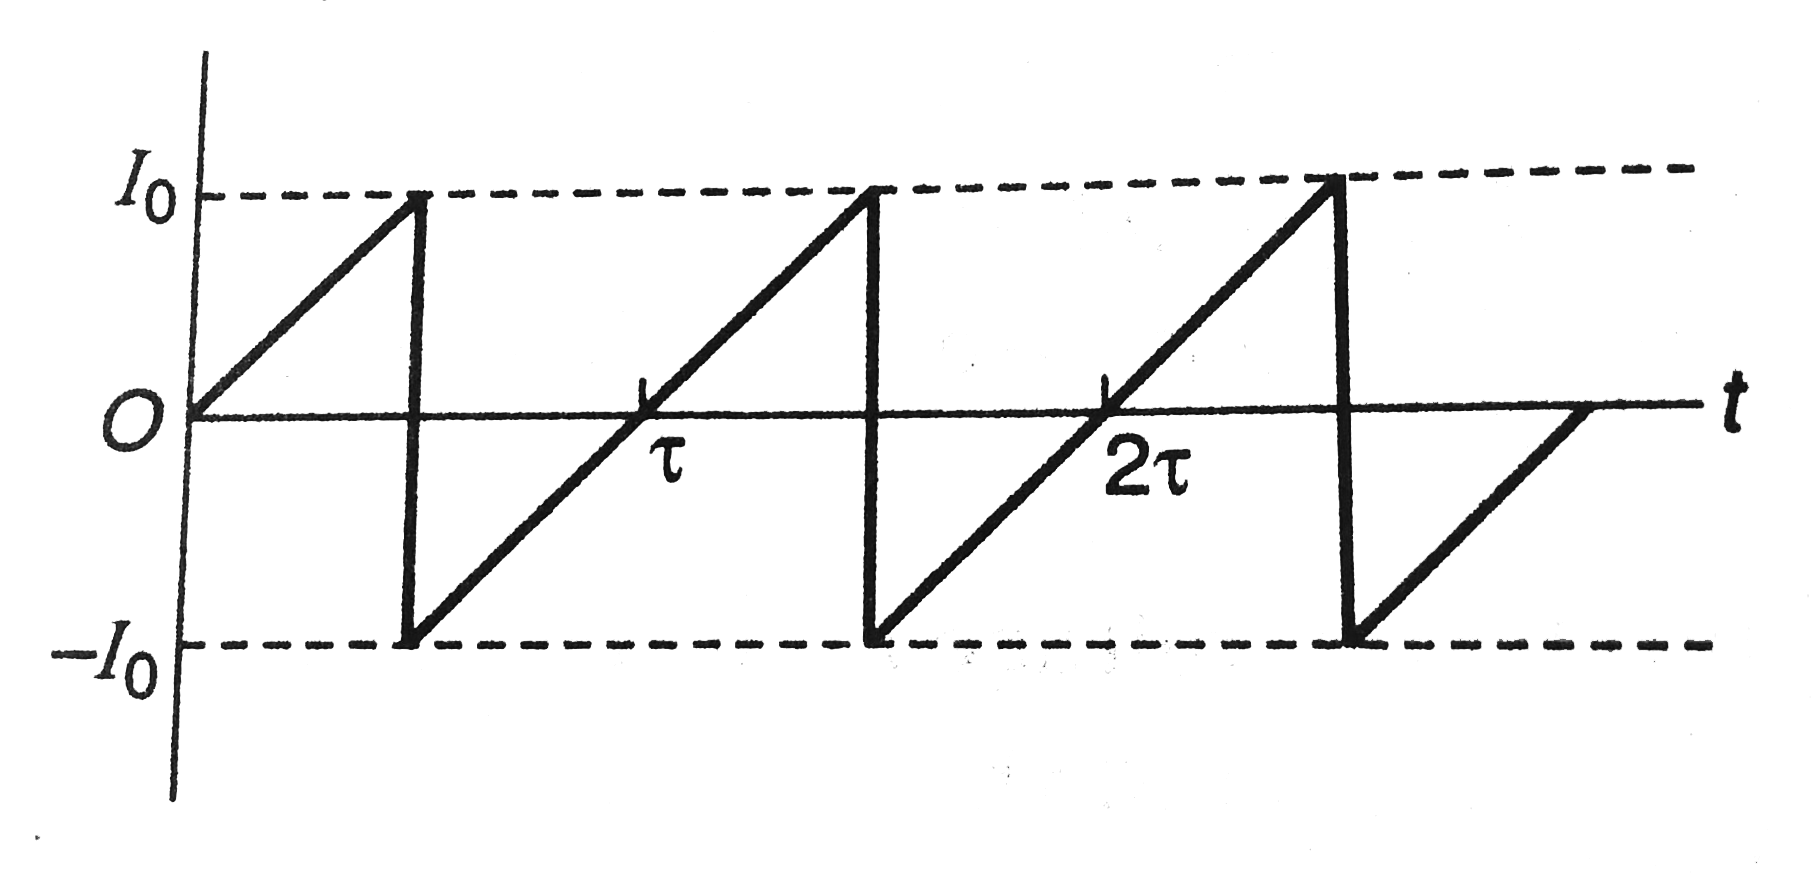 .View Solution
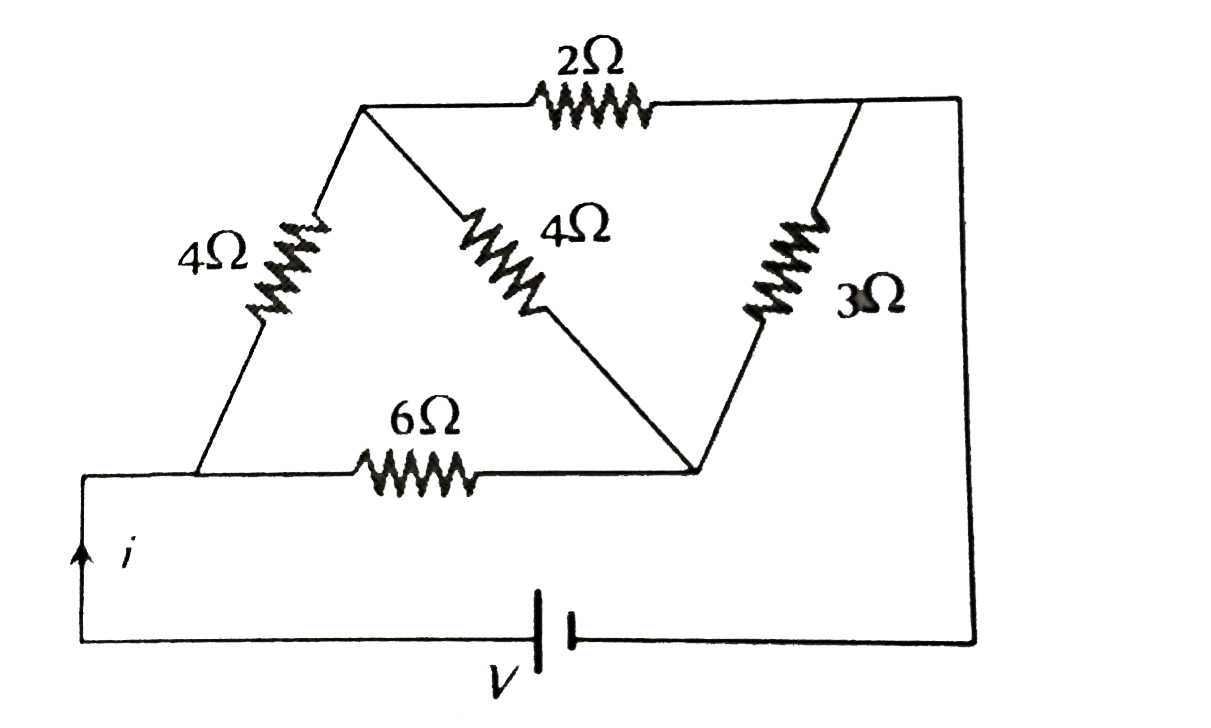
For the network shown in the figure the value of the current i is :–
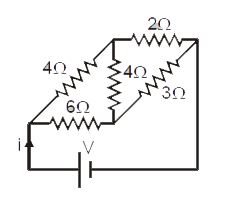 View Solution
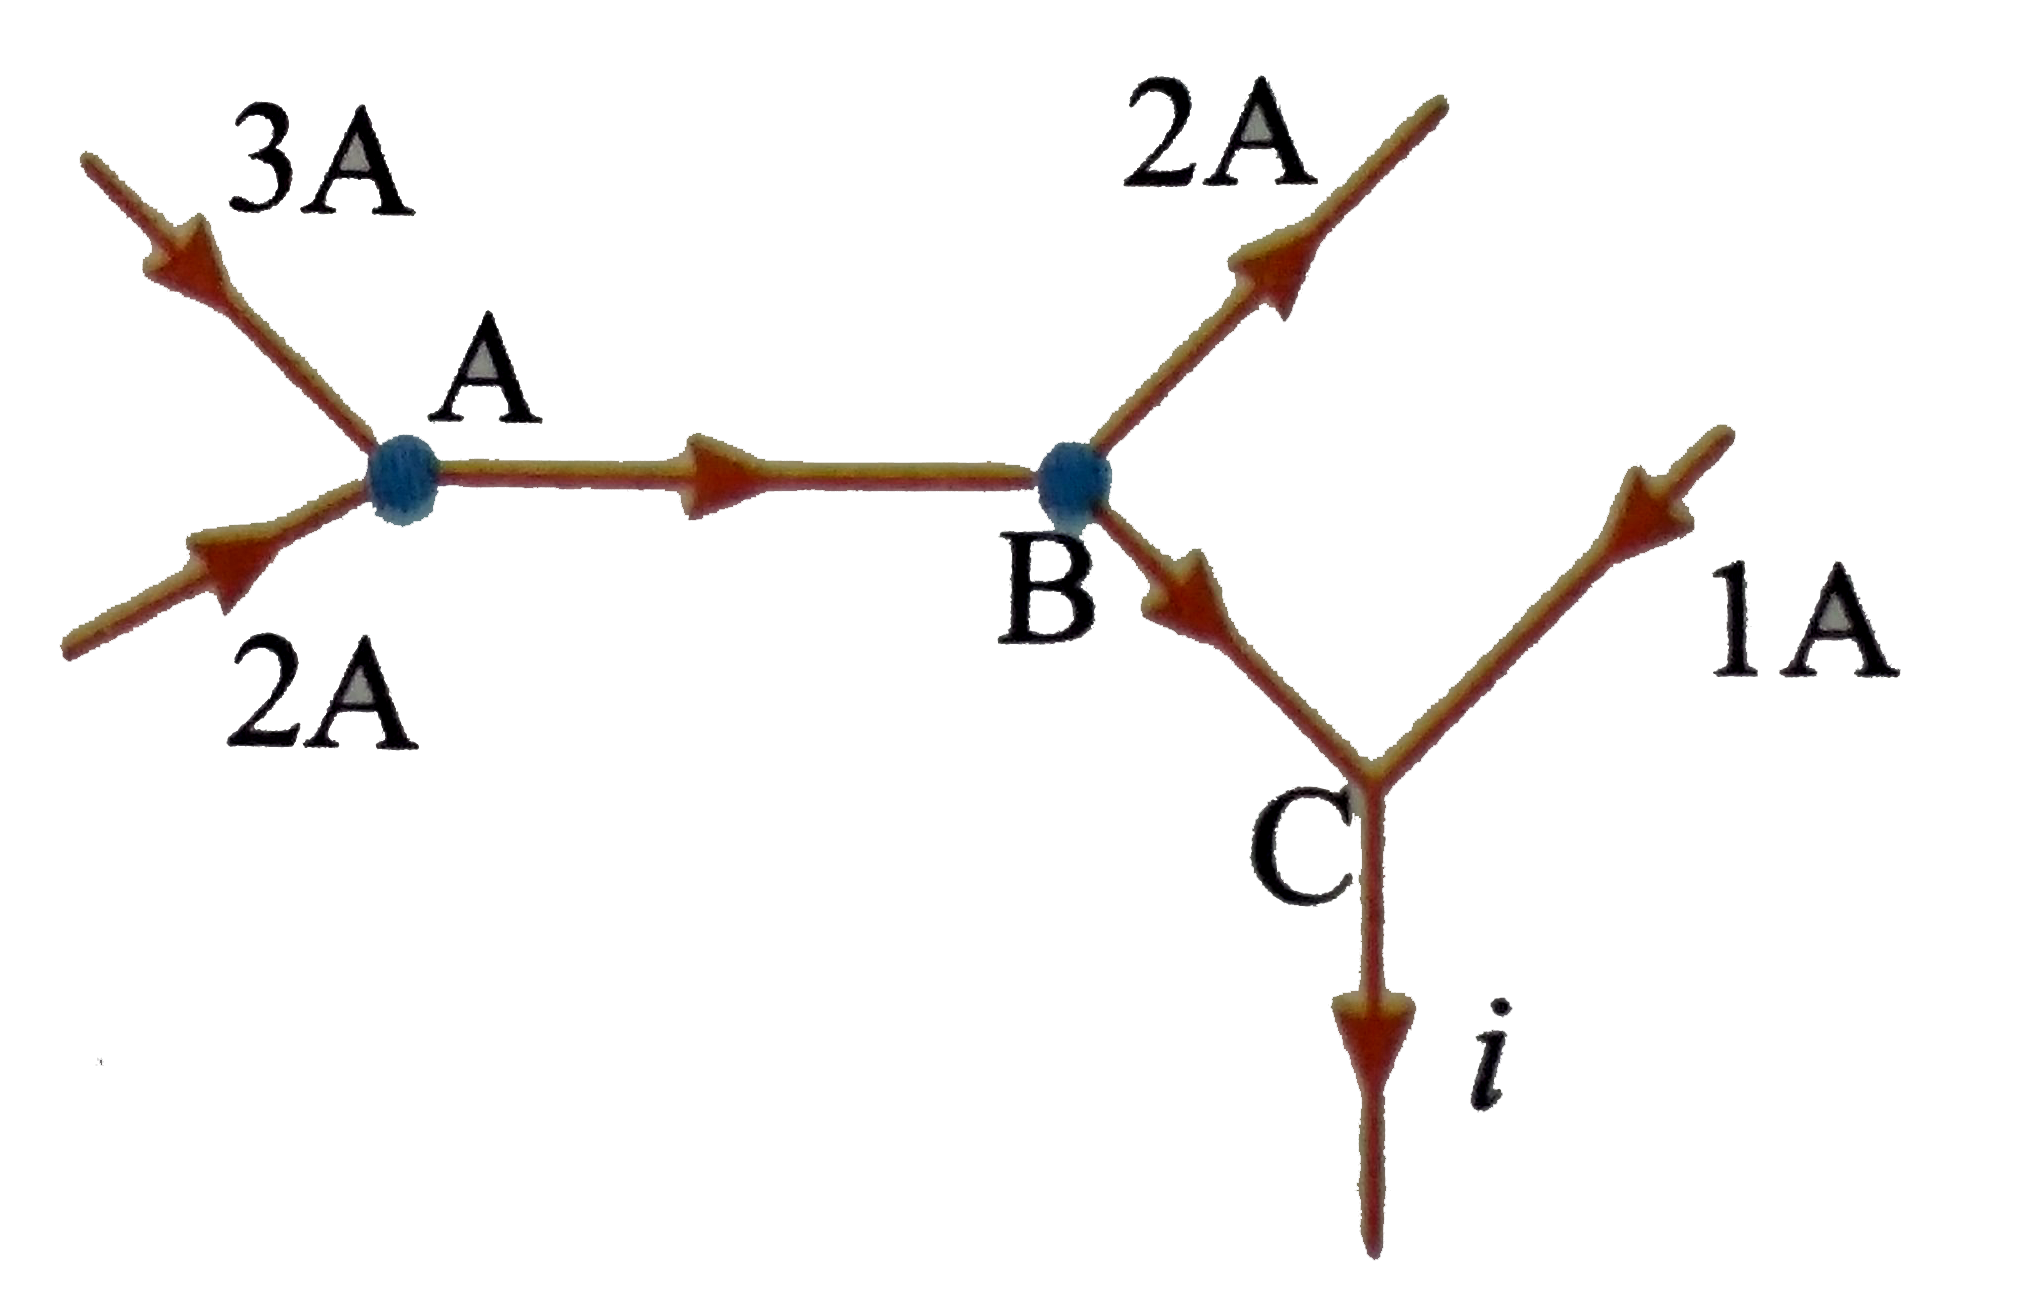
The electric current I in the circuit shown isView SolutionFor the network shown in the figure, the value of the current i is
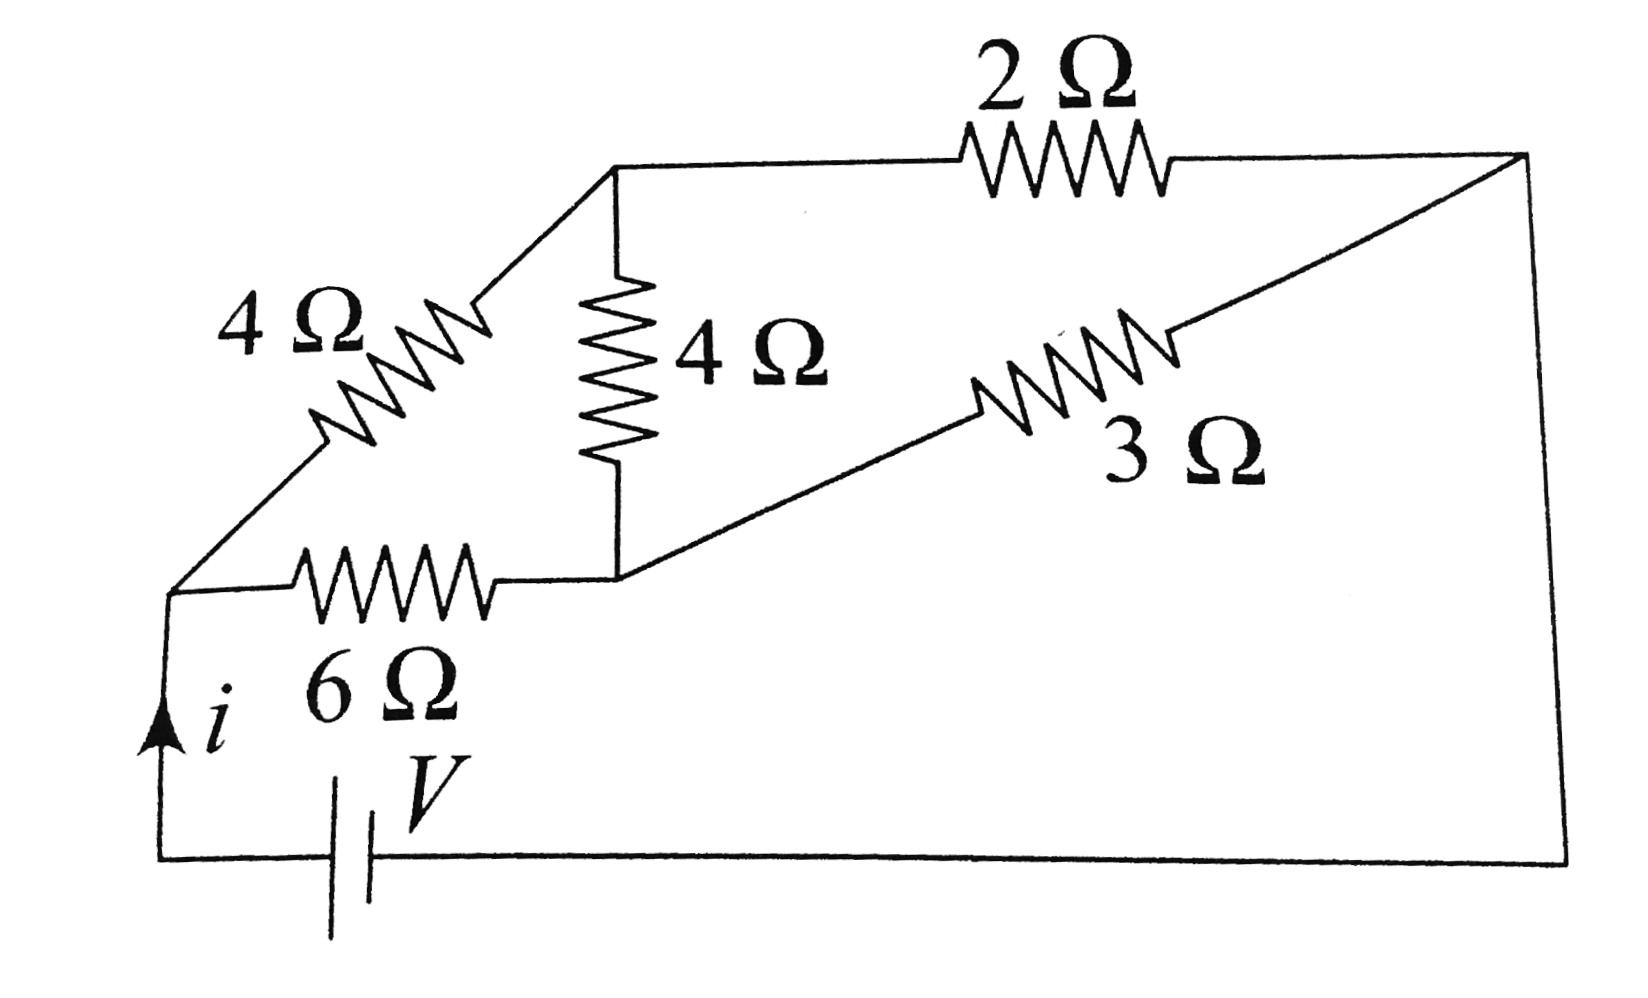 View Solution
Current varies with time as shown in the graph

The current isView Solution


