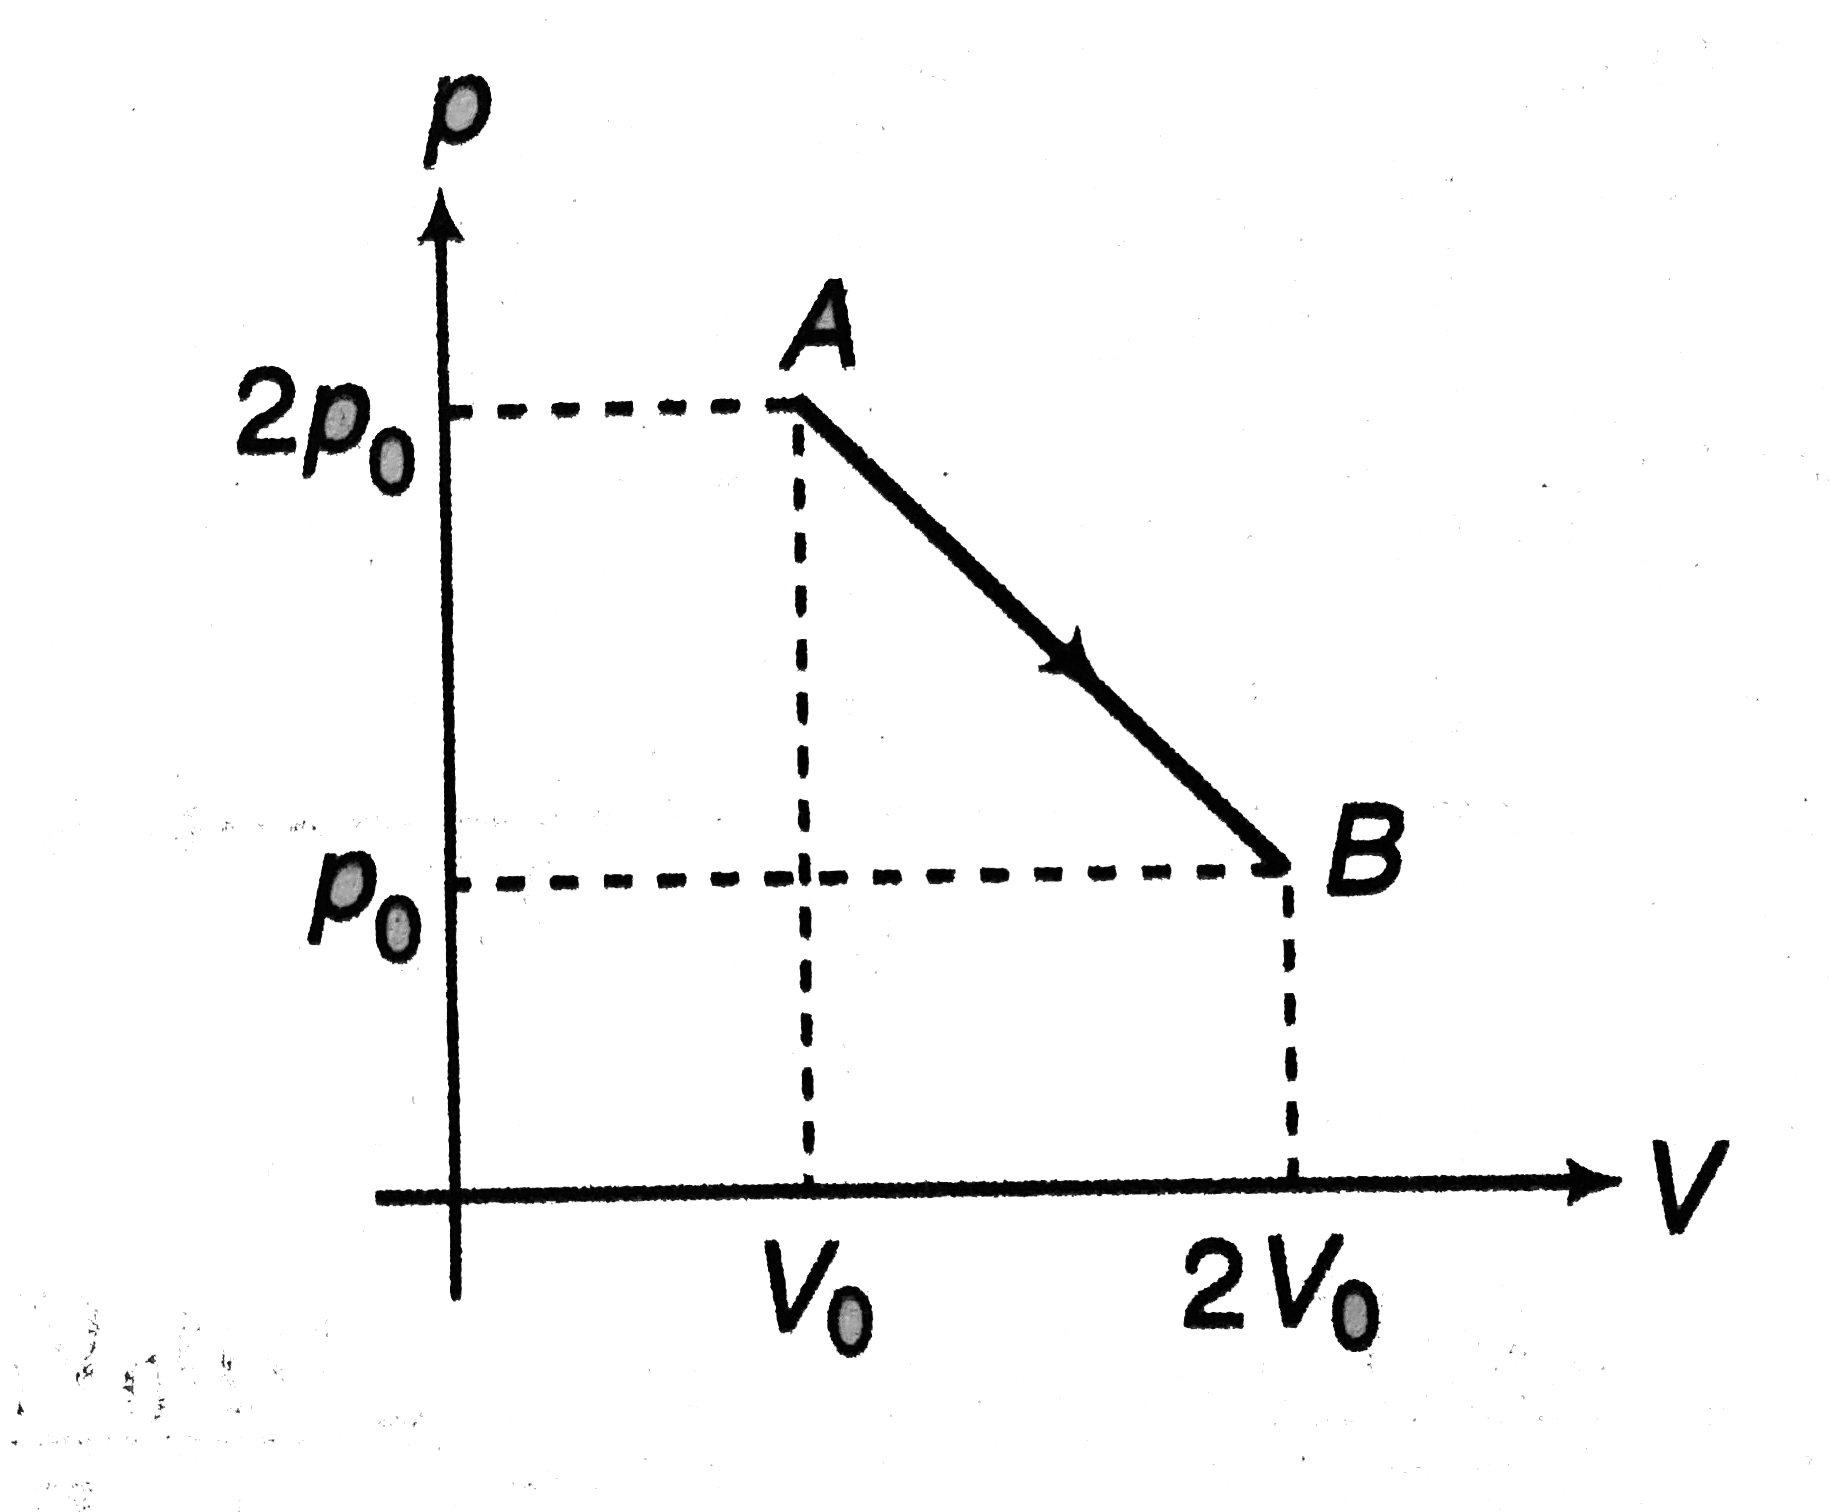
(p - V) diagram of (n) moles of an ideal gas is as shown in figure. Find the maximum temperature between (A) and (B).
 .
.
How to proceed For given number of moles of a gas,
T∝pV(pV=nRT)
Although (pV)A=(pV)B=2p0V0orTA=TB, yet it is not an isothermal process. Because in isothermal process (p- V) graph is a rectangular hyperbola while it is a straight line. So, to see the behaviour of temperature, First we will find either (T - V) equation or (T _ p) equation and from that equation we can judge how the temperature baries. From the graph, first we will write )p V) equation, then we will convert it either in (T - V) equation or in (T - p) quation with the help of equation, (pV = nRT).
The correct Answer is:A, D
From the graph the (p - V) equation can be written as
p=−(p0V0)V+3P0 (y=−mx+c)
or pV=−(p0V0)V2+3p0V
or nRT=3p0V−(p0V0)V2 ( as pV =nRT)
or T=1nR[3p0V−(p0V0)V2]
This is the required (T - V) equation. This is quadratic in (V). Hence, (T - V) graph is a parabola. now, to find maximum or minimum value of (T), we can substitute.
dTdV=0
or 3p0−(2p0V0)V=0orV=32V0
Further d2TdV2 is negative at V=32v0.
Hence, (t) is maximum at v=32v0 and this maximum value is
Tmax=1nR[(3p0)(3V02)−(p0V0)(3V02)2]
or Tmax=9p0V04nR
Thus, (T - V) graph is as shown in figure.(##DCP_V03_C20_S01_031_S01##).
TA=TB=2p0V0nRandTmax=9p0V04nR
= 2.25p0V0nR.
Topper's Solved these Questions
- BOOK - DC PANDEYCHAPTER - THERMOMETRY,THERMAL EXPANSION & KINETIC THEORY OF GASESEXERCISE - Exercise 20.15videos
THERMOMETRY,THERMAL EXPANSION & KINETIC THEORY OF GASES
- BOOK - DC PANDEYCHAPTER - THERMOMETRY,THERMAL EXPANSION & KINETIC THEORY OF GASESEXERCISE - Exercise 20.27videos
THERMOMETRY,THERMAL EXPANSION & KINETIC THEORY OF GASES
- BOOK - DC PANDEYCHAPTER - THERMOMETRY,THERMAL EXPANSION & KINETIC THEORY OF GASESEXERCISE - Example Type 32videos
THERMOMETRY,THERMAL EXPANSION & KINETIC THEORY OF GASES
- BOOK - DC PANDEYCHAPTER - THERMOMETRY THERMAL EXPANSION AND KINETIC THEORY OF GASESEXERCISE - Medical entrance gallary30videos
THERMOMETRY THERMAL EXPANSION AND KINETIC THEORY OF GASES
- BOOK - DC PANDEYCHAPTER - UNIT AND DIMENSIONSEXERCISE - Assertion And Reason2videos
UNIT AND DIMENSIONS
Similar Questions
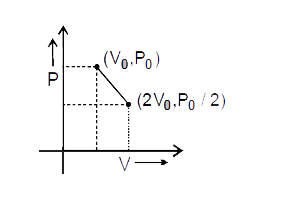
One mole of a gas expands obeying the relation as shown in the P/V diagram. The maximum temperature in this process is equal to
 View Solution
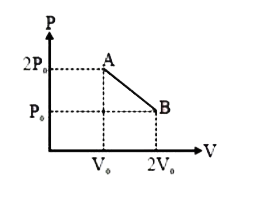
n' moles of an ideal gas undergoes a process A→B as shown in the figure. The maximum temperature of the gas during the process will is p0v04nR then value of N is:
 View Solution
Knowledge Check
- Question 1 - Select One
The P-V diagram for an ideal gas is shown in figure.
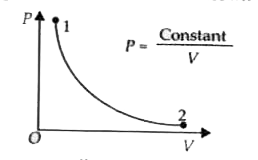
Out of the following diagrams which one represents the T-P diagram ?A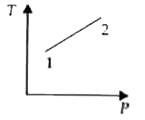 B
B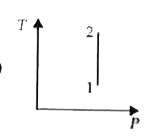 C
C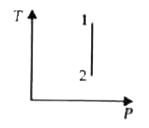 D
D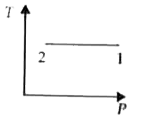
- Question 2 - Select One
Consider p-V diagram for an ideal gas shown in figure.
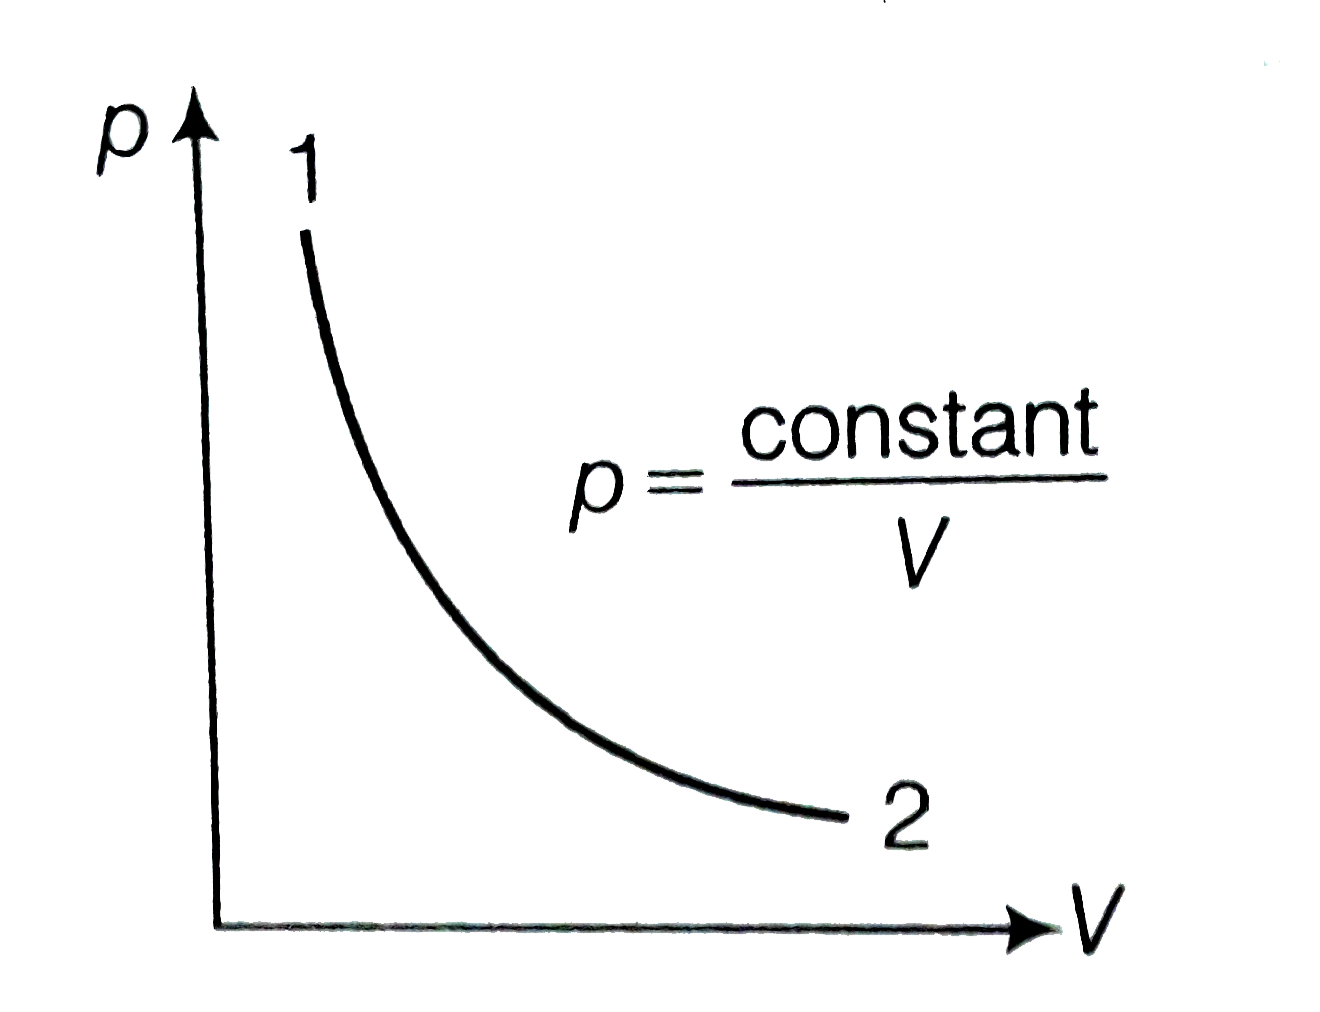
Out of the following diagrams, which figure represents the T−p diagram ?
(i)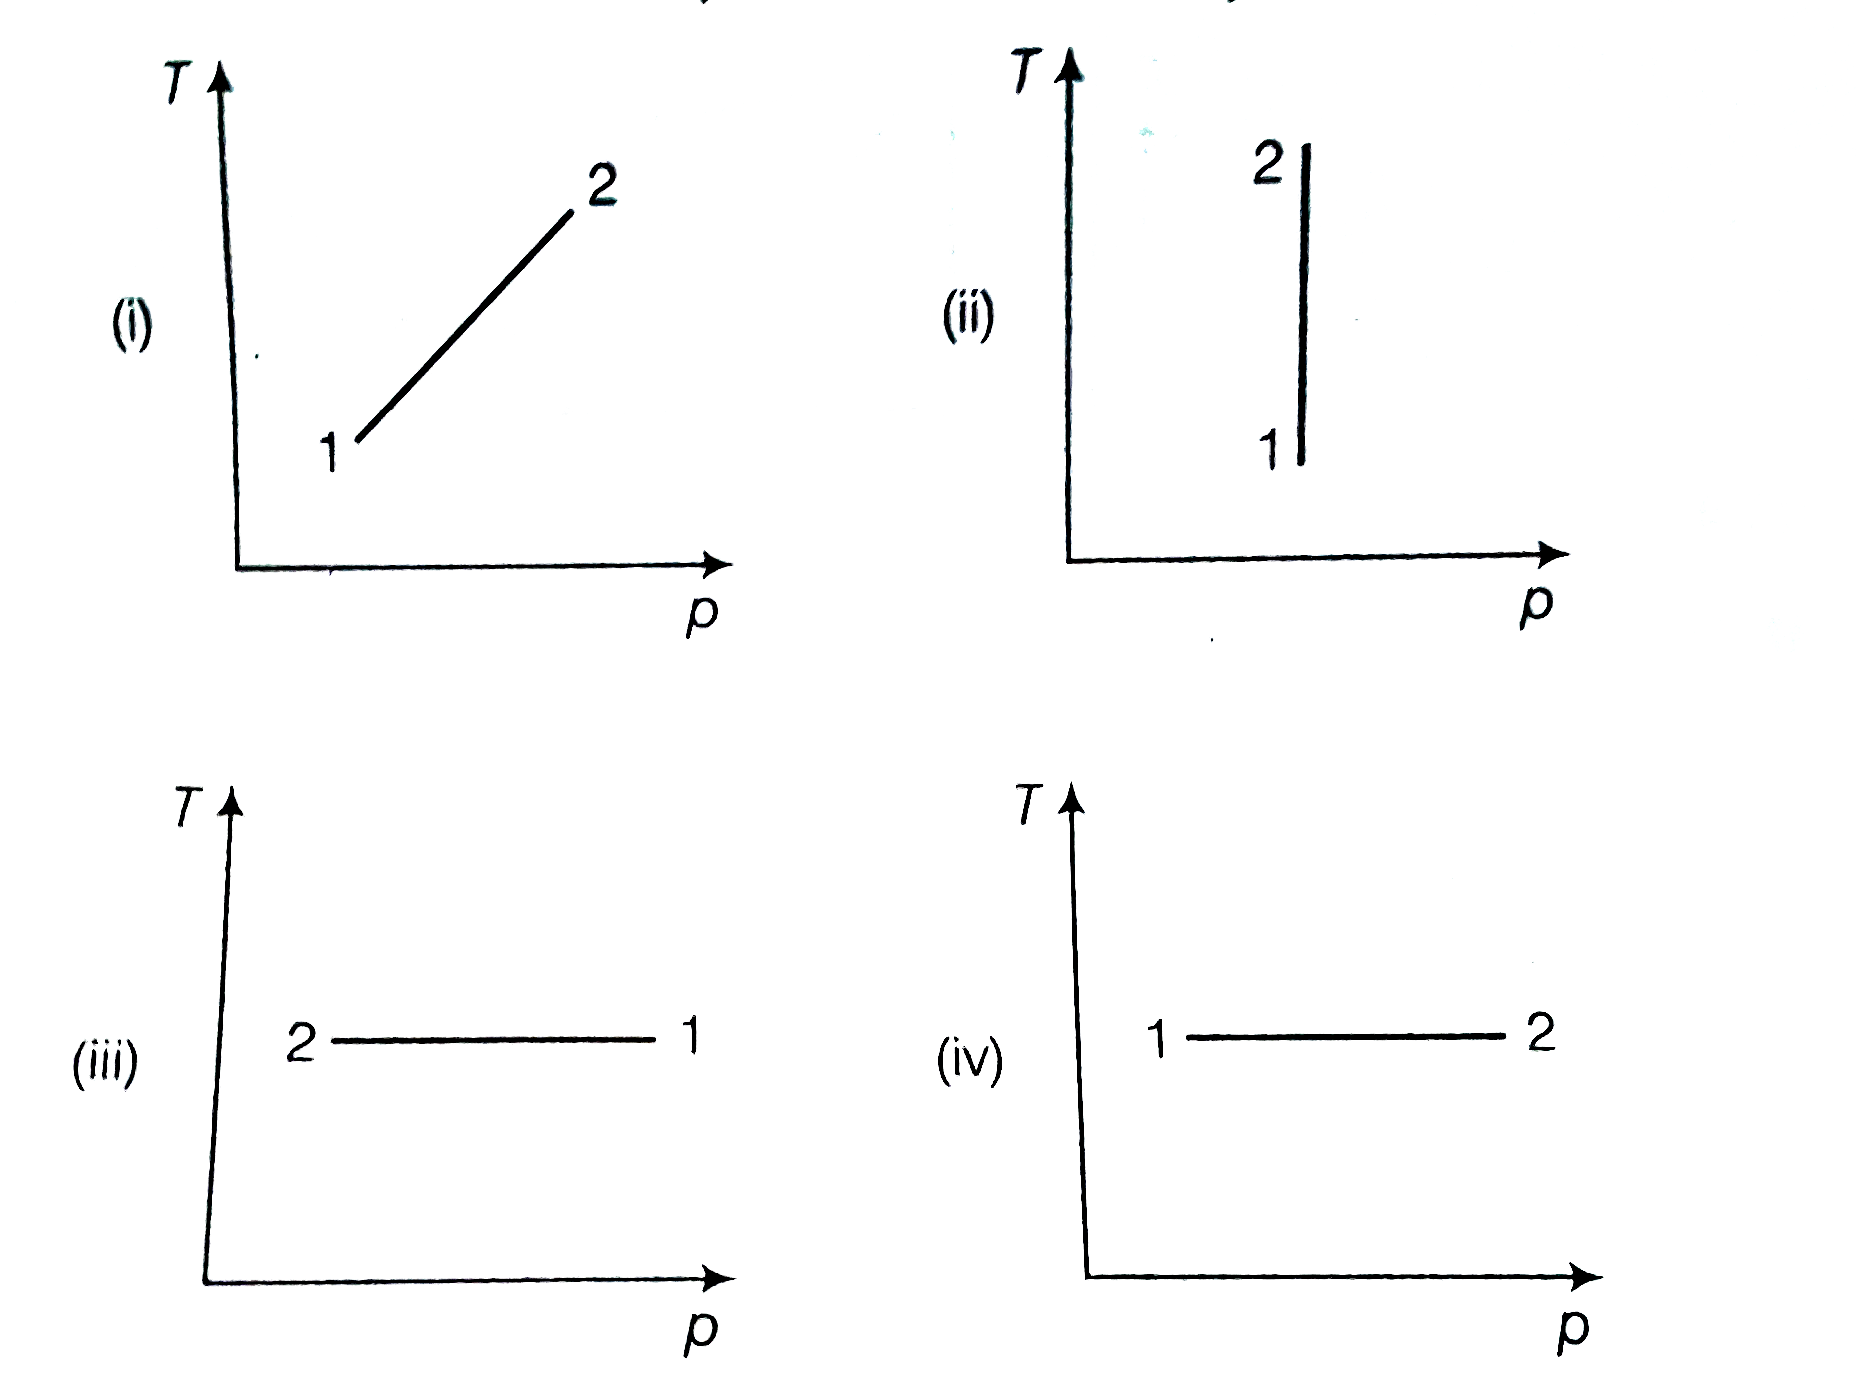 A(iv)B(ii)C(iii)D(i)
 - Question 3 - Select One
Consider P−V diagram for an ideal gas shown in figure.
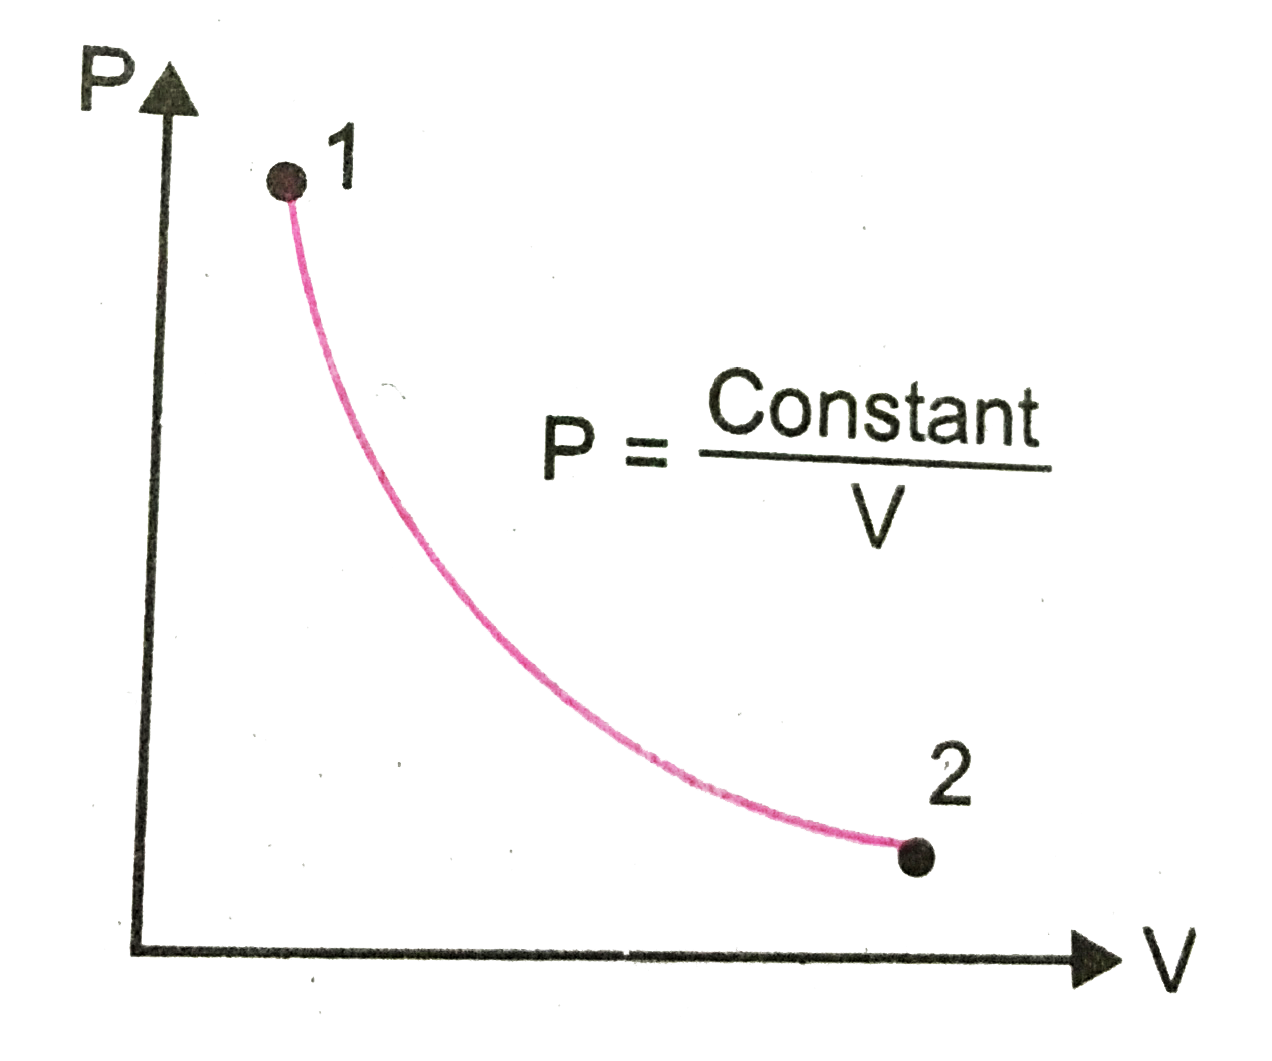
Out of following diagrams(figure). Which represents the T−P diagram?
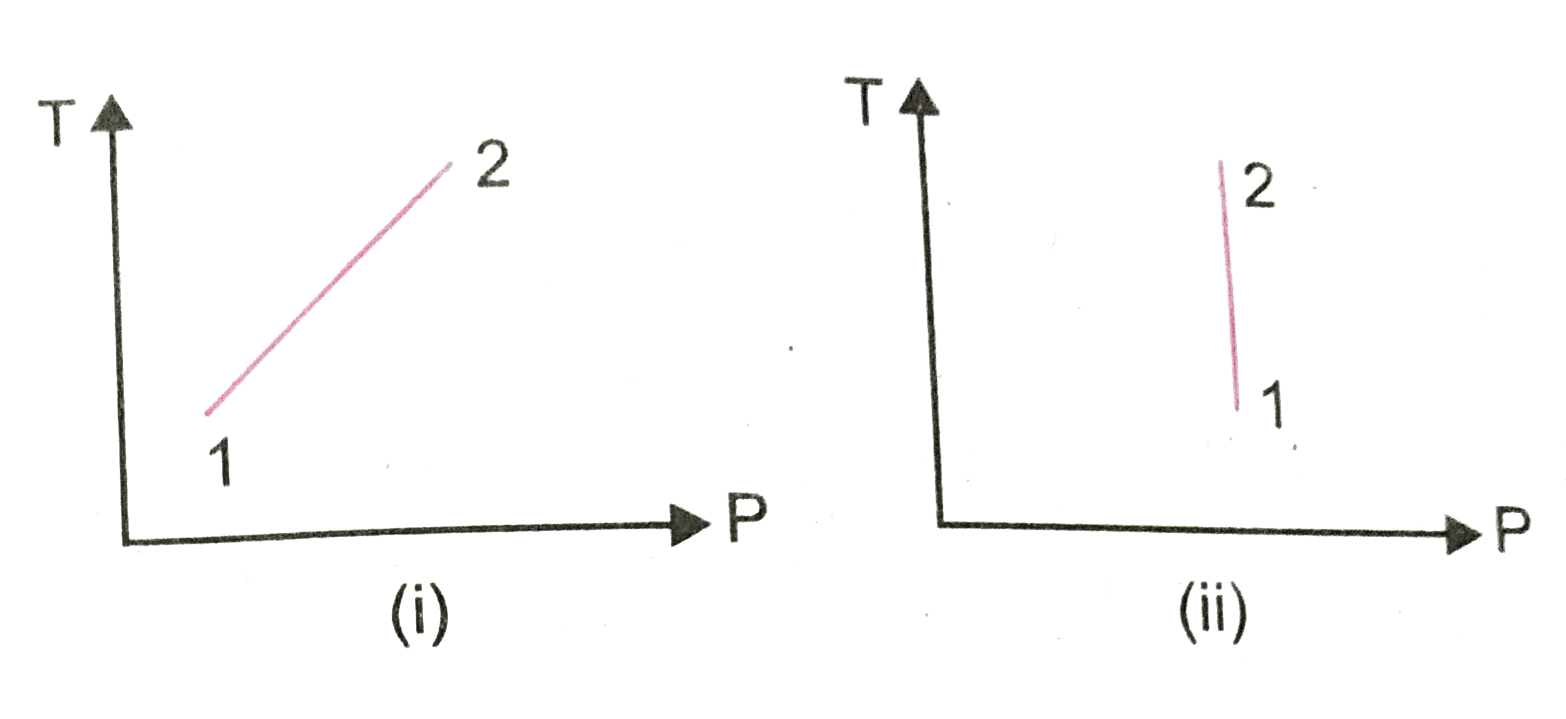
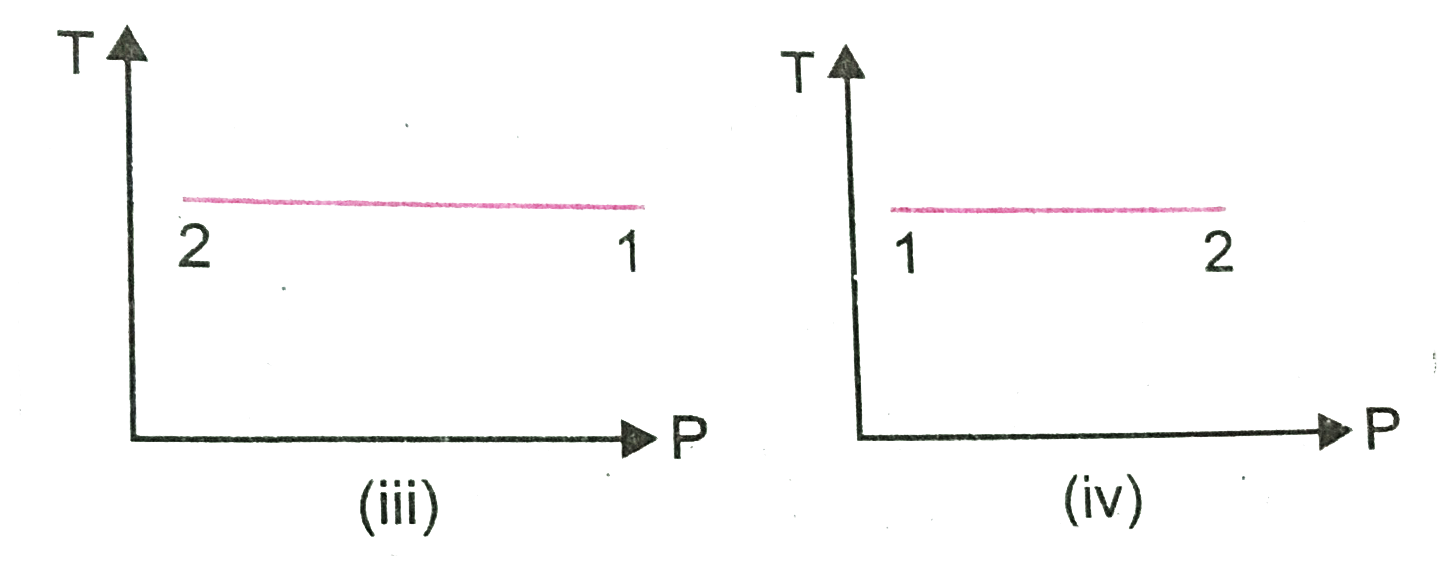 A(iv)B(ii)C(iii)D(iv)
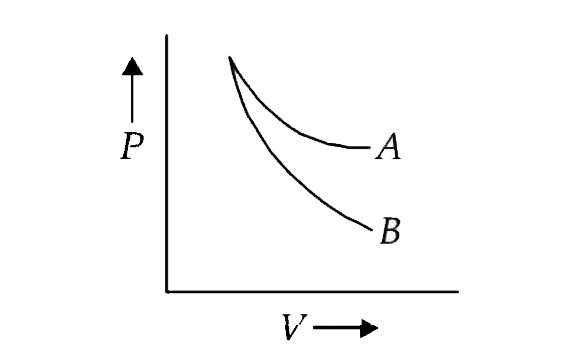
The curves A and B in the figure shown P-V graphs for an isothermal and an adiabatic process for an idea gas. The isothermal process is represented by the curve A.
 View Solution
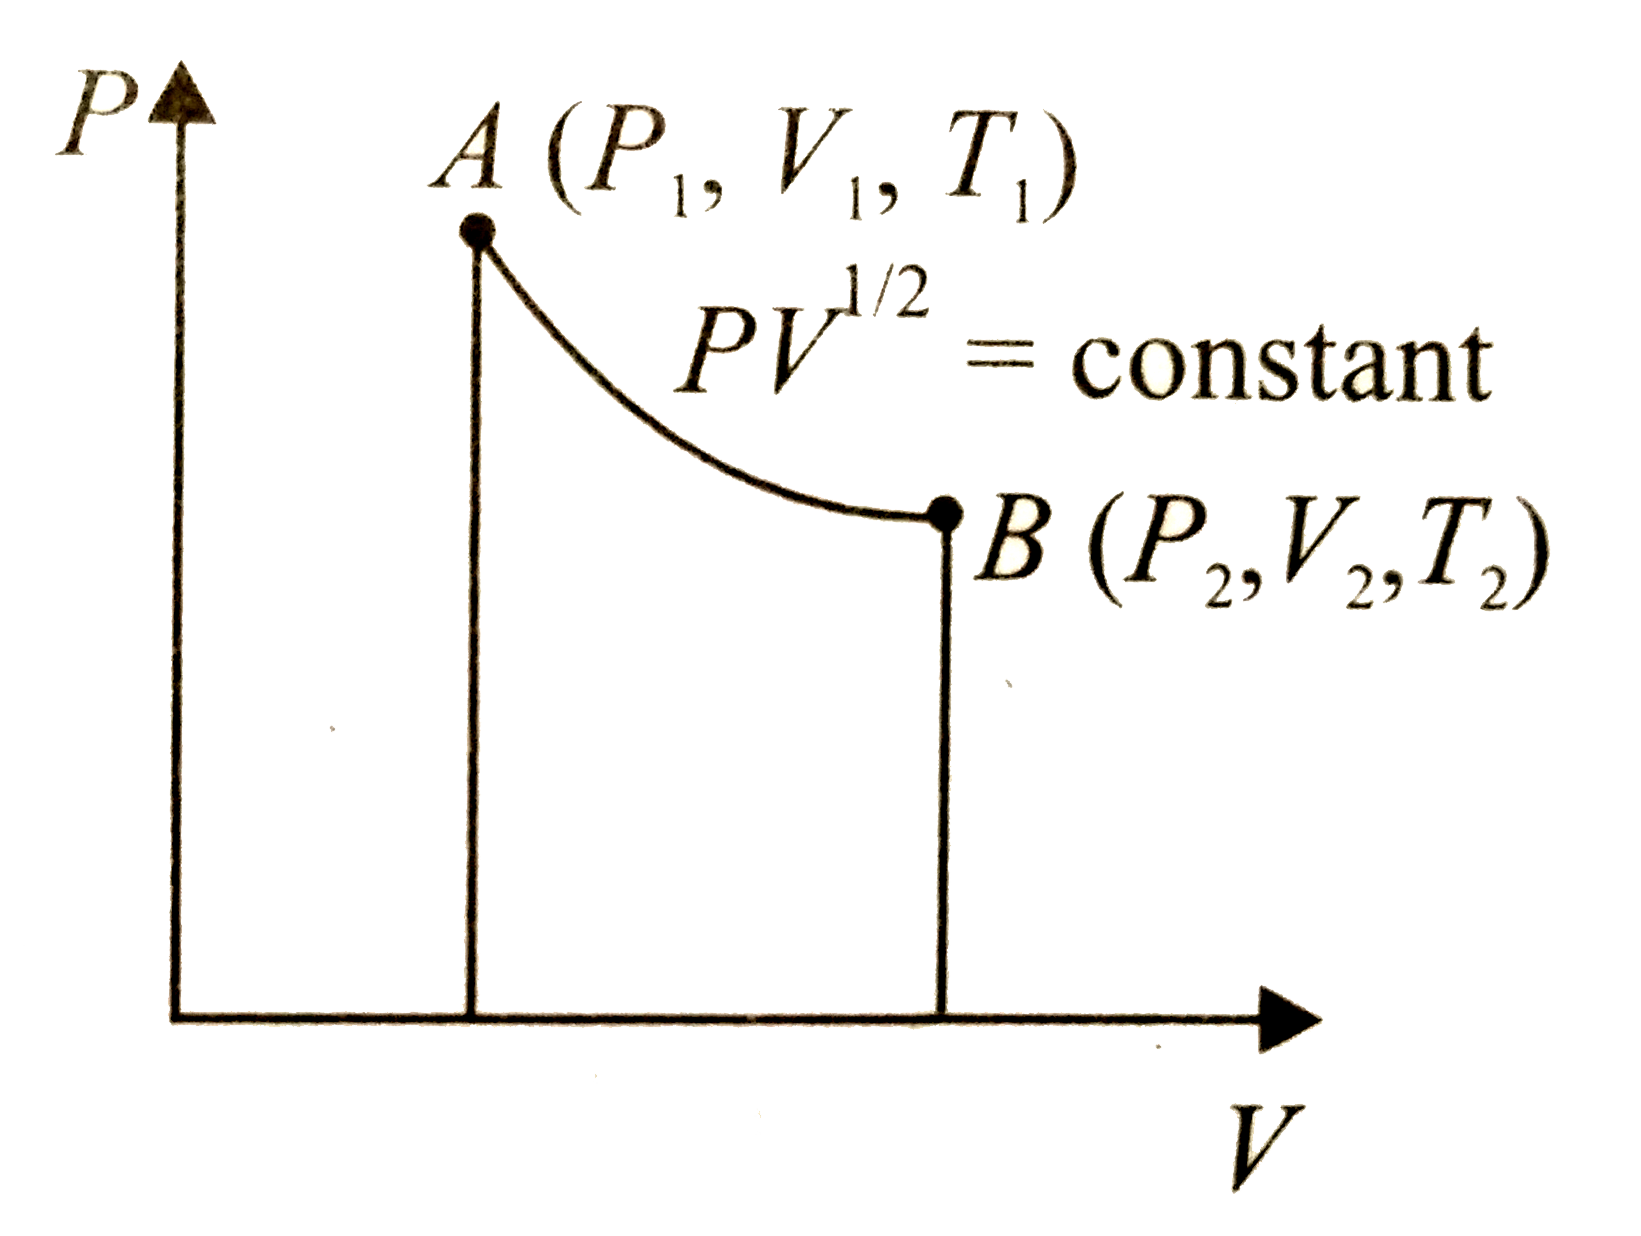
1 mole of an ideal gas in a cylindrical container have the P-V diagram as shown in figure.If V2=4V1 then the ratio of temperatures T1T2 will be
 View Solution
Straight line on (p - T) graph for an ideal gas represents isochoric process.
If p∝T,V=constant.View SolutionOne mole of an ideal gas undergoes a process
P=P0−αV2
where α and P0 are positive constant and V is the volume of one mole of gas
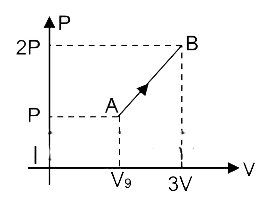
Q. The maximum attainable temperature isView SolutionOne mole of a monoatomic ideal gas undergoes process AB in given P – V diagram then average specific heat for this process is:
 View Solution

