Draw the graph showing variation of the value of the induced emf as a function of rate of change of current flowing through an ideal inductor.
To solve the problem of drawing the graph showing the variation of the induced EMF (electromotive force) as a function of the rate of change of current flowing through an ideal inductor, we can follow these steps:
1. Understand the Relationship:
The induced EMF (E) in an inductor is given by the formula:
E=−Ldidt
where L is the inductance of the inductor and didt is the rate of change of current.
2. Identify Variables:
- Let y=E (induced EMF)
- Let x=didt (rate of change of current)
3. Rearrange the Equation:
From the equation E=−Ldidt, we can express it as:
y=−Lx
This is a linear equation in the form y=mx+b where m=−L and b=0.
4. Determine the Slope:
The slope of the line is negative, indicating that as the rate of change of current (x) increases, the induced EMF (y) decreases.
5. Draw the Graph:
- On the x-axis, represent the rate of change of current (didt).
- On the y-axis, represent the induced EMF (E).
- Since the relationship is linear with a negative slope, draw a straight line starting from the origin (0,0) and sloping downwards to the right.
6. Label the Axes:
- Label the x-axis as didt (rate of change of current).
- Label the y-axis as E (induced EMF).
7. Indicate the Direction:
The graph should indicate that as x (rate of change of current) increases, y (induced EMF) decreases, confirming the negative relationship.
Final Graph:
The graph will be a straight line passing through the origin with a negative slope, indicating that the induced EMF decreases as the rate of change of current increases.
---
The induced EMF (E) in an inductor is given by the formula:
E=−Ldidt
where L is the inductance of the inductor and didt is the rate of change of current.
- Let y=E (induced EMF)
- Let x=didt (rate of change of current)
From the equation E=−Ldidt, we can express it as:
y=−Lx
This is a linear equation in the form y=mx+b where m=−L and b=0.
The slope of the line is negative, indicating that as the rate of change of current (x) increases, the induced EMF (y) decreases.
- On the x-axis, represent the rate of change of current (didt).
- On the y-axis, represent the induced EMF (E).
- Since the relationship is linear with a negative slope, draw a straight line starting from the origin (0,0) and sloping downwards to the right.
- Label the x-axis as didt (rate of change of current).
- Label the y-axis as E (induced EMF).
The graph should indicate that as x (rate of change of current) increases, y (induced EMF) decreases, confirming the negative relationship.
The graph will be a straight line passing through the origin with a negative slope, indicating that the induced EMF decreases as the rate of change of current increases.
Similar Questions
Knowledge Check
Mutual induction is the produced of induced emf in a coil due to the change of current in the
Asame coilBneighbouring coilCboth a and bDneigher a nor bThe graph showing the variation of decay rate with number of nuclei is:
A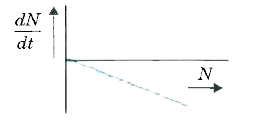 B
B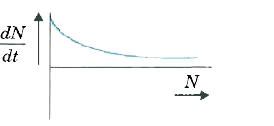 C
C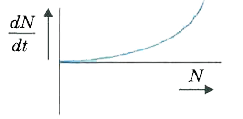 D
D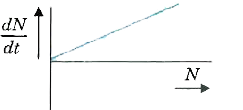
Consider the junction diode as ideal. The value of current flowing through AB is
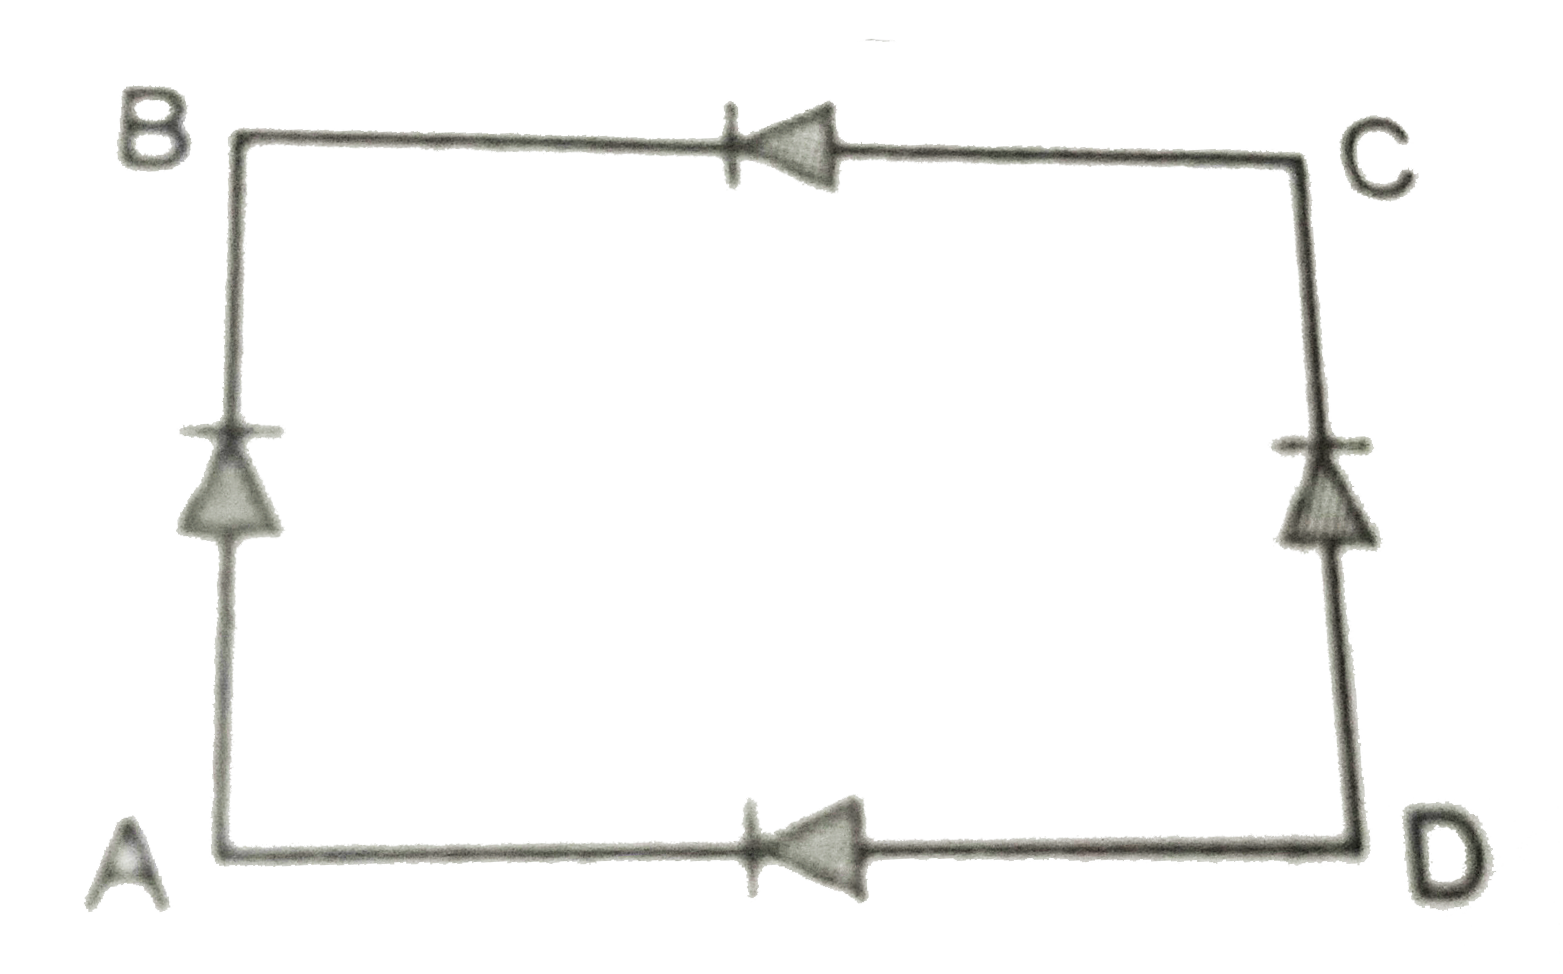 AOAB10−2AC10−1AD10−3A
Draw a graph showing the variation of decay rate with number of active nuclei.
View SolutionThe current through two inductors of self inductance 12 mH and 30 mH is increasing with time at the same rate. Draw graphs showing the variation of the (a ) e.m.f. induced with the rate of change of current in each inductor. (b) enargy stored in each inductor with the current flowing through it.
Compare the energy stored in the coils if power dissipated in the coil is same.
View Solution(a) The current through two inductors, of self-inductance 12 mH and 30 mH respectively, is increasing with time at the same rate. Draw graphs showing the variation of the
(i) emf induced with the rate of change of current in each inductance,
(ii) energy stored in each inductor with the current flowing through it.
(b) Compare the energy stored in the coils if the power dissipated in the coils is the same.
View SolutionConsider the junction diode as ideal. The value of current flowing through AB is:

View SolutionConsider the junction diode as ideal. The value of current flowing through AB is:

View Solution
