In P versus V graph, the gorizontal line is found in which _______ exists.
Gas
Liquid
Equilibrium between gas and liquid
Super critical temperature.
The correct Answer is:C
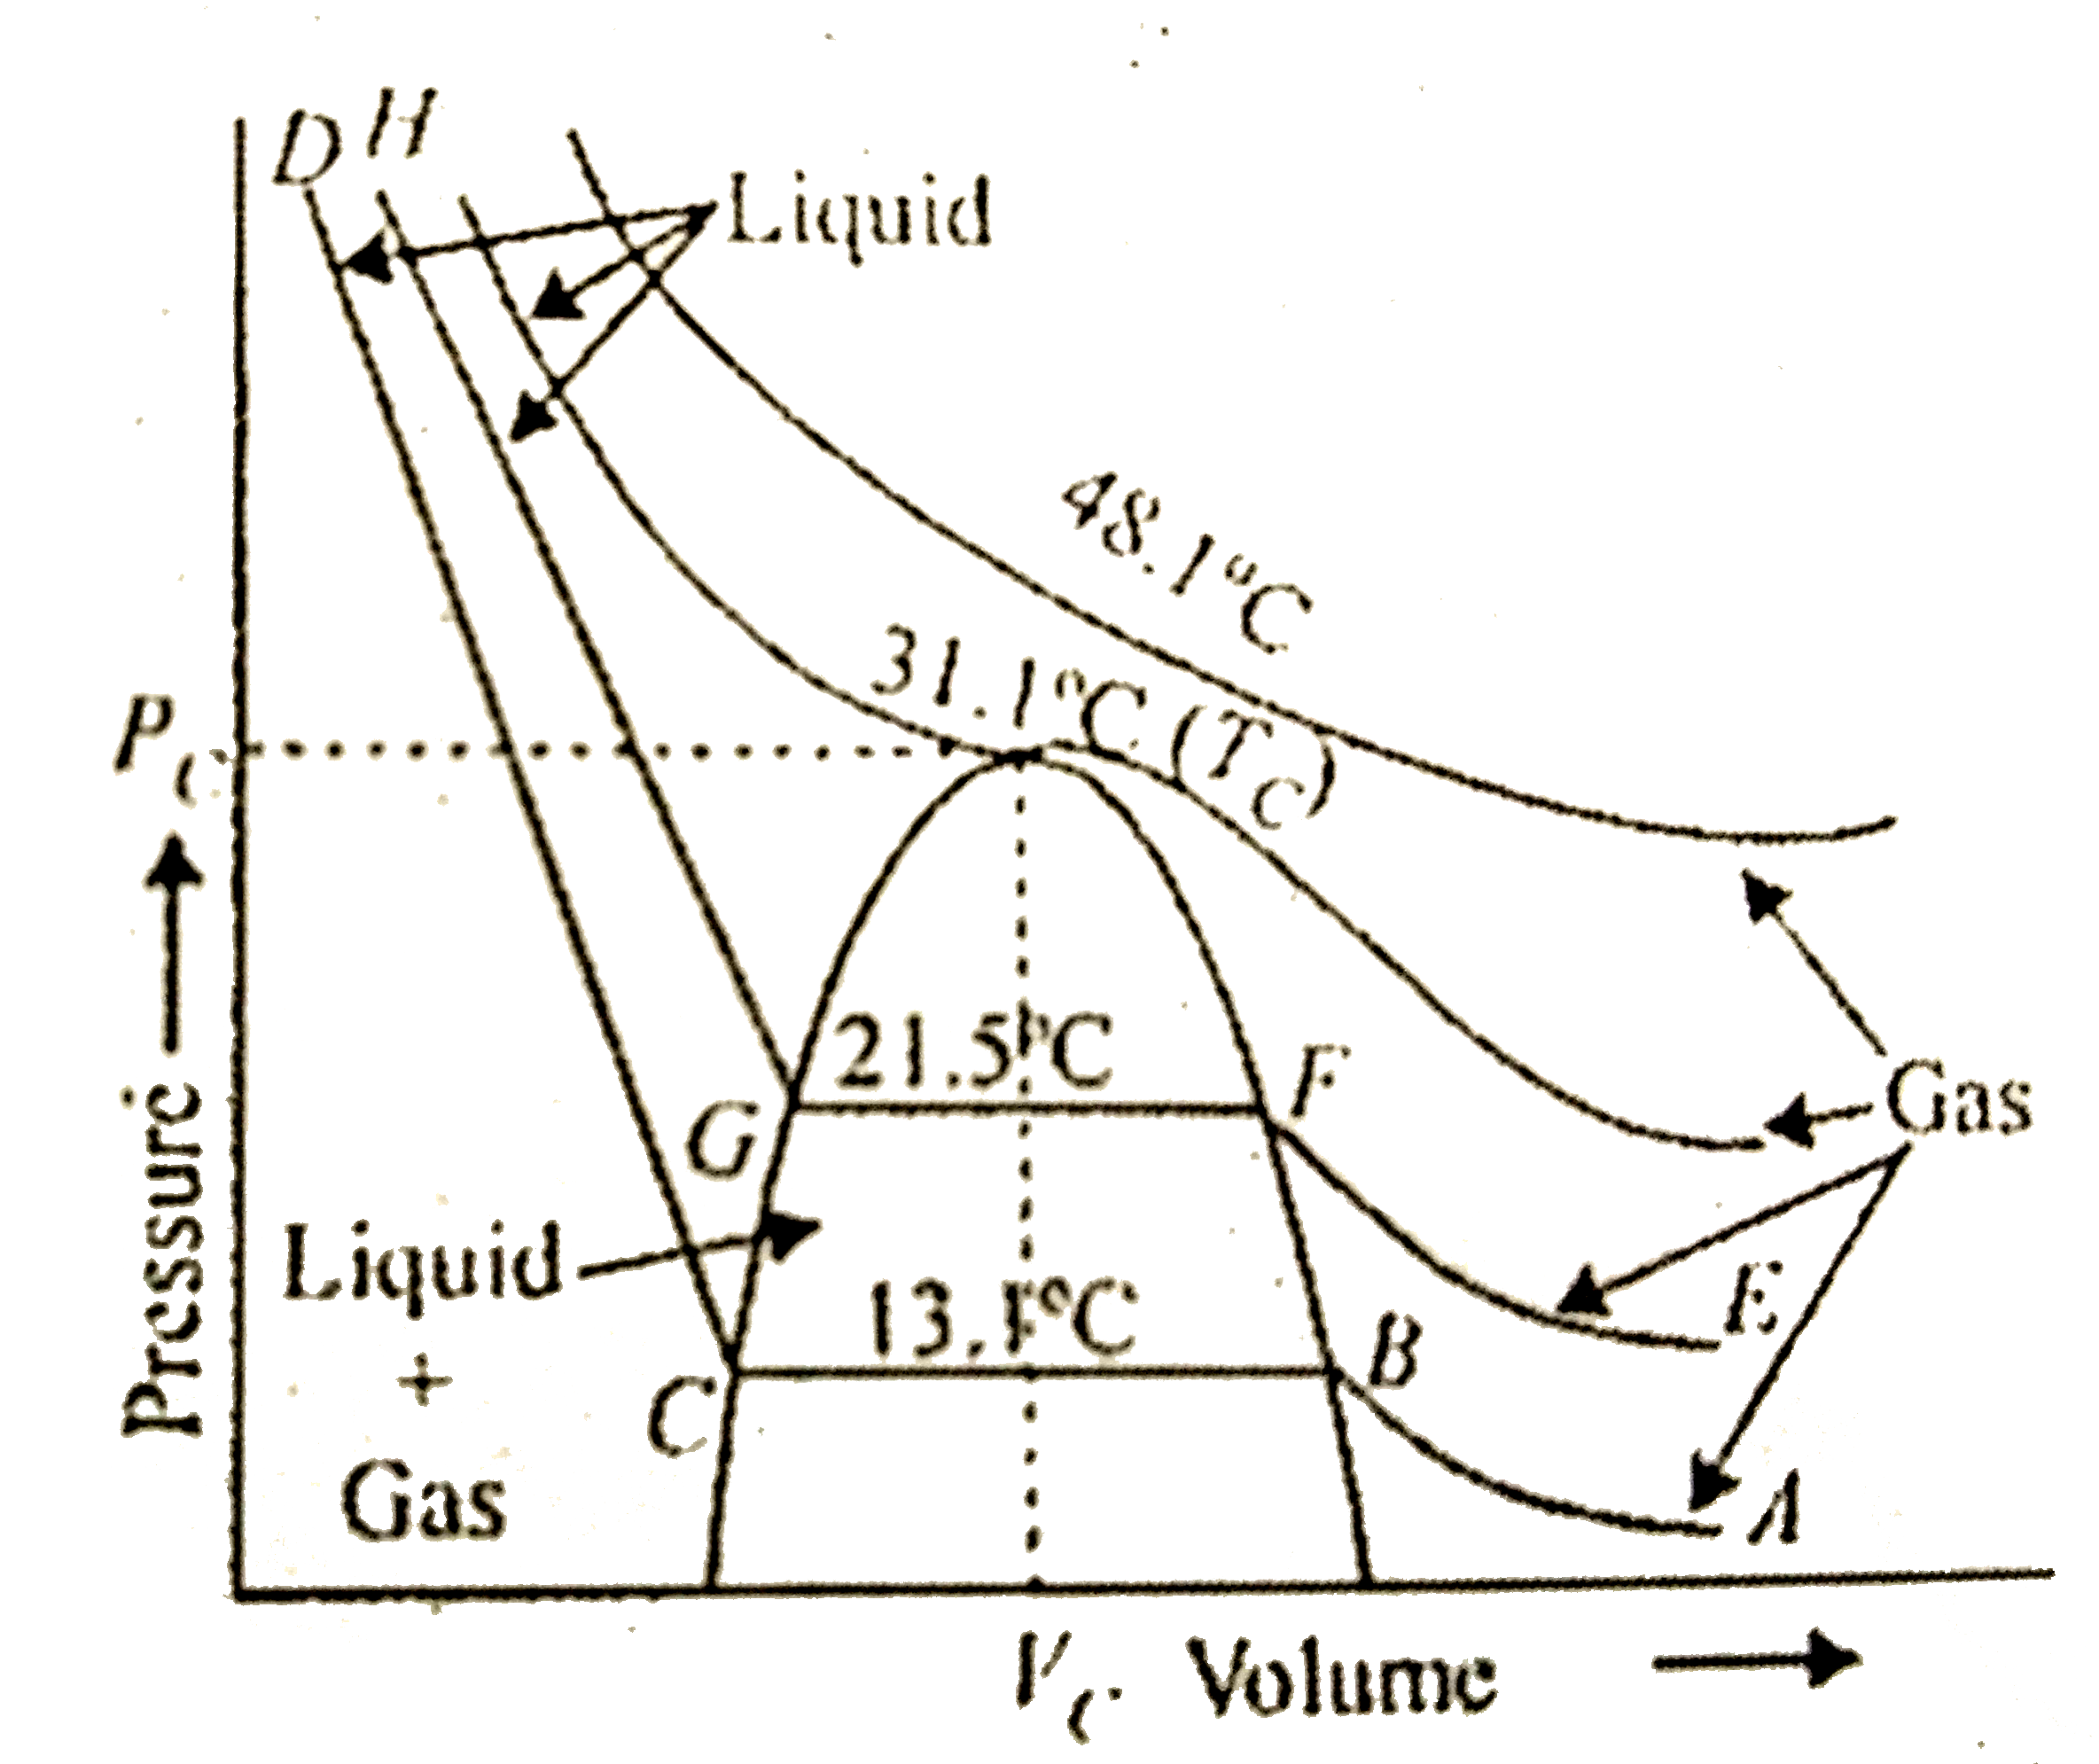
From the graph, at point A, CO2 exists as a gas, As pressure is increased, the volume of the gas decreases along the curve AB. At B liquefaction of the gas starts. Hence, volume decreases rapidly along BC because liquid has much less volume than the gas. At point C, liquefaction is complete. Amount of gas decreased = Amount of liquid formed or increased. Because along horizontal line, gas converts into liquid.
Topper's Solved these Questions
Similar Questions
Knowledge Check
v2 versus s-graph of a particle moving in a straight line is shown in the figure. From the graph some conculsions are drawn. State which statement is wrong ?
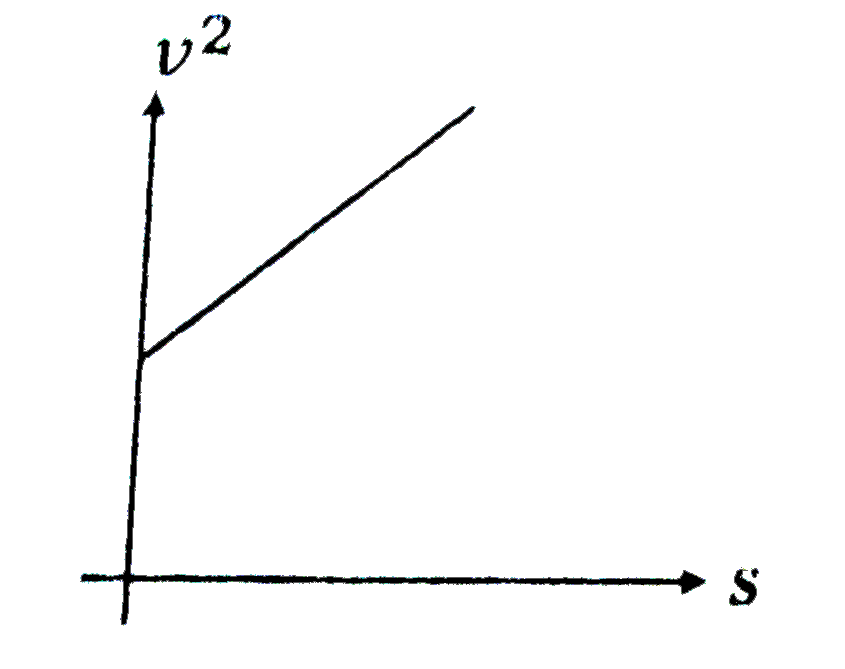 AThe given graph shown a uniformly accelerated motionBInitial velocity of particle is zeroCCorresponding s-t graph will be a parabolaDNone of the above
The acceleration versus time graph of a particle moving in a straight line is show in figure. The velocity-time graph of the particle would be
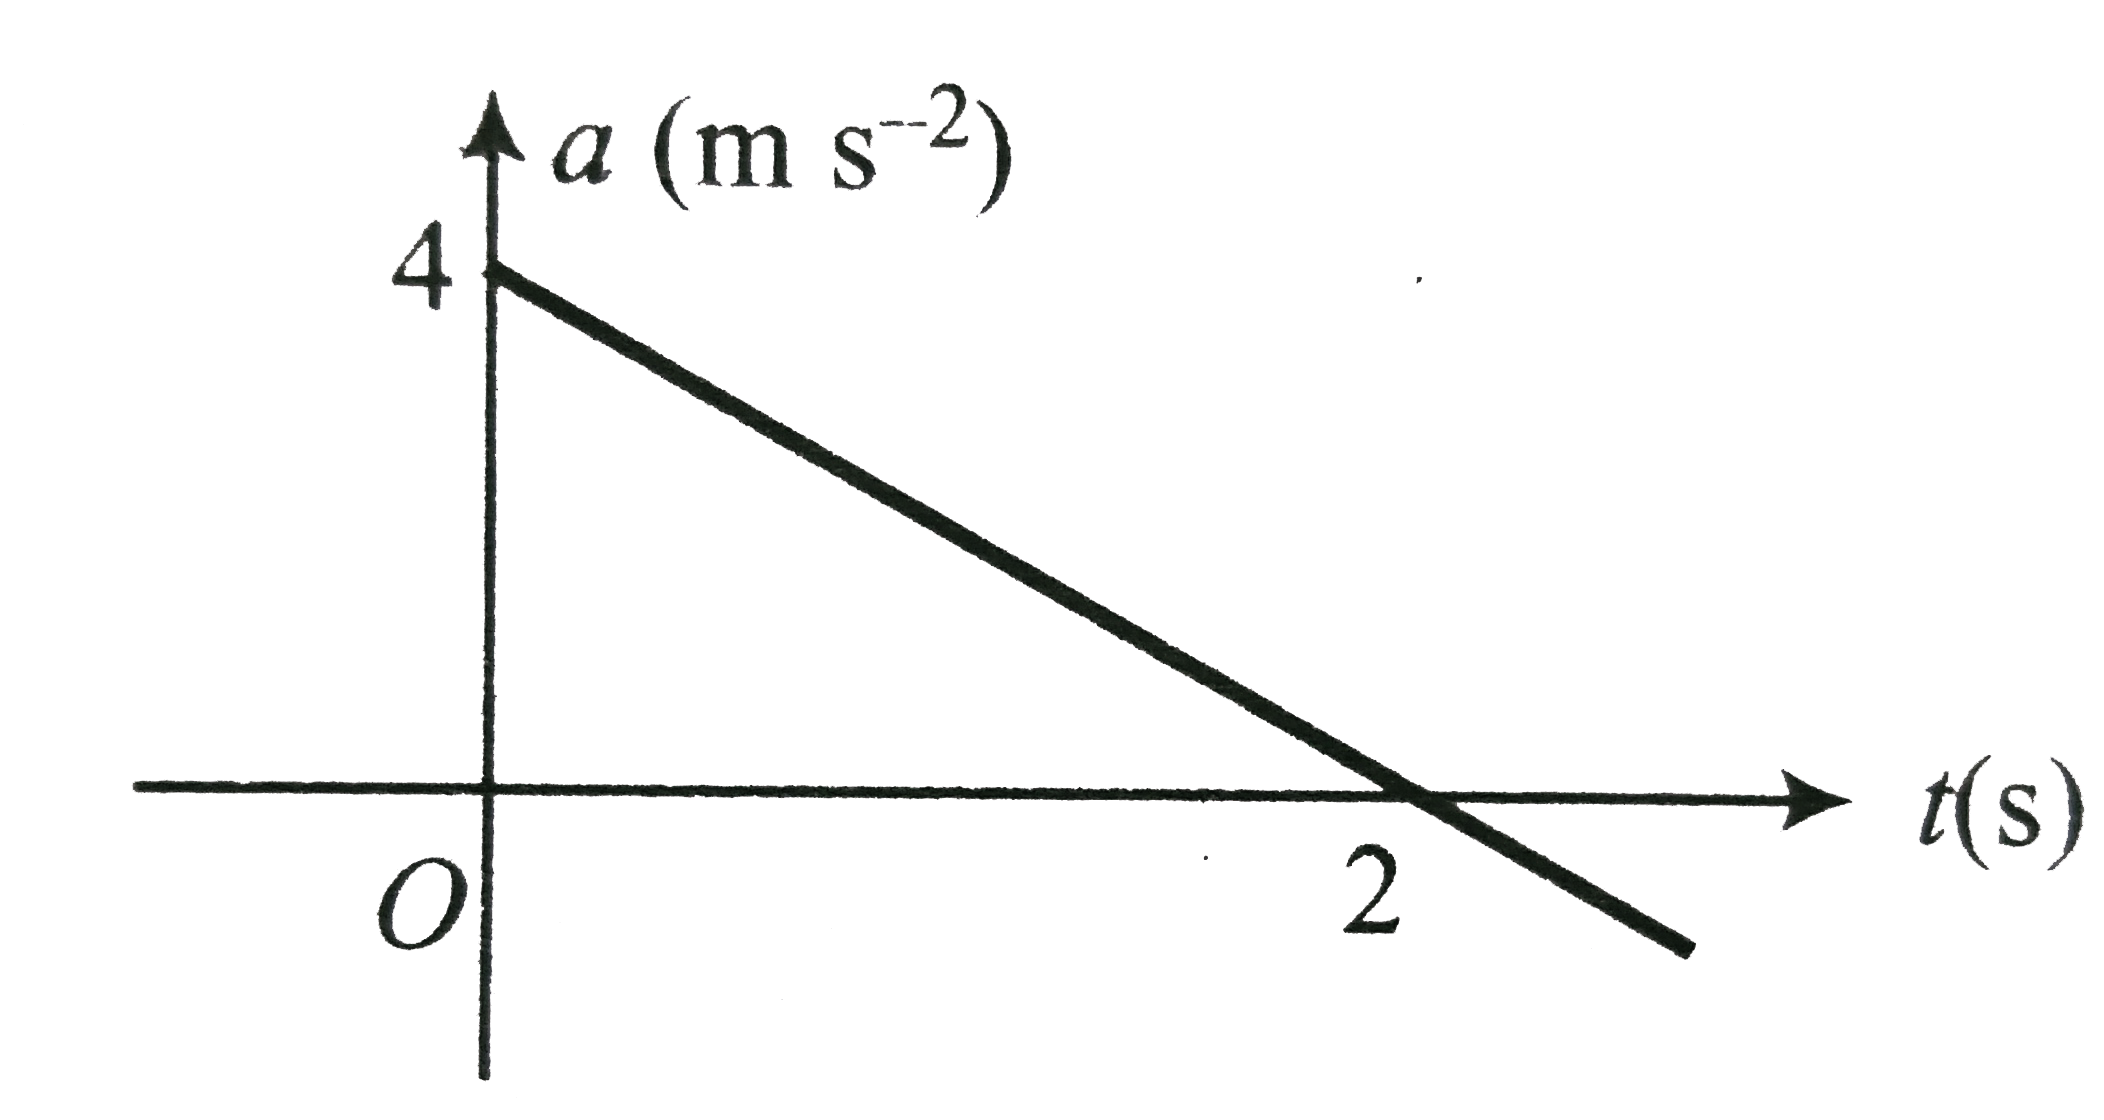 .AA straight lineBA parabolaCA circleDAn ellipse
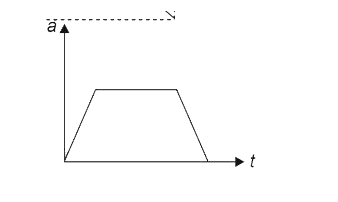
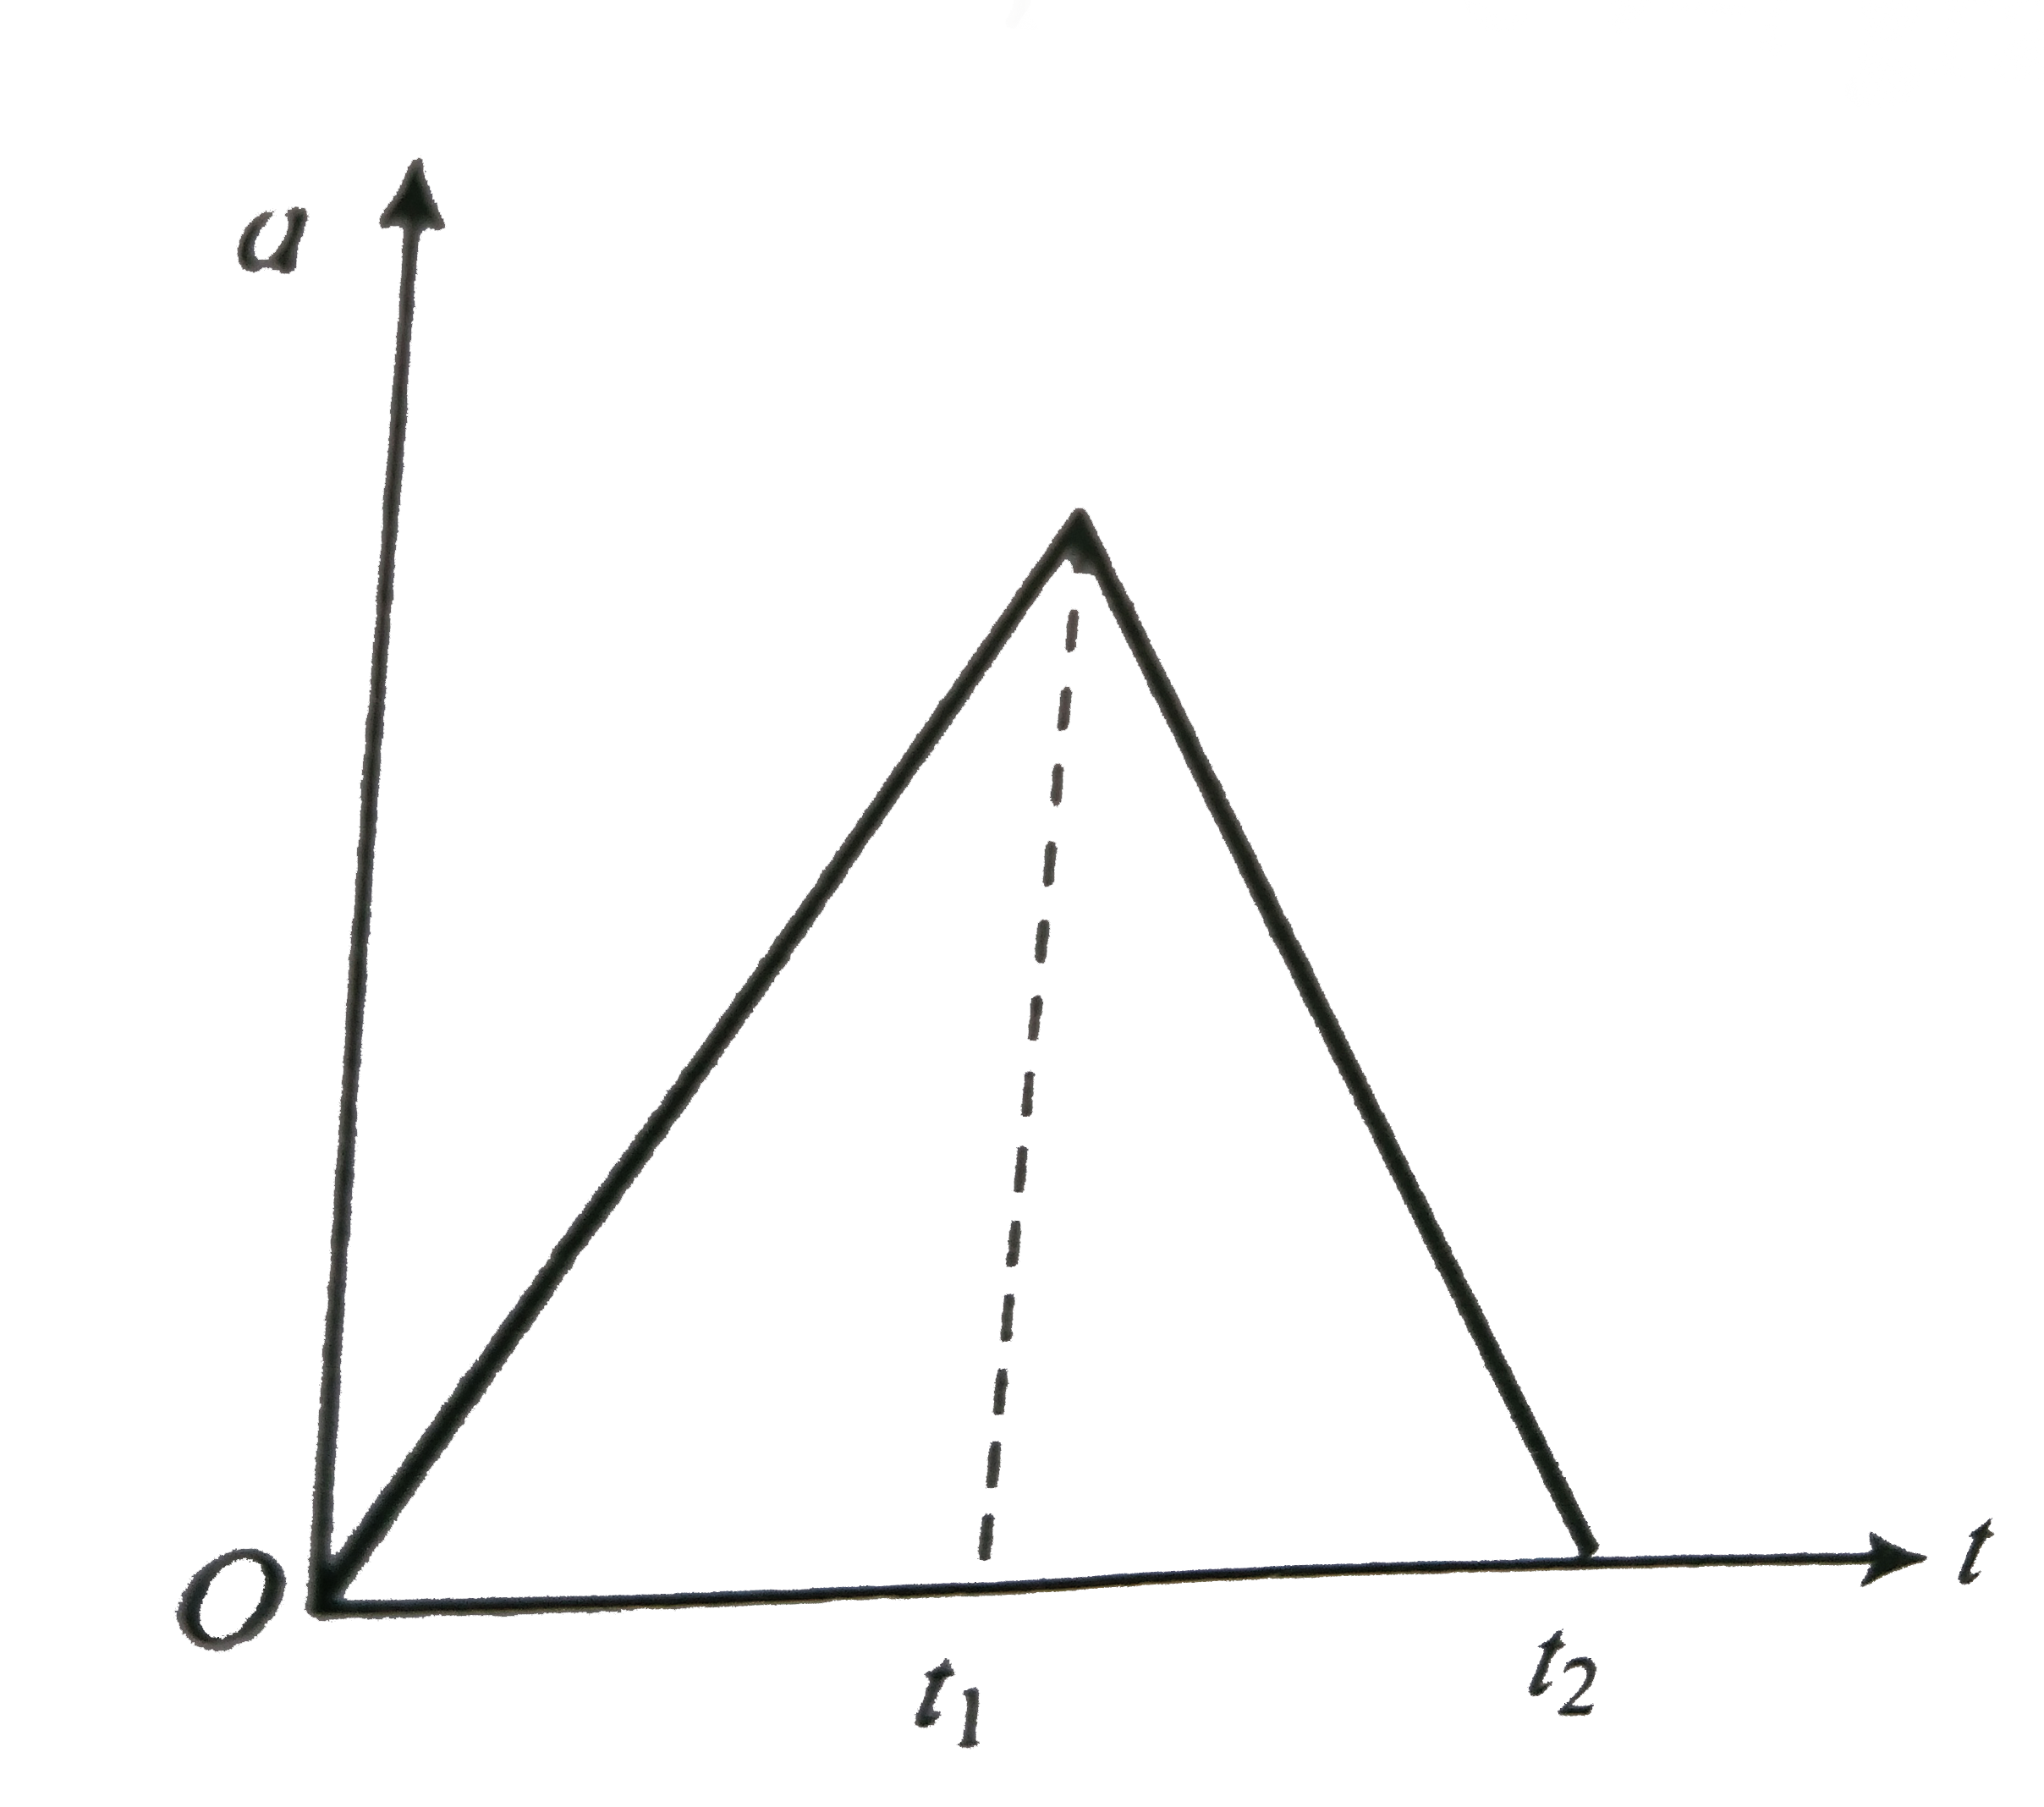
Acceleration versus time graph of a particle moving in a straight line is as shown in adjoining figure. If initially particle was at rest. Then corresponding kinetic energy versus time graph will be :
 A
A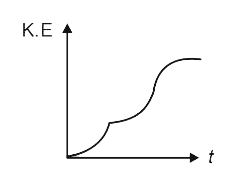 B
B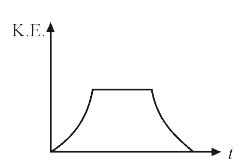 C
C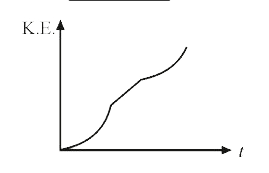 D
D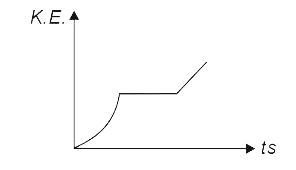
The acceleration versus time graph of a particle moving in a straight line is show in. The velocity-time graph of the particle would be
 .
.
View SolutionThe acceleration versus time graph of a particle moving along a straight line is shown in the figure. Draw the respective velocity-time graph Given v=0 at t=0.
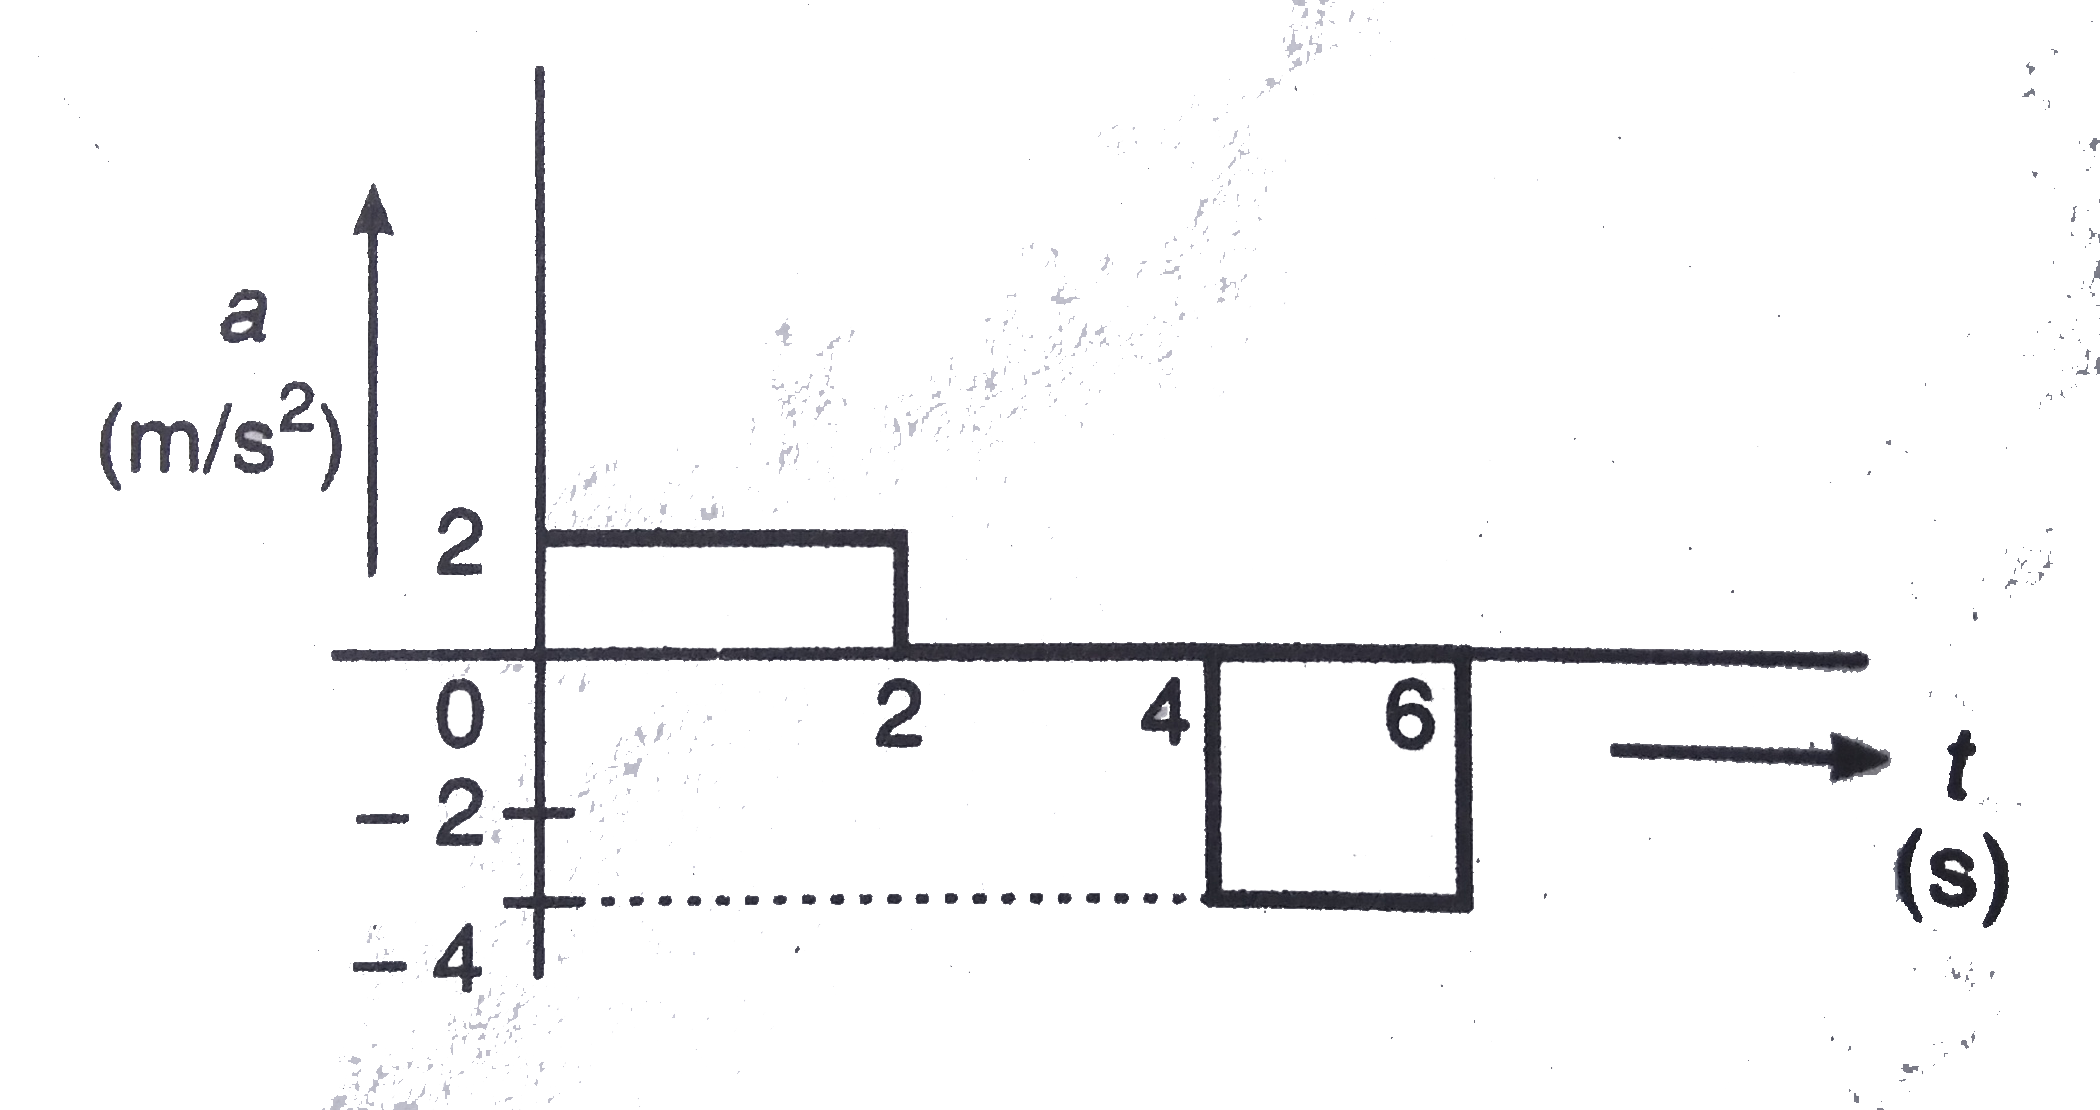
View SolutionThe acceleration versus time graph of a particle moving along a straight line is shown in the figure. Draw the respective velocity-time graph Given v=0 at t=0.

View SolutionAcceleration versus time graph of a particle moving in a straight line is as shown in adjoining figure. If initially particle was at rest. Then corresponding kinetic energy versus time graph will be :

View SolutionThe acceleration versus time graph of a particle is shown in the figure. The respective v−t graph of the particle is .
 .
.
View Solution
