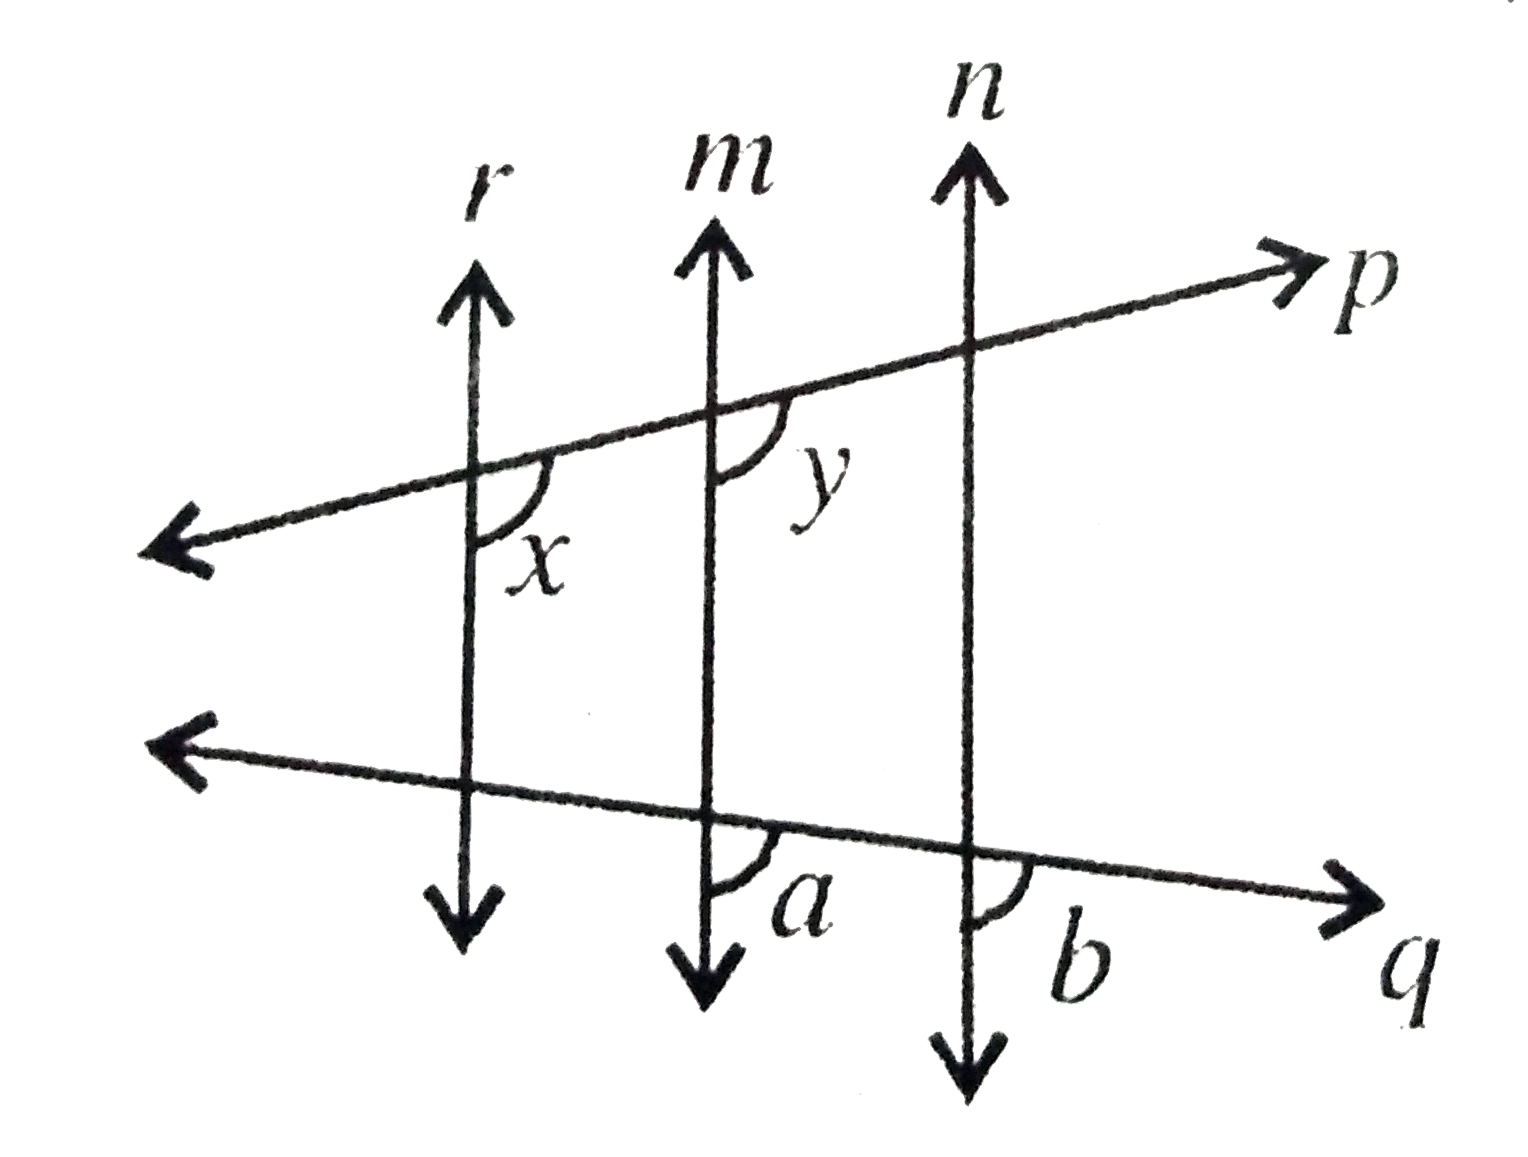
नीचे के चित्र में यदि x=y और a=b तो साबित करें कि r∣∣n

Step by step video & image solution for नीचे के चित्र में यदि x=y और a=b तो साबित करें कि r||n by Maths experts to help you in doubts & scoring excellent marks in Class 9 exams.
Updated on:21/07/2023Topper's Solved these Questions
- रेखाएं और कोणBOOK - KC SINHACHAPTER - रेखाएं और कोणEXERCISE - दीर्घ उत्तरीय प्रश्न
19 Videos
- रेखाएं और कोणBOOK - KC SINHACHAPTER - रेखाएं और कोणEXERCISE - अतिलघु उत्तरीय प्रश्न (त्रिभुज और उसके कोण पर प्रमेयों तथा उपप्रमेयों के सीधे प्रयोग पर आधारित प्रश्नः)
34 Videos
- रेखाएं और कोणBOOK - KC SINHACHAPTER - रेखाएं और कोणEXERCISE - लघु उत्तरीय प्रश्न (समांतर रेखाओं पर तथा पूर्व पठित अभिगृहीतों एवं प्रमेयों के सीधे प्रयोग पर आधारित प्रश्नः)
5 Videos
- यूक्लिड की ज्यामितीय का परिचय BOOK - KC SINHACHAPTER - यूक्लिड की ज्यामितीय का परिचय EXERCISE - वस्तुनिष्ठ प्रश्न
15 Videos
- लम्ब वृतीय बेलन BOOK - KC SINHACHAPTER - लम्ब वृतीय बेलन EXERCISE - वस्तुनिष्ट प्रश्न
10 Videos
Similar Questions
यदि m,n,p तीन रेखाएं इस तरह है कि p∣∣m और n⊥p साबित करें कि n⊥m.
View Solutionरिक्त स्थानों को भरें:
किसी त्रिभुज के तीनों कोणों की मापों का योग .............. होता है।
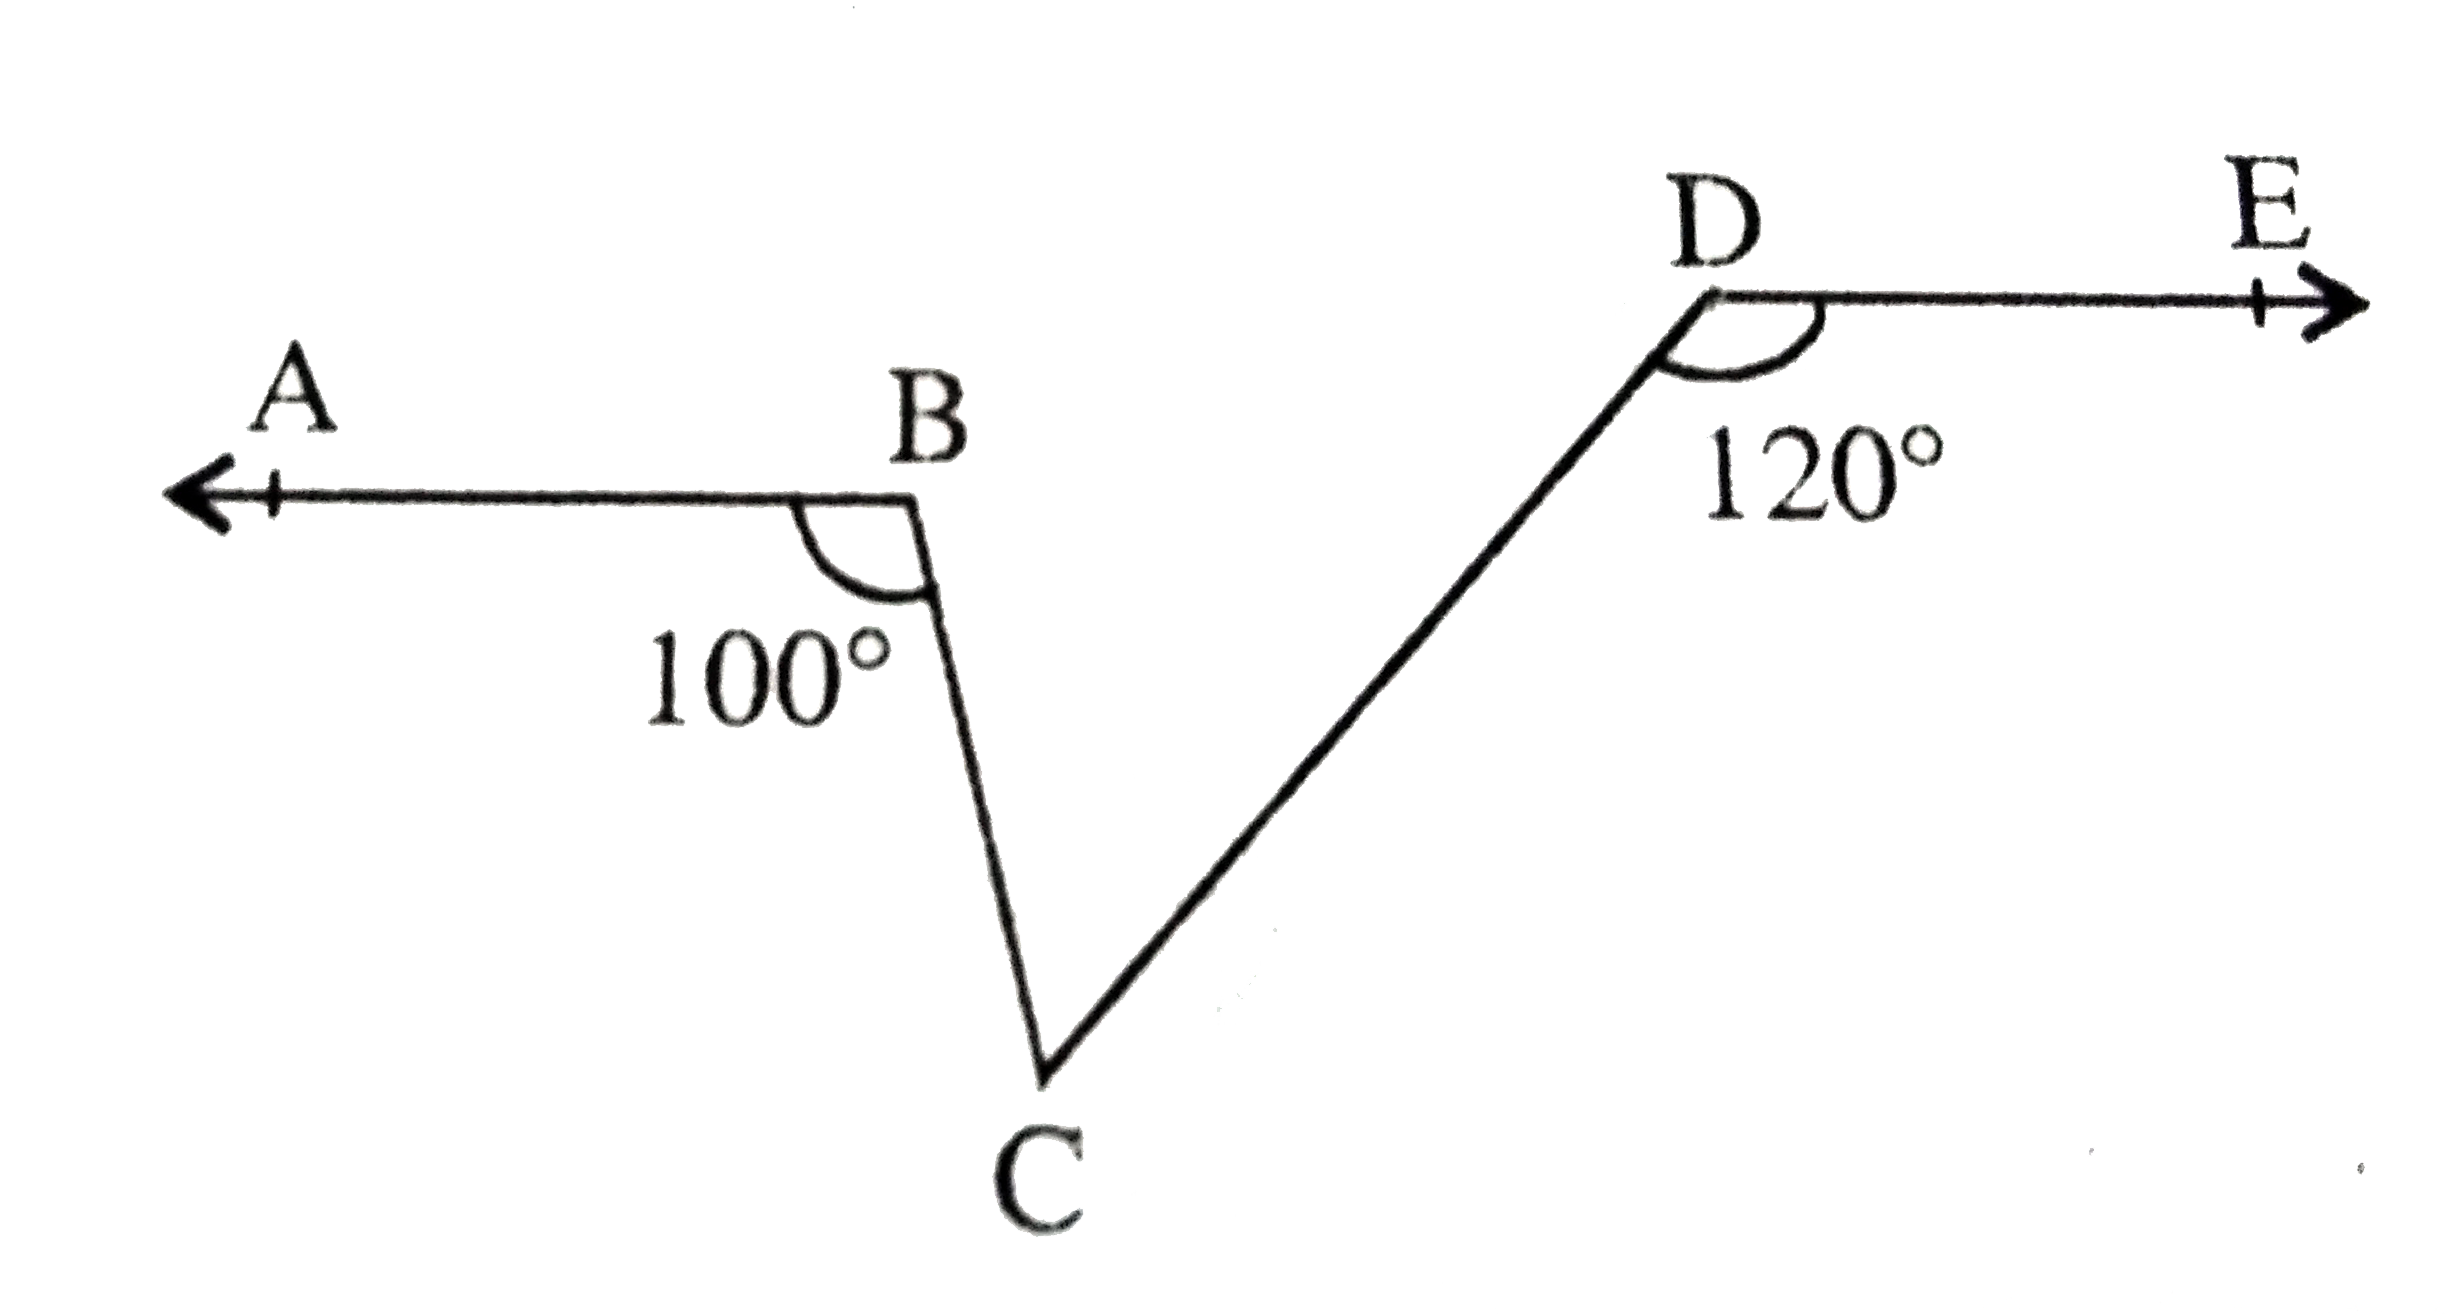
View Solutionनीचे की आकृति में यदि AB∣∣DE तो ∠BCD का मान निकालें।

View Solutionएक बिंदु से होकर कितनी रेखाएँ खींची जा सकती हैं ?
View Solutionएक बेलन के आधार का व्यास 14 सेमी है और उसका वक्रपृष्ठ 1540 सेमी 2 है तो उसकी ऊंचाई है
View SolutionHow many lines of symmetry does the above figure have ?
View SolutionWhich of the following are correct chain isomers of butane ? (i)
View SolutionDetermine the point of symmetry of a regular hexagon.
View SolutionDtermine the images of the following figure about the given line :
View SolutionMatch the following Column A to Column B

View SolutionMatch the following Column A to Column B

View SolutionMatch the following Column A to Column B

View SolutionThe inequation represented by the graph given below is :
View SolutionThe inequation that best describes the graph given below is _________
View SolutionThe inequation that best describes the following graph is _________
View SolutionWhich inequations represent the shaded region in the given figure
View Solution
