दिए गए चित्र में पाँच विद्यालयों में वर्ग 9 की परीक्षा में 80% से अधिक अंक लाने वाले विद्यार्थियों की संख्या का दंड आलेख दिखाया गया है। विद्यलय Q में 80% से अधिक अंक लाने वाले विद्यार्थियों की संख्या है
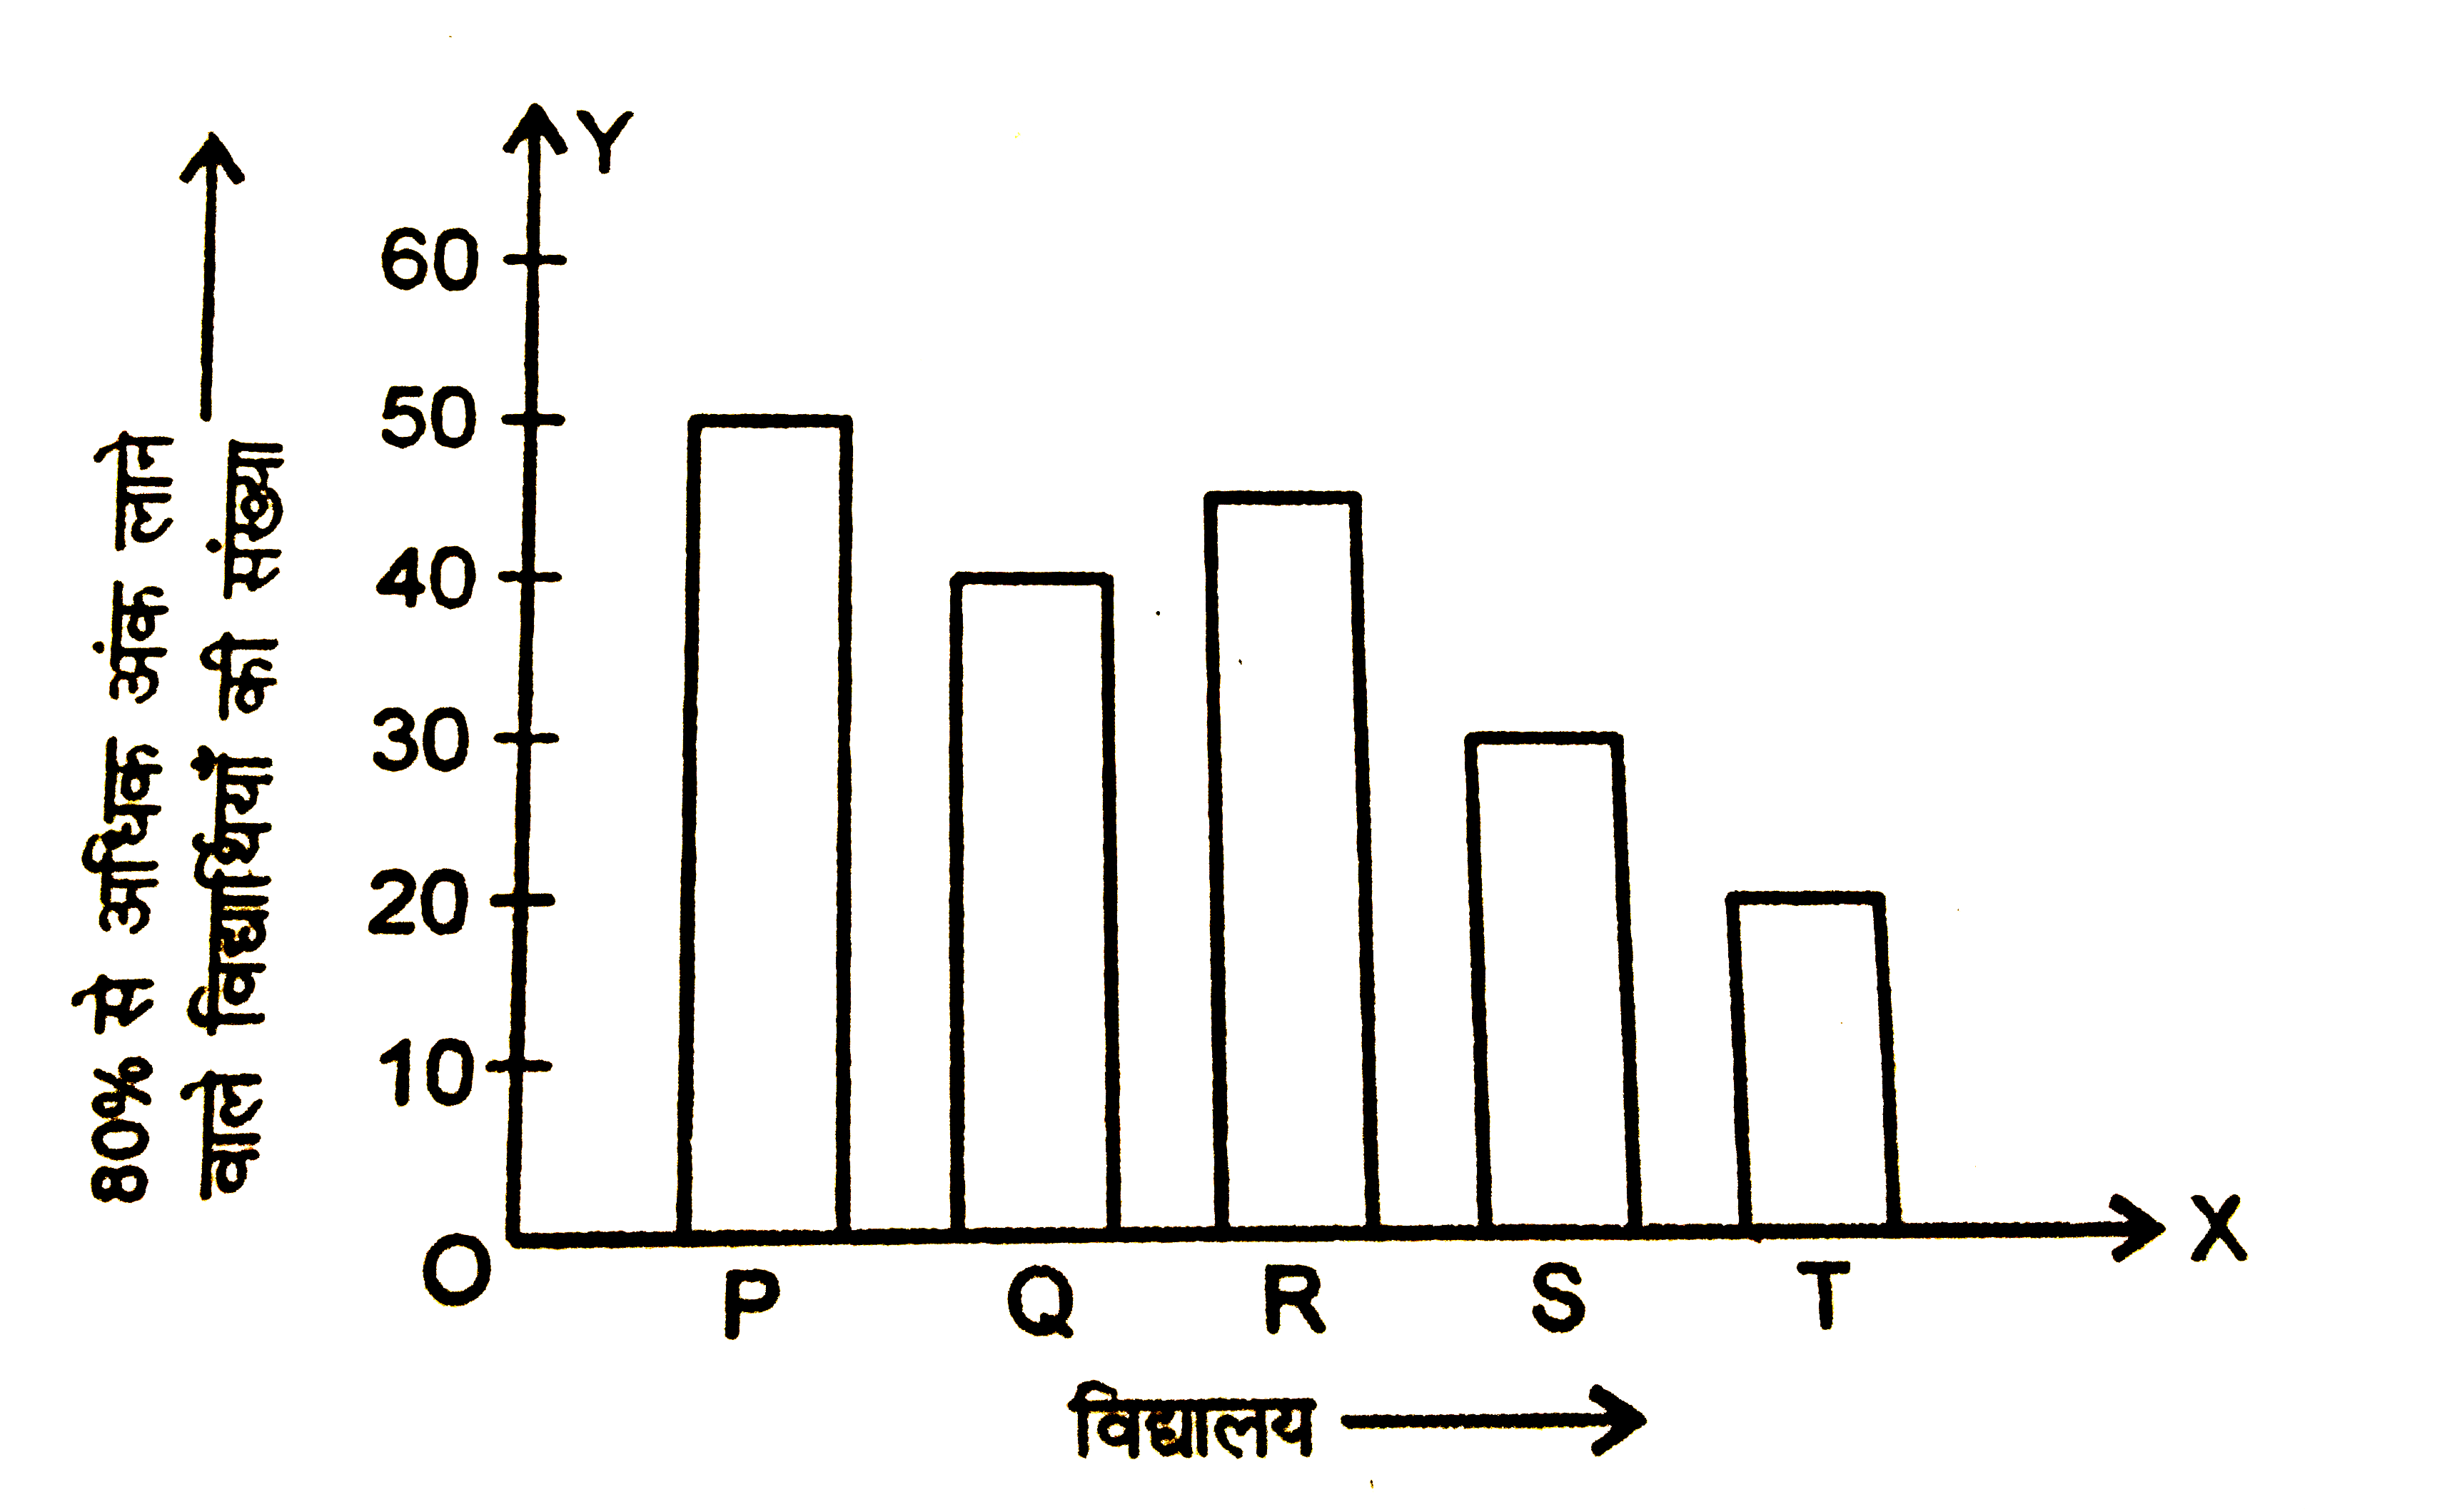
30
40
45
50
The correct Answer is:B
Step by step video & image solution for दिए गए चित्र में पाँच विद्यालयों में वर्ग 9 की परीक्षा में 80% से अधिक अंक लाने वाले विद्यार्थियों की संख्या का दंड आलेख दिखाया गया है। विद्यलय Q में 80% से अधिक अंक लाने वाले विद्यार्थियों की संख्या है by Maths experts to help you in doubts & scoring excellent marks in Class 9 exams.
Updated on:21/07/2023Topper's Solved these Questions
Similar Questions
एक परिवार ने जिसकी मासिक आय 20000 रु है, विभिन्न पदो के अंतर्गत हर महीने होने वाले खर्च की योजना बनाई थी :
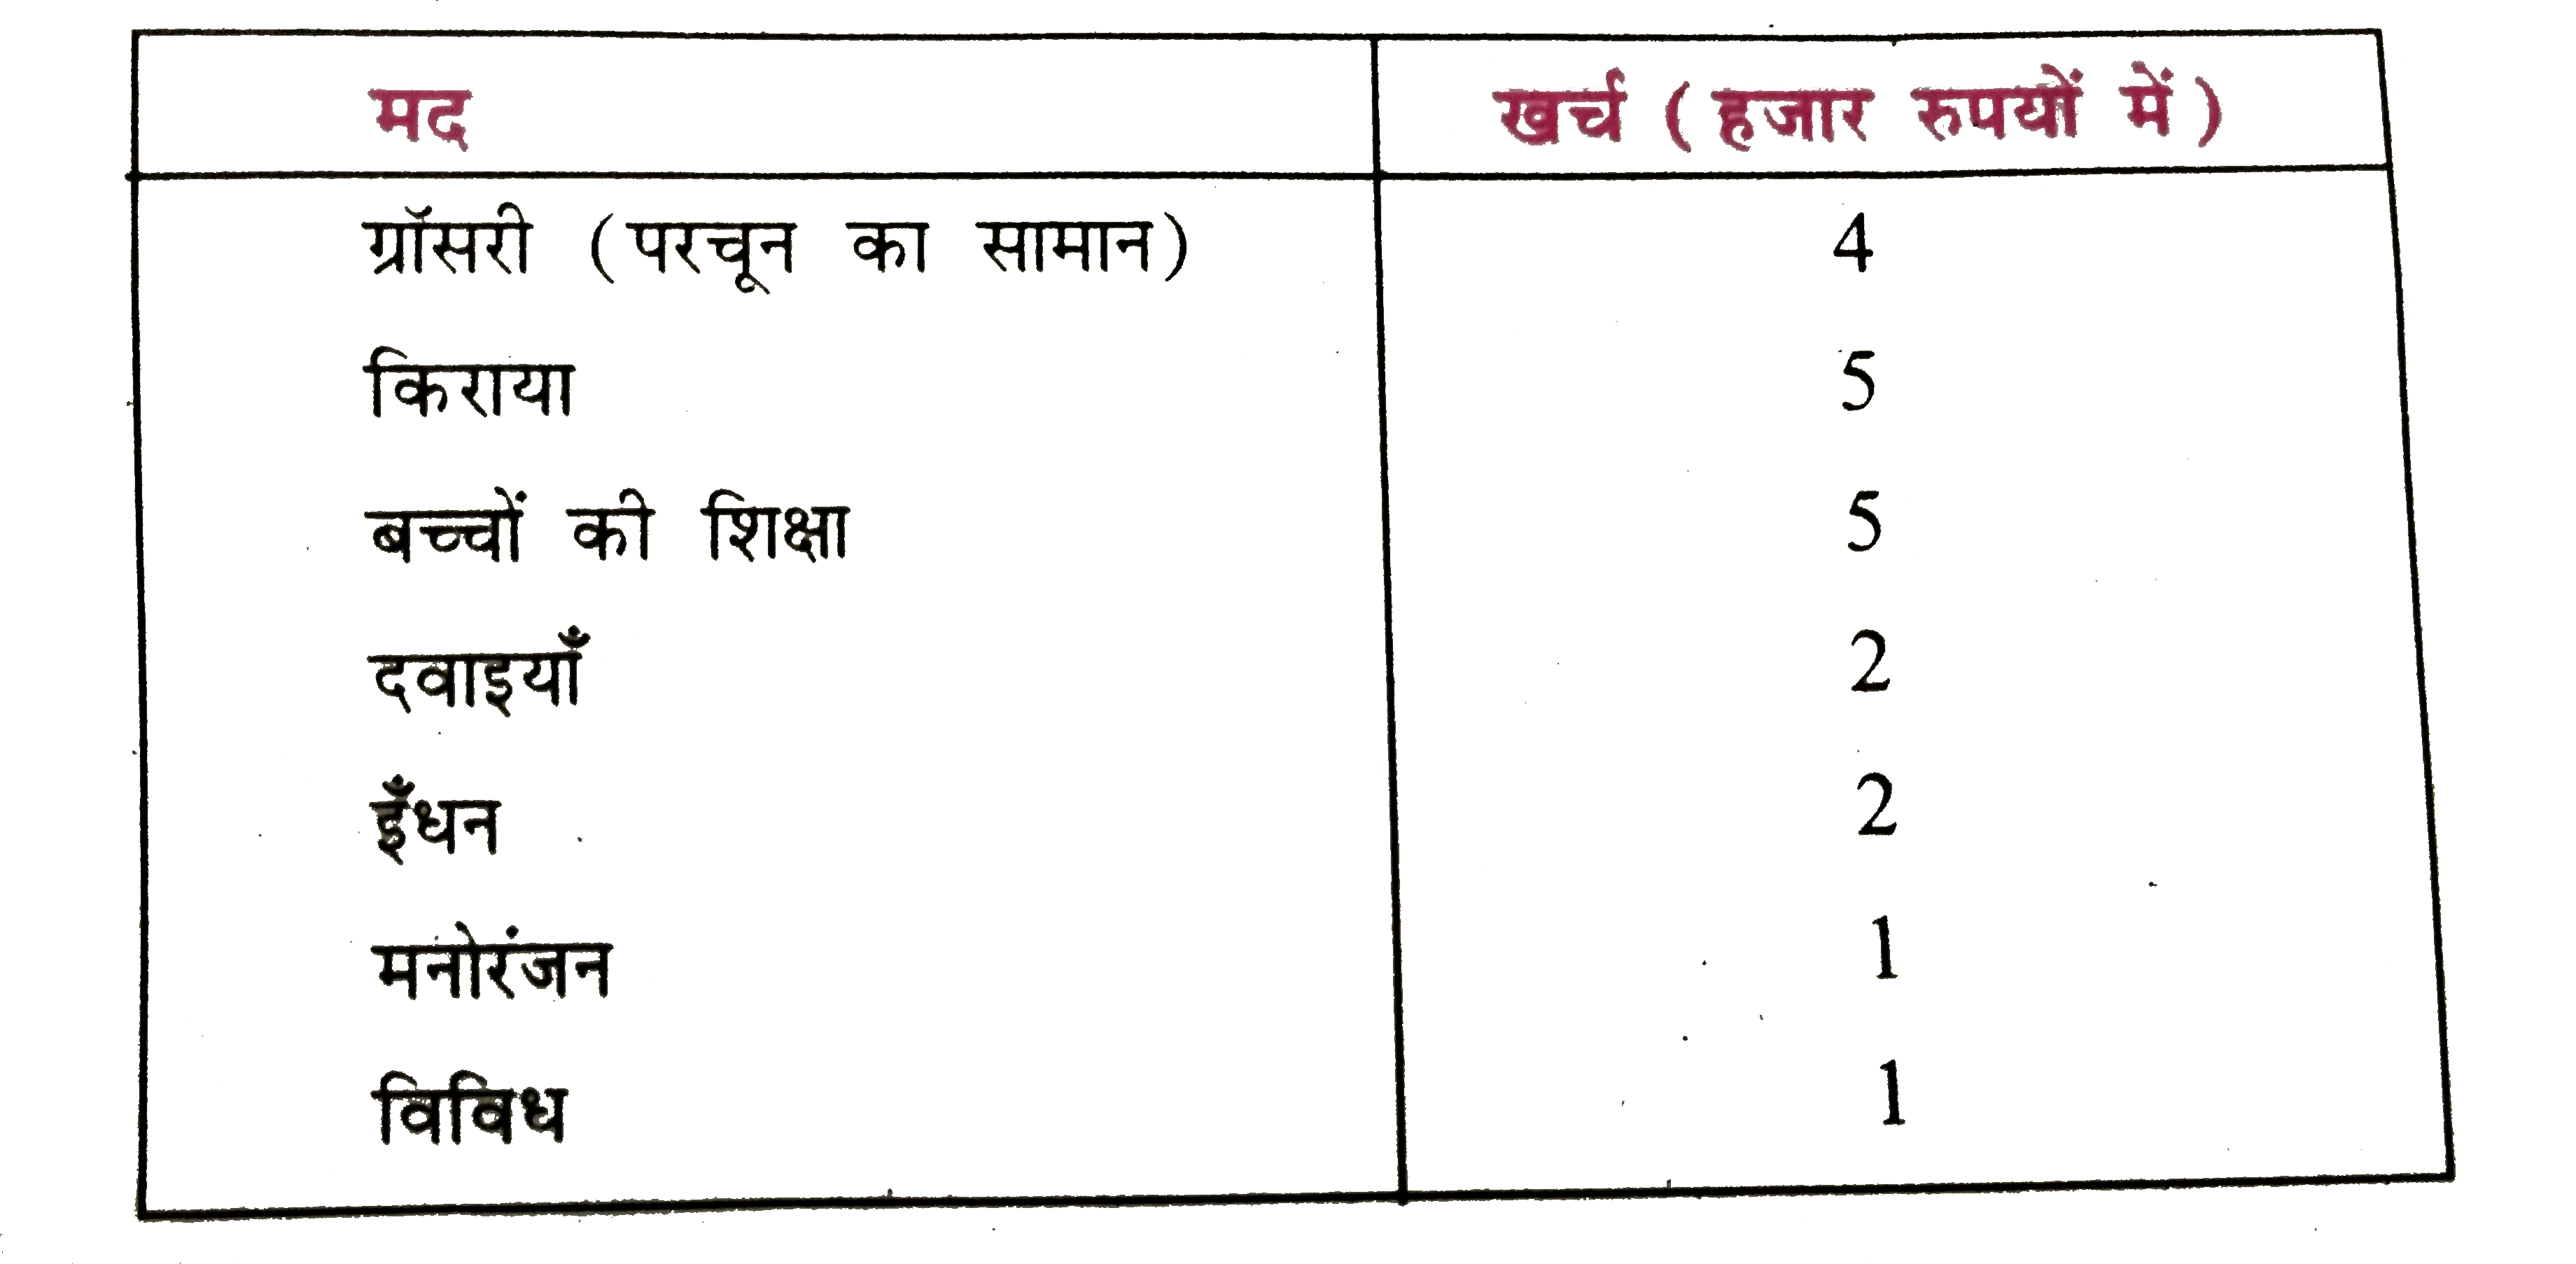
ऊपर दिए गए आँकड़ो का एक दंड आलेख बनाइए।
View Solutionसंग्रहीत आंकड़े में किसी पद की पुनरावृत्तियों की संख्या उस पद की क्या कहलाती है :-
View SolutionMatch the following Column A to Column B

View SolutionMatch the following Column A to Column B

View SolutionMatch the following Column A to Column B

View Solutionदिये गये चित्र में स्पर्श रेखाओ की संख्या है -
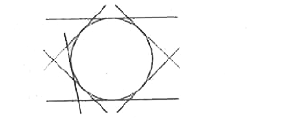
View Solutionदिये गये चित्र में स्पर्श रेखाओ की संख्या है:

View Solutionकरें इन प्रश्नों की तैयारी अगर लाने हैं परीक्षा में अच्छे अंक
View Solutionकरें इन प्रश्नों की तैयारी अगर लाने हैं परीक्षा में अच्छे अंक
View Solutionदो अंको की एक संख्या में इकाई स्थान का अंक दहाई स्थान के अंक से 3 अधिक है यदि दोनों अंकों का जोड़ 11 हो तो संख्या निकालिए।
View SolutionStudy the following pie chart and table to answer the question.Total number of students admitted in a university in various fields = 5000 Distribution of the number of students into various fields: The ratio of the number of boys in Economics to the number of students in Economics is: निम्नांकित पाई चार्ट का अध्ययन कीजिए और उसके बाद दिए गए प्रशन का उत्तर दीजिए। एक विश्वविद्यालय में विभिन्न संकायों में प्रवेश लेने वाले विद्यार्थियों की संख्या 5000 है। विभिन्न संकायों में विद्यार्थियों को संख्या का बंटनः इकोनॉमिक्स में लड़कों की संख्या का, इकोनॉमिक्स में कुल विद्यार्थियों की संख्या से क्या अनुपात हे?
View Solutionविद्यार्थियों की एक पंक्ति में , सोहन का स्थान दोनों मे से किसी भी किनारे से 9 वाँ है तब विद्यार्थियों की कुल संख्या होगी ?
View SolutionThe given graph shows the marks obtained by students in an examination.
दिया गया आरेख किसी परीक्षा में छात्रों के प्राप्तांक दर्शाता है |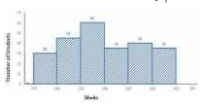 The number of students who obtained less than 300 marks is what percent more than the number of students who obtained 350 or more marks?
300 अंक से कम प्राप्त करने वाले छात्रों की संख्या 350 या इससे अधिक अंक प्राप्त करने वाले छात्रों की संख्या से कितना प्रतिशत अधिक है ?
View SolutionStudy the following histogram and answer the given question
निम्नलिखित आयत चित्र का अध्ययन करें और दिए गए प्रश्न का उत्तर दें।
What is the ratio of the number of students who scored 30 or more marks, but below 40 marks, to the total number of students in the entrance examination ?
प्रवेश परीक्षा में 30 या अधिक लेकिन 40 से कम अंक लाने वाले छात्रों की संख्या का प्रवेश परीक्षा में शामिल कुछ छात्रों की संख्या से क्या अनुपात है?
View SolutionThe given Bar Graph presents the number of students of two schools for six years. दिया गया दंड आरेख (बार ग्राफ) छह वर्षो के दौरान दो स्कूलों में विद्यार्थियों की संख्या को दर्शाता है| In which year, the percentage increase in students in school B is the highest in comparison to its previous year? किस वर्ष में, स्कूल B के विद्यार्थियों की संख्या में प्रतिशत वृद्धि इसके पिछले वर्ष की तुलना में सबसे अधिक है?
View Solution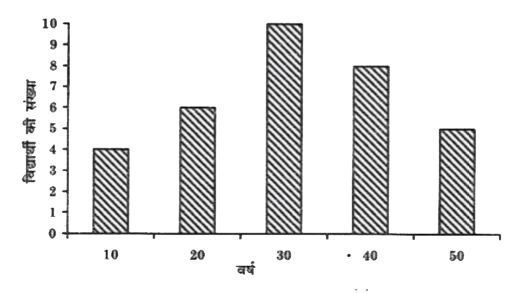
The least number of students got the marks in the interval.
किस अंतराल में अंक प्राप्त करने वाले विद्यार्थियों की न्यूनतम संख्या थी?
View Solution
