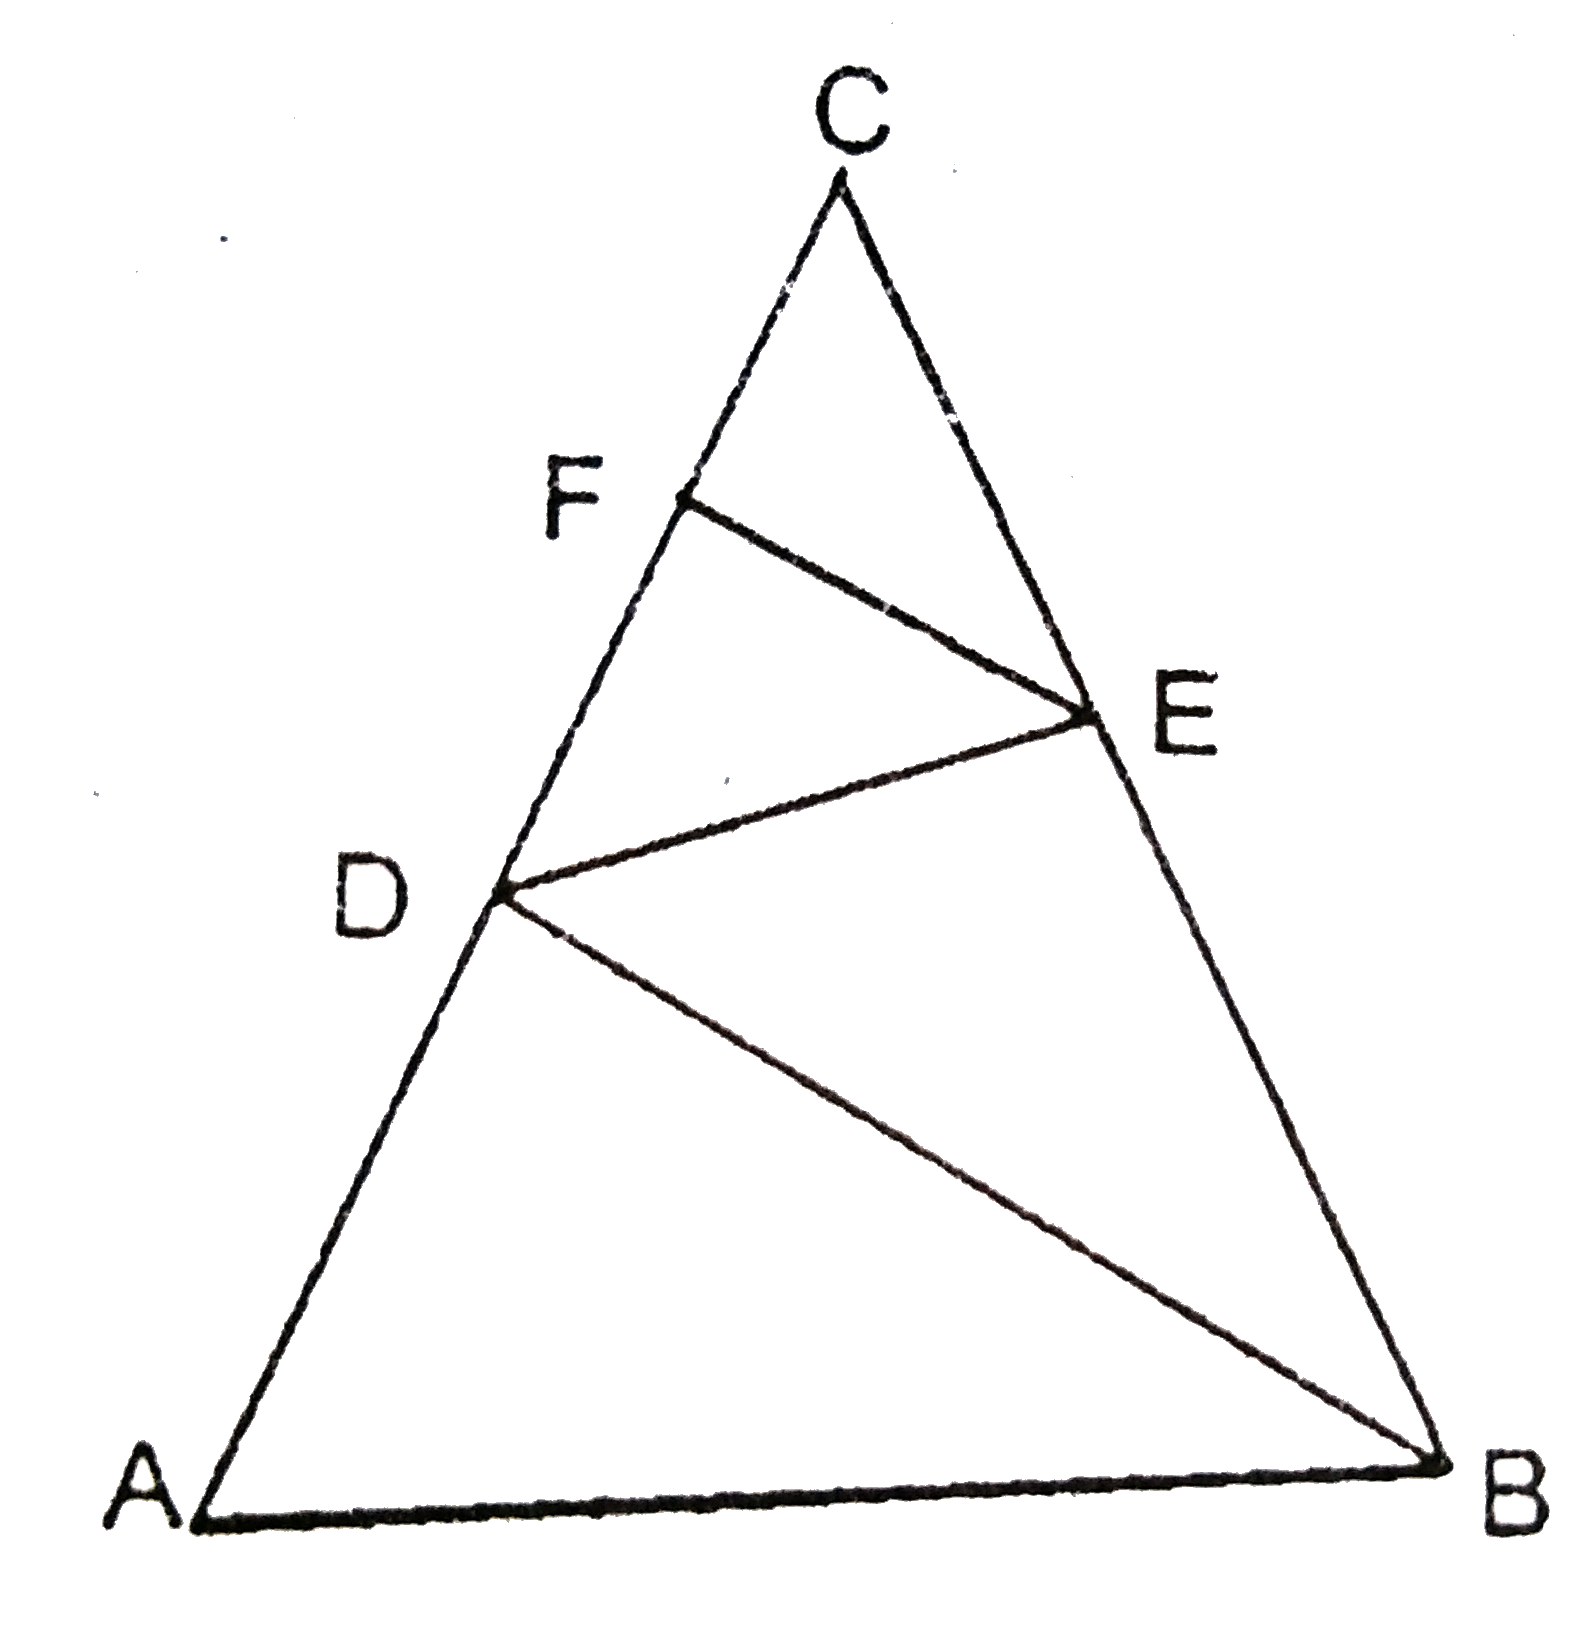
दिये गये चित्र में यदि AB∣∣DE और BD∣∣EF, तो सिद्ध करें कि DC2=CF.AC.

दिया है : ABC एक त्रिभुज है और AB∣∣DE तथा BD∣∣EF
सिद्ध करना है : DC2=CF.AC
उपपत्ति : ΔABC में DE∣∣AB इसलिए थेल्स प्रमेय के उप - प्रमेय से ,
ACDC=BCCE
पुनः ΔBCDमें, EF∣∣BD
⇒DCCF=BCCE
(i) और (ii) से हम पाते है ।
ACDC=DCCF
⇒AC.CF=DC.DC⇒DC2=CF.AC.

Topper's Solved these Questions
- BOOK - KC SINHACHAPTER - त्रिभुज EXERCISE - EXCERCISE 6.122videos
त्रिभुज
- BOOK - KC SINHACHAPTER - त्रिभुज EXERCISE - EXCERCISE 6.2 (अतिलघु उत्तरीय प्रश्न )8videos
त्रिभुज
- BOOK - KC SINHACHAPTER - त्रिकोणमितीय अनुपात और सर्वसमिकाएँ EXERCISE - EXERCISE 8.485videos
त्रिकोणमितीय अनुपात और सर्वसमिकाएँ
- BOOK - KC SINHACHAPTER - दो चर वाले रैखिक समीकरण युग्मEXERCISE - वस्तुनिष्ठ प्रश्न44videos
दो चर वाले रैखिक समीकरण युग्म
Similar Questions
कोष्ठक में दिए उपयुक्त शब्द से रिक्त स्थानों को भरें :
2 cm भुजा वाले सभी वर्ग ................. होते है । (सद्रश्य , सर्वागसम , सद्रश्य और सर्वागसम दोनों)01:37View SolutionΔABC में ,P और AB क्रमशः AB तथा AC पर दो बिन्दु इस प्रकार है कि PQ∣∣BC और APPB=23 तो AQQC का मान ज्ञात करें ।
06:07View Solutionरिक्त स्थानों की पूर्ति करें :
sin2θ+cos2θ= ……………..02:11View Solutionयदि a1b2≠a2b1 तब समीकरण निकाय a1x+b1y+c1=0,a2x+b2y+c2=0 का
01:31View SolutionHow many lines of symmetry does the above figure have ?
02:45View SolutionWhich of the following are correct chain isomers of butane ? (i)
02:17View SolutionDetermine the point of symmetry of a regular hexagon.
05:41View SolutionDtermine the images of the following figure about the given line :
02:21View SolutionMatch the following Column A to Column B
 02:03View Solution
Match the following Column A to Column B
 02:10View Solution
Match the following Column A to Column B
 02:17View Solution
Find the area of the figure given below.
 02:10View Solution
The area of the shaded part in the figure given below is ______.
 04:23View Solution
The inequation represented by the graph given below is :
01:13View SolutionThe inequation that best describes the graph given below is _________
03:12View SolutionThe inequation that best describes the following graph is _________
05:46View Solution

