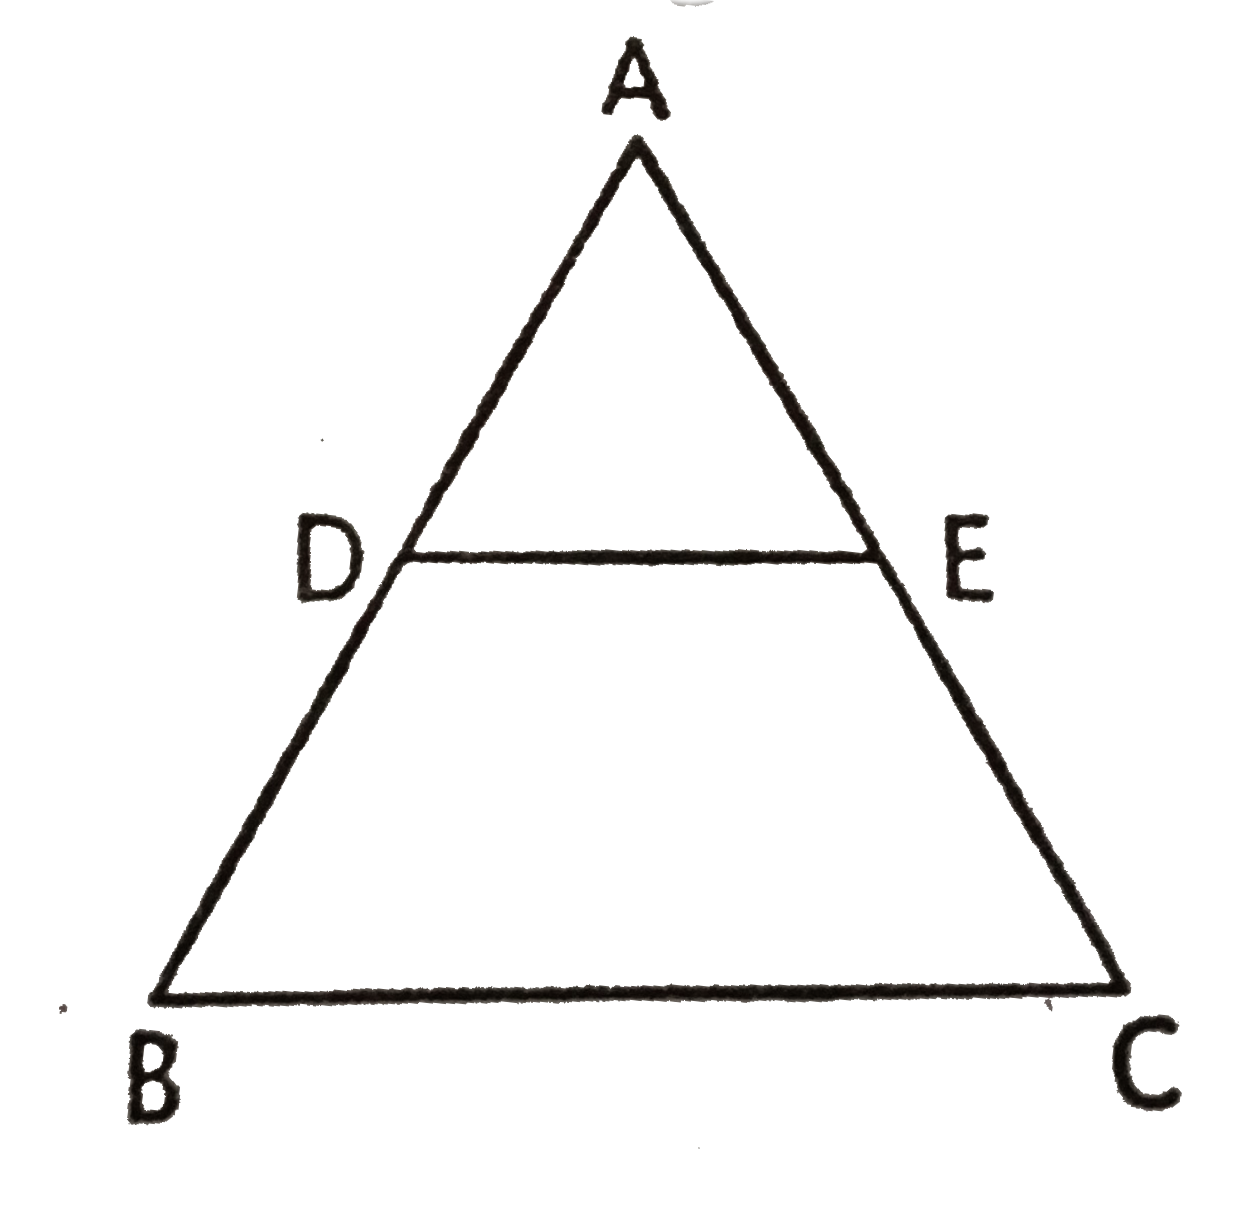
दी गई आकृति में DE∣∣BC और ADDB=35 यदि AC=4.8 सेमी हो , तो AE का मान ज्ञात कीजिए ।

The correct Answer is:1.8 सेमी
Step by step video & image solution for दी गई आकृति में DE||BC और (AD)/(DB)=(3)/(5) यदि AC=4.8 सेमी हो , तो AE का मान ज्ञात कीजिए । by Maths experts to help you in doubts & scoring excellent marks in Class 10 exams.
Updated on:21/07/2023Topper's Solved these Questions
- त्रिभुज BOOK - KC SINHACHAPTER - त्रिभुज EXERCISE - वस्तुनिष्ठ प्रश्न
28 Videos
- त्रिभुज BOOK - KC SINHACHAPTER - त्रिभुज EXERCISE - EXCERCISE 6.5 Type II. (पाइथागोरस प्रमेय , इसके उप -प्रमेयों और अन्य परिणामों पर आधारित प्रश्न : ( दीर्घउत्तरीय प्रश्न ) ( Long Answer Type Questions)
4 Videos
- त्रिकोणमितीय अनुपात और सर्वसमिकाएँ BOOK - KC SINHACHAPTER - त्रिकोणमितीय अनुपात और सर्वसमिकाएँ EXERCISE - EXERCISE 8.4
85 Videos
- दो चर वाले रैखिक समीकरण युग्मBOOK - KC SINHACHAPTER - दो चर वाले रैखिक समीकरण युग्मEXERCISE - वस्तुनिष्ठ प्रश्न
44 Videos
Similar Questions
ΔABC में DE∣∣BC और ADDB=53 तब AEAC=
View SolutionΔABC में , D भुजा BC का मध्यबिन्दु है और AE⊥BC. यदि AC>AB दिखाएँ कि AB2=AD2−BC.DE+14BC2.
View Solutionरिक्त स्थानों की पूर्ति करें :
sin2θ+cos2θ= ……………..
View Solutionयदि a1b2≠a2b1 तब समीकरण निकाय a1x+b1y+c1=0,a2x+b2y+c2=0 का
View SolutionHow many lines of symmetry does the above figure have ?
View SolutionWhich of the following are correct chain isomers of butane ? (i)
View SolutionDetermine the point of symmetry of a regular hexagon.
View SolutionDtermine the images of the following figure about the given line :
View SolutionIn the figure above (not to scale), ¯¯¯¯¯¯AB⊥¯¯¯¯¯¯CDandAD is the bisector of ∠BAE.AB=3cm and AC=5cm. Find CD.
View SolutionMatch the following Column A to Column B

View SolutionMatch the following Column A to Column B

View SolutionMatch the following Column A to Column B

View SolutionThe inequation represented by the graph given below is :
View SolutionThe inequation that best describes the graph given below is _________
View SolutionThe inequation that best describes the following graph is _________
View SolutionWhich inequations represent the shaded region in the given figure
View Solution
