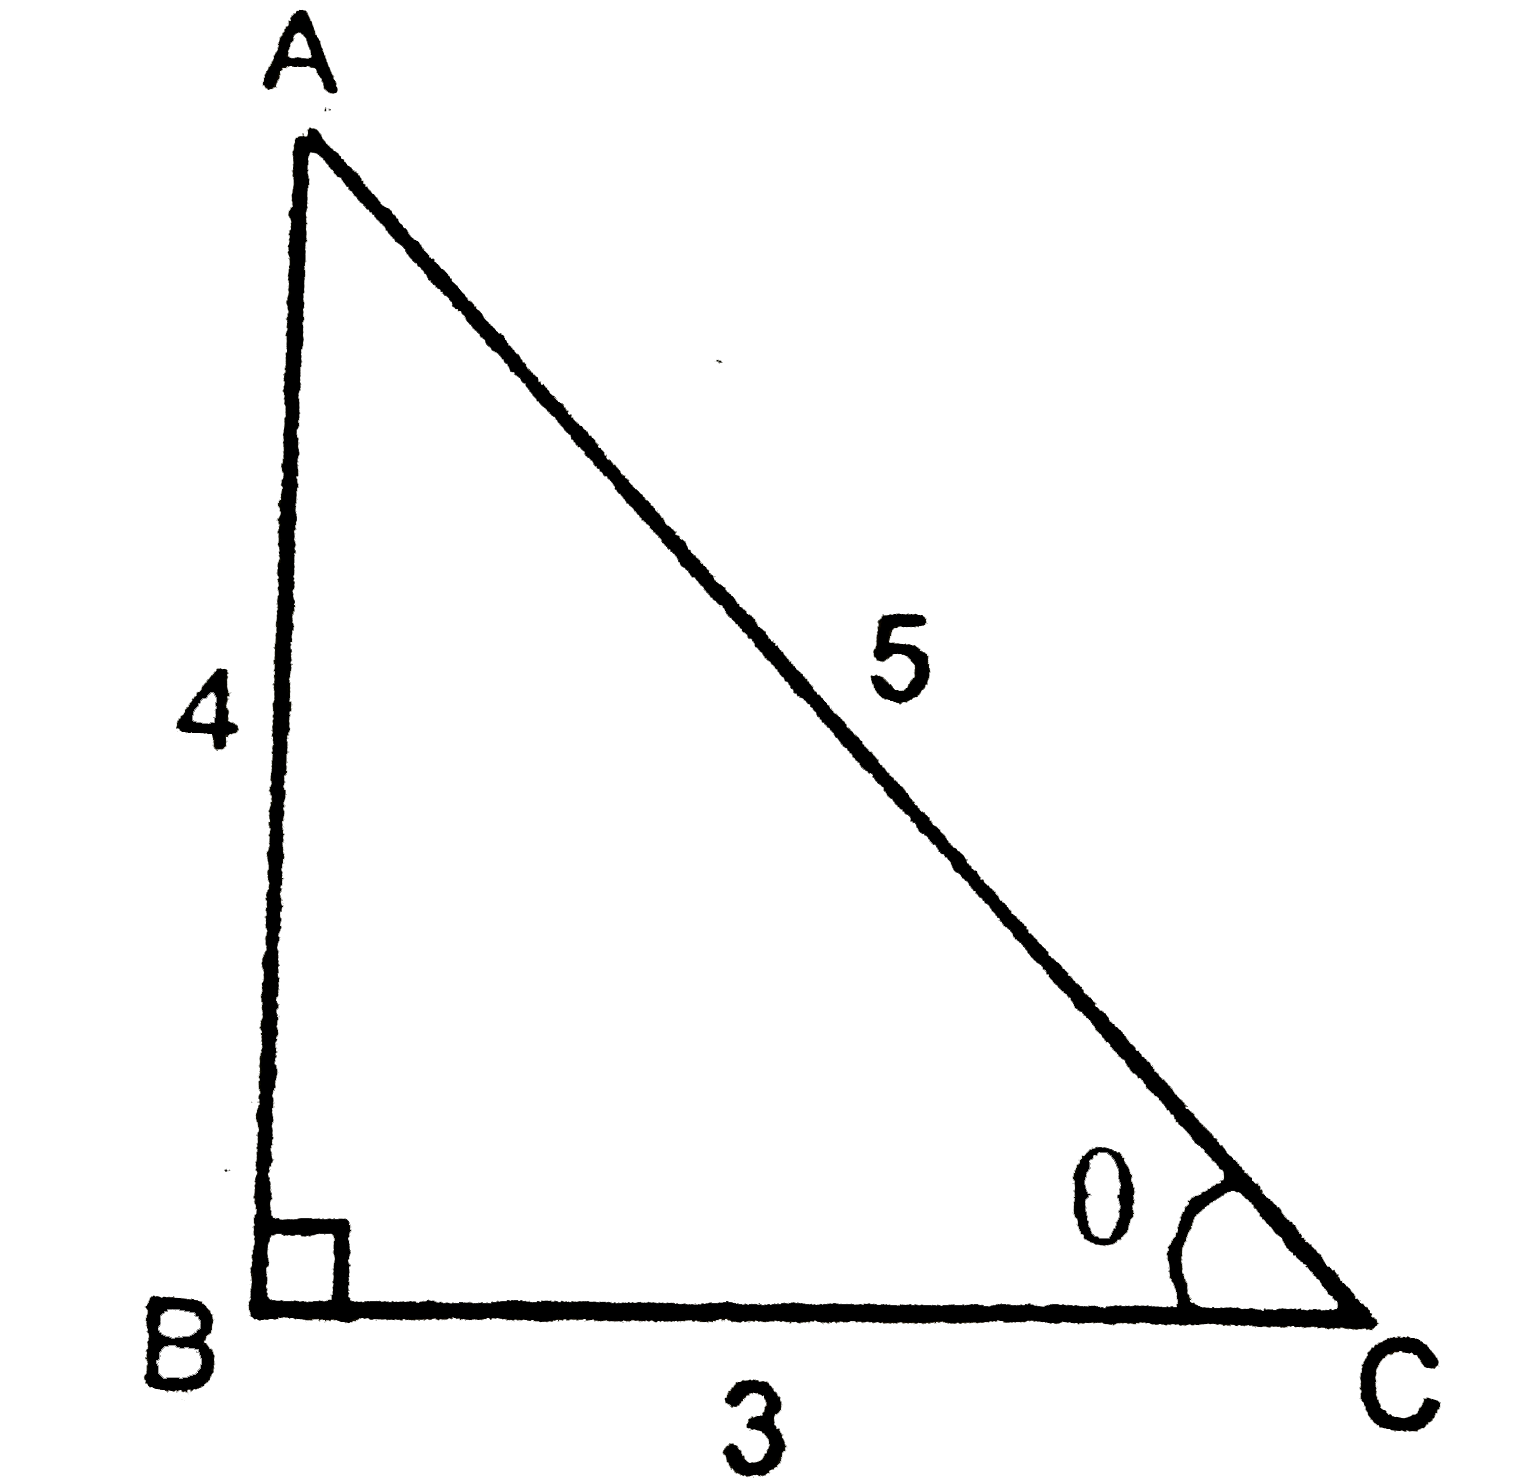
दिए गये चित्र से निम्नलिखित के मान ज्ञात कीजिए :
(i)tanθ (ii)cosC

The correct Answer is:(ii) 43 (ii)35
Step by step video & image solution for दिए गये चित्र से निम्नलिखित के मान ज्ञात कीजिए : (i) tan theta" "(ii) cos C by Maths experts to help you in doubts & scoring excellent marks in Class 10 exams.
Updated on:21/07/2023Topper's Solved these Questions
- त्रिकोणमितीय अनुपात और सर्वसमिकाएँ BOOK - KC SINHACHAPTER - त्रिकोणमितीय अनुपात और सर्वसमिकाएँ EXERCISE - लघु उत्तरीय प्रश्न
87 Videos
- त्रिकोणमितीय अनुपात और सर्वसमिकाएँ BOOK - KC SINHACHAPTER - त्रिकोणमितीय अनुपात और सर्वसमिकाएँ EXERCISE - वस्तुनिष्ठ प्रश्न
3 Videos
- त्रिकोणमितीय अनुपात और सर्वसमिकाएँ BOOK - KC SINHACHAPTER - त्रिकोणमितीय अनुपात और सर्वसमिकाएँ EXERCISE - EXERCISE 8.4
85 Videos
- त्रिकोणमिति के कुछ अनुप्रयोग BOOK - KC SINHACHAPTER - त्रिकोणमिति के कुछ अनुप्रयोग EXERCISE - वस्तुनिष्ठ प्रश्न
14 Videos
- त्रिभुज BOOK - KC SINHACHAPTER - त्रिभुज EXERCISE - वस्तुनिष्ठ प्रश्न
28 Videos
Similar Questions
यदि tanA=ba,जहाँ a और b वास्तविक संख्याएँ है , तो sin2A का मान ज्ञात करें ।
View Solutionयदि tanθ=512, तब निम्नलिखित में sinθ का मान कौन है ?
View Solutionरिक्त स्थानों की पूर्ति करें :
sin2θ+cos2θ= ……………..
View Solutionयदि एक मीनार के पाद से 100 m दूर स्थित बिंदु पर मीनार का उन्नयन कोण60∘ है , तो मीनार कि ऊँचाई है :
View SolutionΔABC में DE∣∣BC और ADDB=53 तब AEAC=
View SolutionHow many lines of symmetry does the above figure have ?
View SolutionWhich of the following are correct chain isomers of butane ? (i)
View SolutionDetermine the point of symmetry of a regular hexagon.
View SolutionDtermine the images of the following figure about the given line :
View SolutionMatch the following Column A to Column B

View SolutionMatch the following Column A to Column B

View SolutionMatch the following Column A to Column B

View SolutionFind the area of the figure given below.

View SolutionThe area of the shaded part in the figure given below is ______.

View SolutionThe inequation represented by the graph given below is :
View SolutionThe inequation that best describes the graph given below is _________
View Solution
