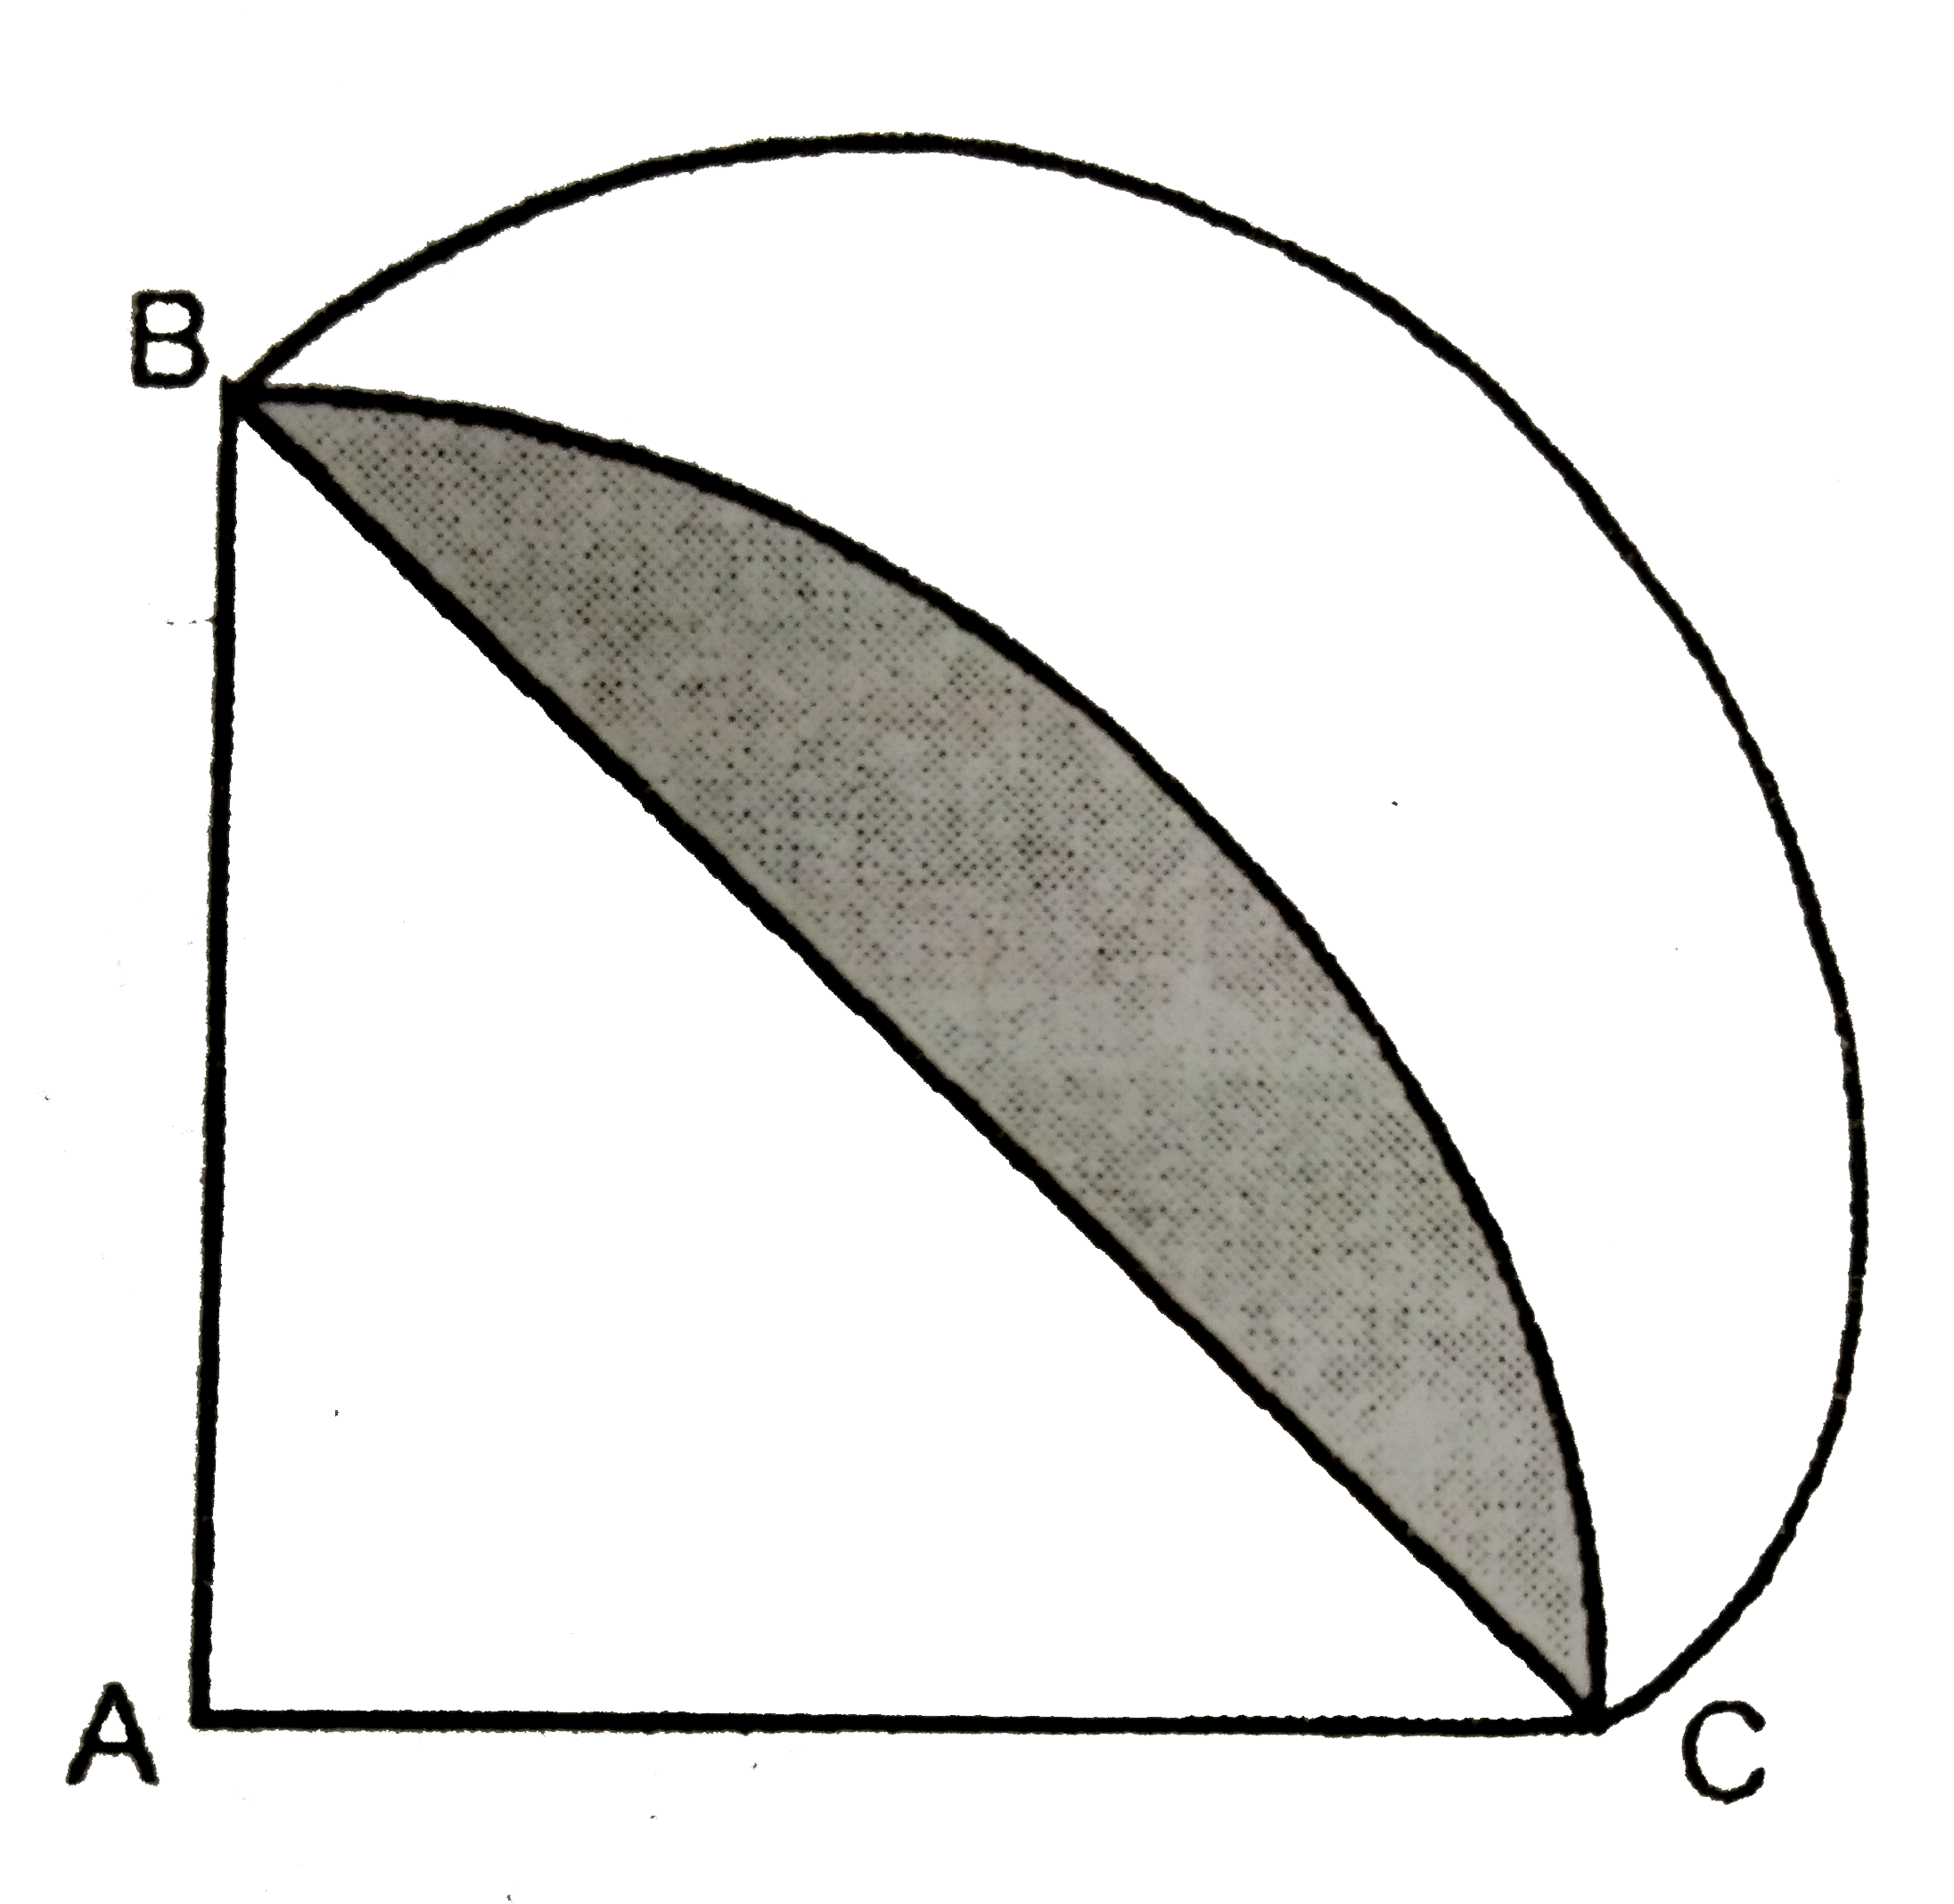
चित्र में ABC , 14 cm त्रिज्या वाले एक वृत्त का चतुर्थांश है तथा BC को व्यास मानकर एक अर्द्धवृत खींचा गया है | छायांकित भाग का क्षेत्रफल ज्ञात कीजिए |

The correct Answer is:56cm2
Step by step video & image solution for चित्र में ABC , 14 cm त्रिज्या वाले एक वृत्त का चतुर्थांश है तथा BC को व्यास मानकर एक अर्द्धवृत खींचा गया है | छायांकित भाग का क्षेत्रफल ज्ञात कीजिए | by Maths experts to help you in doubts & scoring excellent marks in Class 10 exams.
Updated on:21/07/2023Topper's Solved these Questions
- वृत्तों से संबंधित क्षेत्रफल BOOK - KC SINHACHAPTER - वृत्तों से संबंधित क्षेत्रफल EXERCISE - अतिलघु उत्तरीय प्रश्न
19 Videos
- वृत्तों से संबंधित क्षेत्रफल BOOK - KC SINHACHAPTER - वृत्तों से संबंधित क्षेत्रफल EXERCISE - वस्तुनिष्ठ प्रश्न
21 Videos
- वृत्तों से संबंधित क्षेत्रफल BOOK - KC SINHACHAPTER - वृत्तों से संबंधित क्षेत्रफल EXERCISE - वस्तुनिष्ठ प्रश्न
21 Videos
- वृत्त BOOK - KC SINHACHAPTER - वृत्त EXERCISE - वस्तुनिष्ट प्र्शन
36 Videos
- समांतर श्रेढ़ी BOOK - KC SINHACHAPTER - समांतर श्रेढ़ी EXERCISE - वस्तुनिष्ठ प्रश्न
32 Videos
Similar Questions
7 cm त्रिज्या वाले एक त्रिज्यखण्ड का परिमाप ज्ञात कीजिए जिसका कोण 45∘ है |
View Solutionयदि एक अर्द्धवृत का परिमाप 36 cm हो, तो इसकी त्रिज्या है |
View Solutionयदि एक अर्द्धवृत का परिमाप 36 cm हो, तो इसकी त्रिज्या है |
View Solutionयदि एक वृत्त पर जिसका केंद्र O हैं, बिंदु P से खींची गई स्पर्श रेखाएँ PA और PB एक-दूसरे से 80∘ के कोण-पर झुकी हैं, तब ∠POA बराबर हैं|
View Solutionयदि A.P. का nवाँ पद 3n + 5 हैं तो इसका सार्वअंतर होगा।
View SolutionHow many lines of symmetry does the above figure have ?
View SolutionWhich of the following are correct chain isomers of butane ? (i)
View SolutionDetermine the point of symmetry of a regular hexagon.
View SolutionDtermine the images of the following figure about the given line :
View SolutionMatch the following Column A to Column B

View SolutionMatch the following Column A to Column B

View SolutionMatch the following Column A to Column B

View SolutionThe inequation represented by the graph given below is :
View SolutionThe inequation that best describes the graph given below is _________
View SolutionThe inequation that best describes the following graph is _________
View SolutionWhich inequations represent the shaded region in the given figure
View Solution
