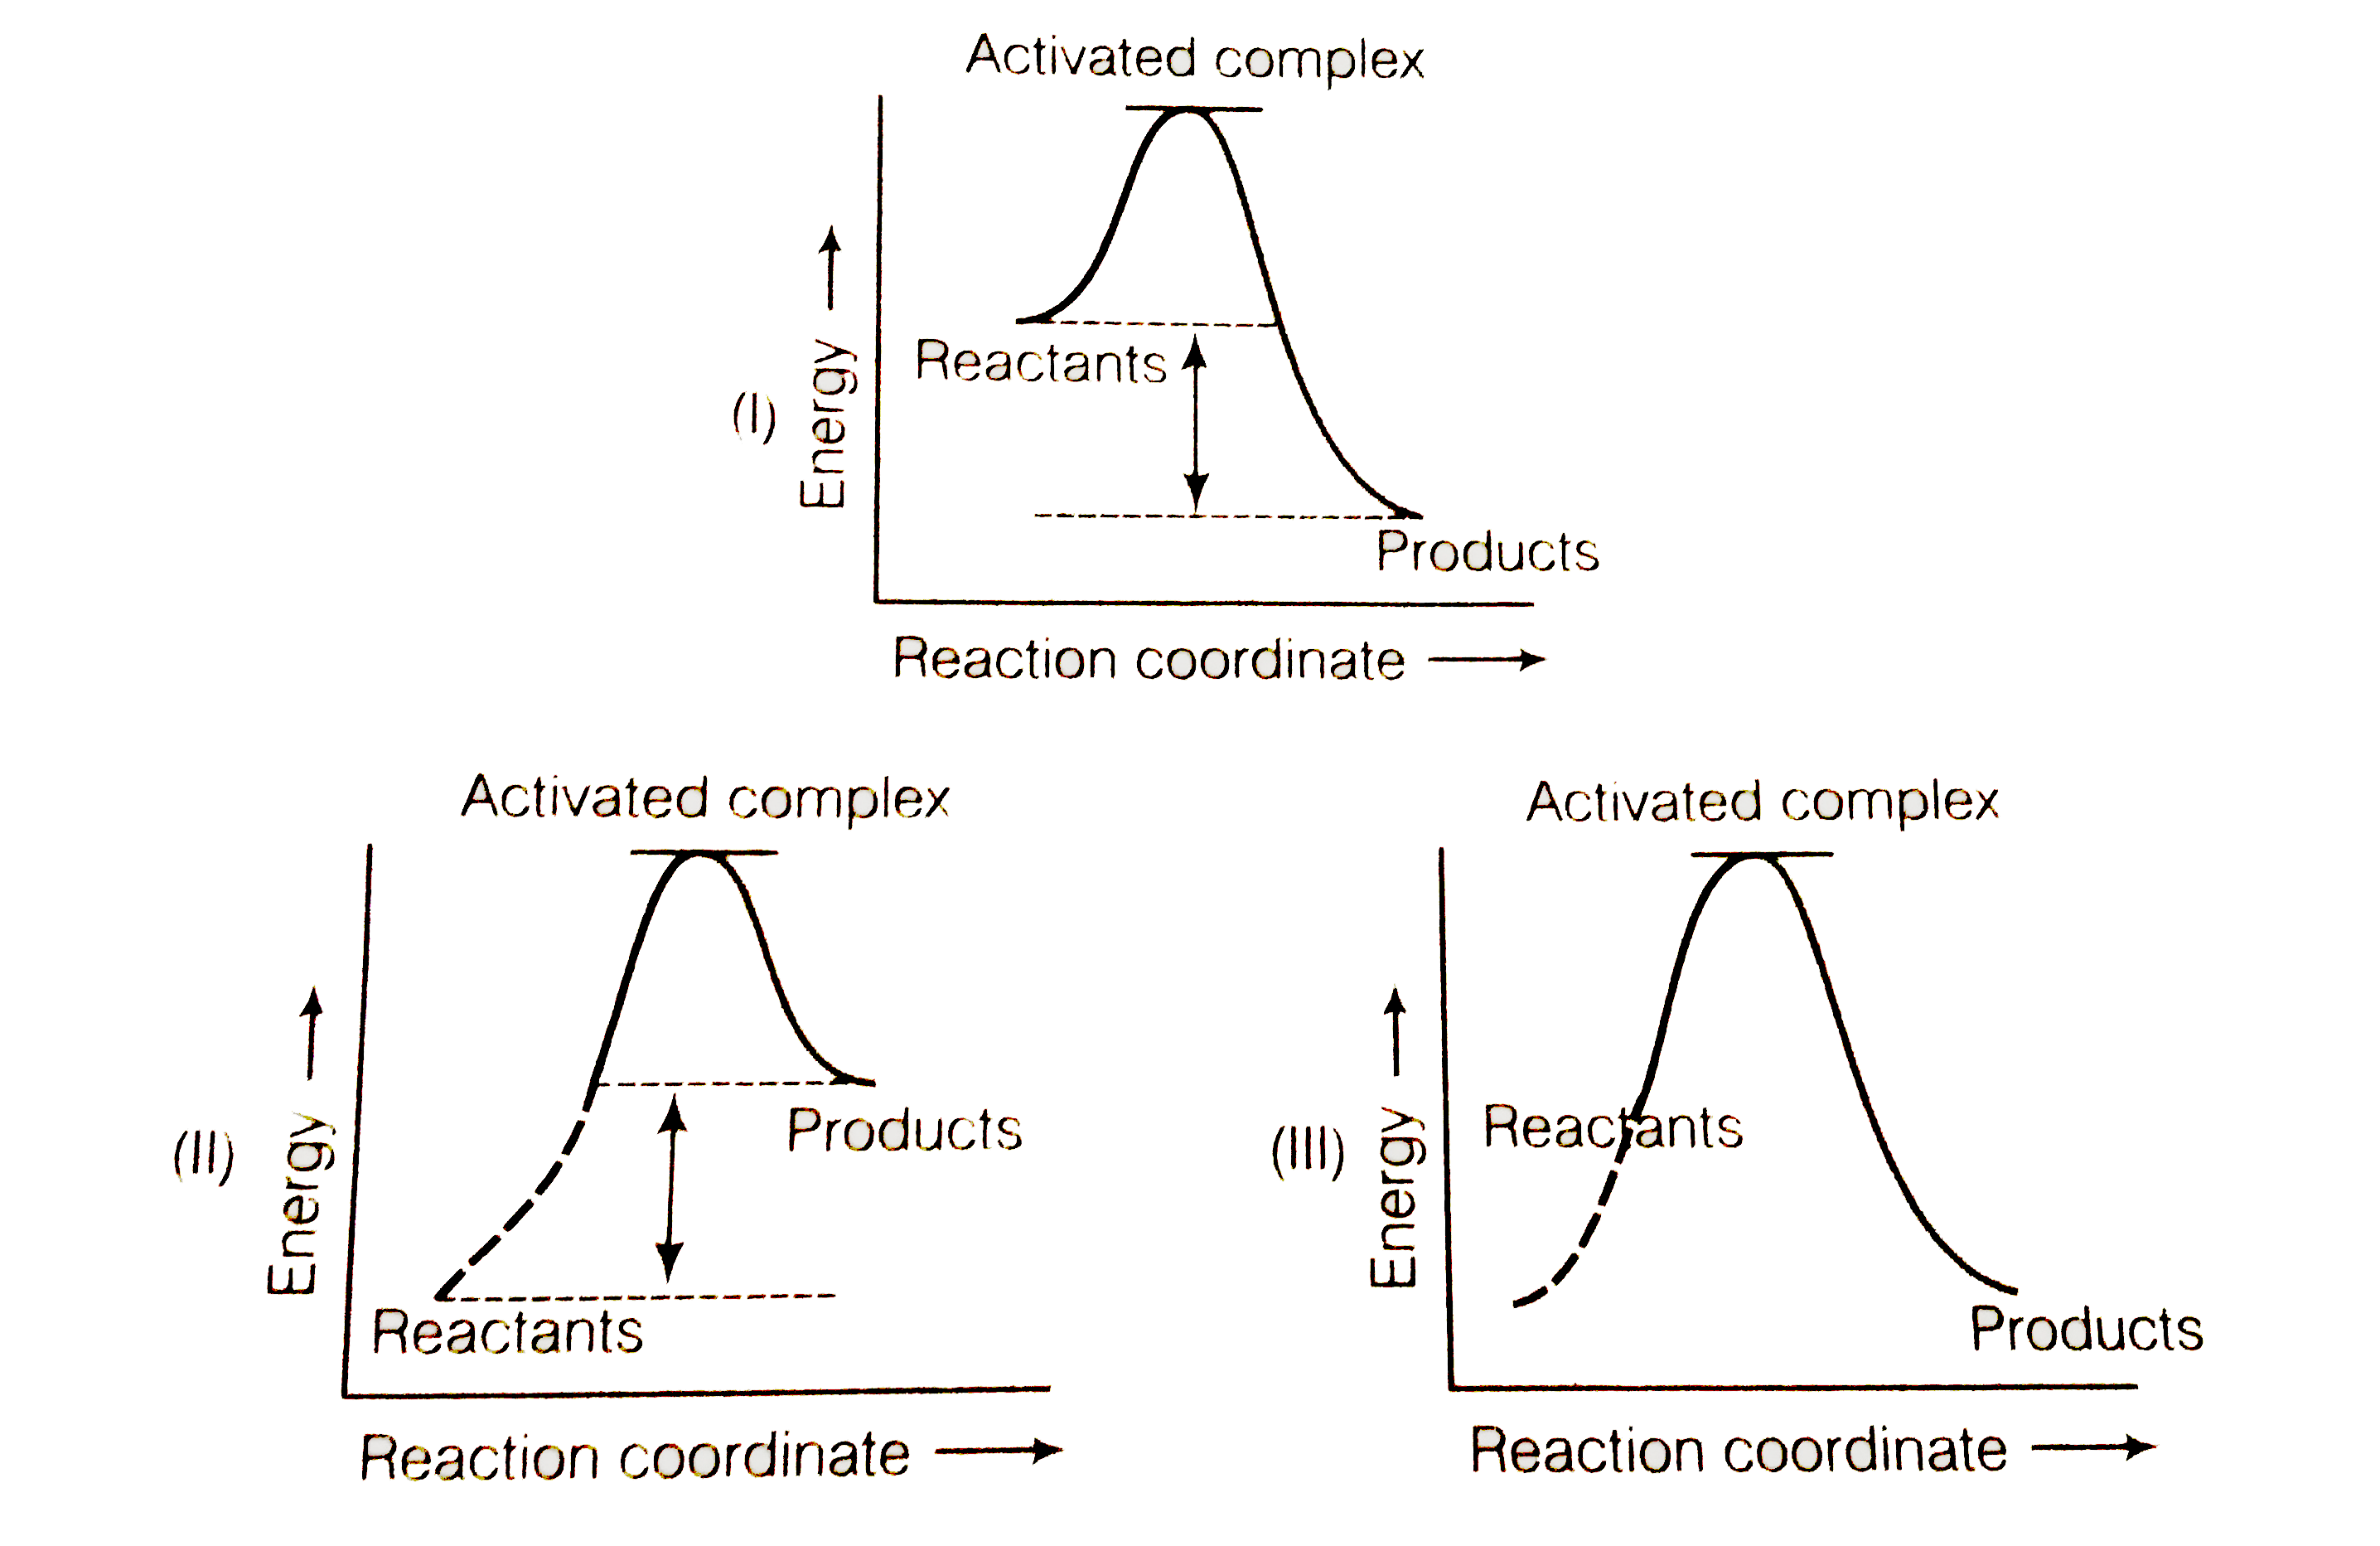
Which of the following graph correctly represent for equilibrium reaction whose Kp>1?
A

B

C

D

Video Solution
Text Solution
The correct Answer is:A
|
Answer
Step by step video, text & image solution for Which of the following graph correctly represent for equilibrium reaction whose K_(p) gt 1? by Chemistry experts to help you in doubts & scoring excellent marks in Class 11 exams.
Updated on:21/07/2023
Topper's Solved these Questions
- BOOK - CENGAGE CHEMISTRYCHAPTER - CHEMICAL EQUILIBRIUMEXERCISE - Concept Applicationexercise 7.153videos
CHEMICAL EQUILIBRIUM
- BOOK - CENGAGE CHEMISTRYCHAPTER - CHEMICAL EQUILIBRIUMEXERCISE - Ex 7.240videos
CHEMICAL EQUILIBRIUM
- BOOK - CENGAGE CHEMISTRYCHAPTER - CHEMICAL BONDING AND MOLECULAR STRUCTUREEXERCISE - Archives Subjective15videos
CHEMICAL BONDING AND MOLECULAR STRUCTURE
- BOOK - CENGAGE CHEMISTRYCHAPTER - CLASSIFICATION AND NOMENCLATURE OF ORGANIC COMPOUNDSEXERCISE - Analytical and Descriptive Type3videos
CLASSIFICATION AND NOMENCLATURE OF ORGANIC COMPOUNDS
Similar Questions
Knowledge Check
- Question 1 - Select One
Which of the following graph is correctly represented?
A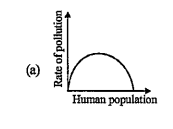 B
B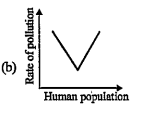 C
C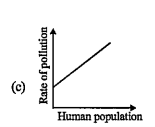 D
D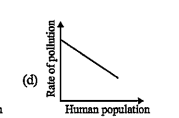
- Question 2 - Select One
Which of the following reactions is correctly represented?
A B
B C
C D
D
- Question 3 - Select One
Which of the following reactions is correctly represented?
A B
B C
C D
D
Which one of the following correctly represents esterification reaction
View SolutionWhich of the following correctly represent/s the units of rate of reaction
View SolutionWhich of the following graph represents exothermic reaction ?
 View Solution
Which of the following graphs represents exothermic reaction?
 View Solution
Which of the following reactions correctly represent the major product(s)?
View Solution

