The following range where the indicator shows change in colour are given
i. ii. iii.
Which of the above range represent titration of
I. Strong acid/strong base ,
II. Weak acid/strong base ,
III. Weak base/strong acid
The correct Answer is:A
Step by step video, text & image solution for The following pH range where the indicator shows change in colour are given i. 4 - 9.7 ii. 7.46-10.0 iii. 6.5-4 Which of the above pH range represent titration of I. Strong acid/strong base (S_(A)//S_(B)), II. Weak acid/strong base (W_(A)//S_(B)), III. Weak base/strong acid (W_(B)//S_(A)) by Chemistry experts to help you in doubts & scoring excellent marks in Class 11 exams.
Topper's Solved these Questions
- BOOK - CENGAGE CHEMISTRYCHAPTER - IONIC EQUILIBRIUMEXERCISE - Ex 8.56videos
IONIC EQUILIBRIUM
- BOOK - CENGAGE CHEMISTRYCHAPTER - IONIC EQUILIBRIUMEXERCISE - Exercises Subjective (Weak Acid And Weak Bases)15videos
IONIC EQUILIBRIUM
- BOOK - CENGAGE CHEMISTRYCHAPTER - IONIC EQUILIBRIUMEXERCISE - Ex 8.338videos
IONIC EQUILIBRIUM
- BOOK - CENGAGE CHEMISTRYCHAPTER - HYDROGEN, WATER AND HYDROGEN PEROXIDEEXERCISE - Subjective Archive (Subjective)3videos
HYDROGEN, WATER AND HYDROGEN PEROXIDE
- BOOK - CENGAGE CHEMISTRYCHAPTER - ISOMERISMEXERCISE - Assertion-Reasoning Type1videos
ISOMERISM
Similar Questions
Knowledge Check
- Question 1 - Select One
Which of the following pH curve represent the titration of weak acid and strong base (dotted line show equivalence point)?
A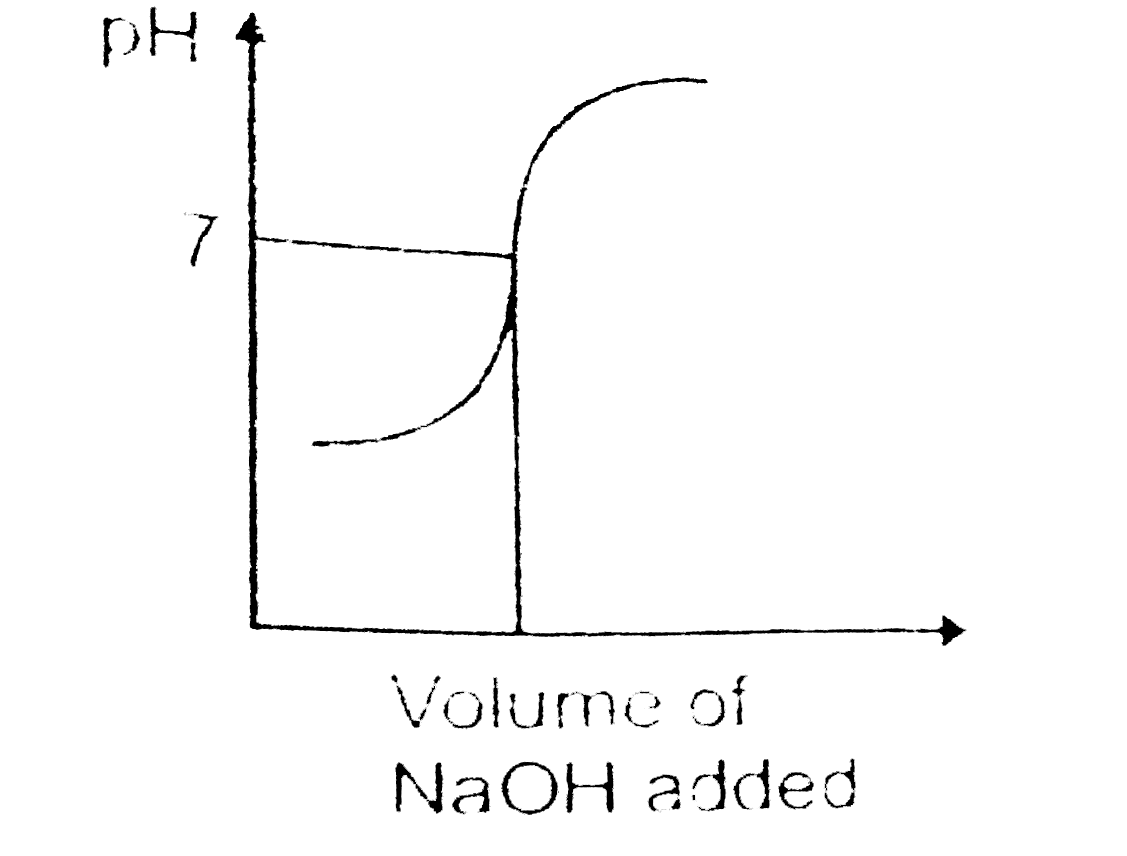 B
B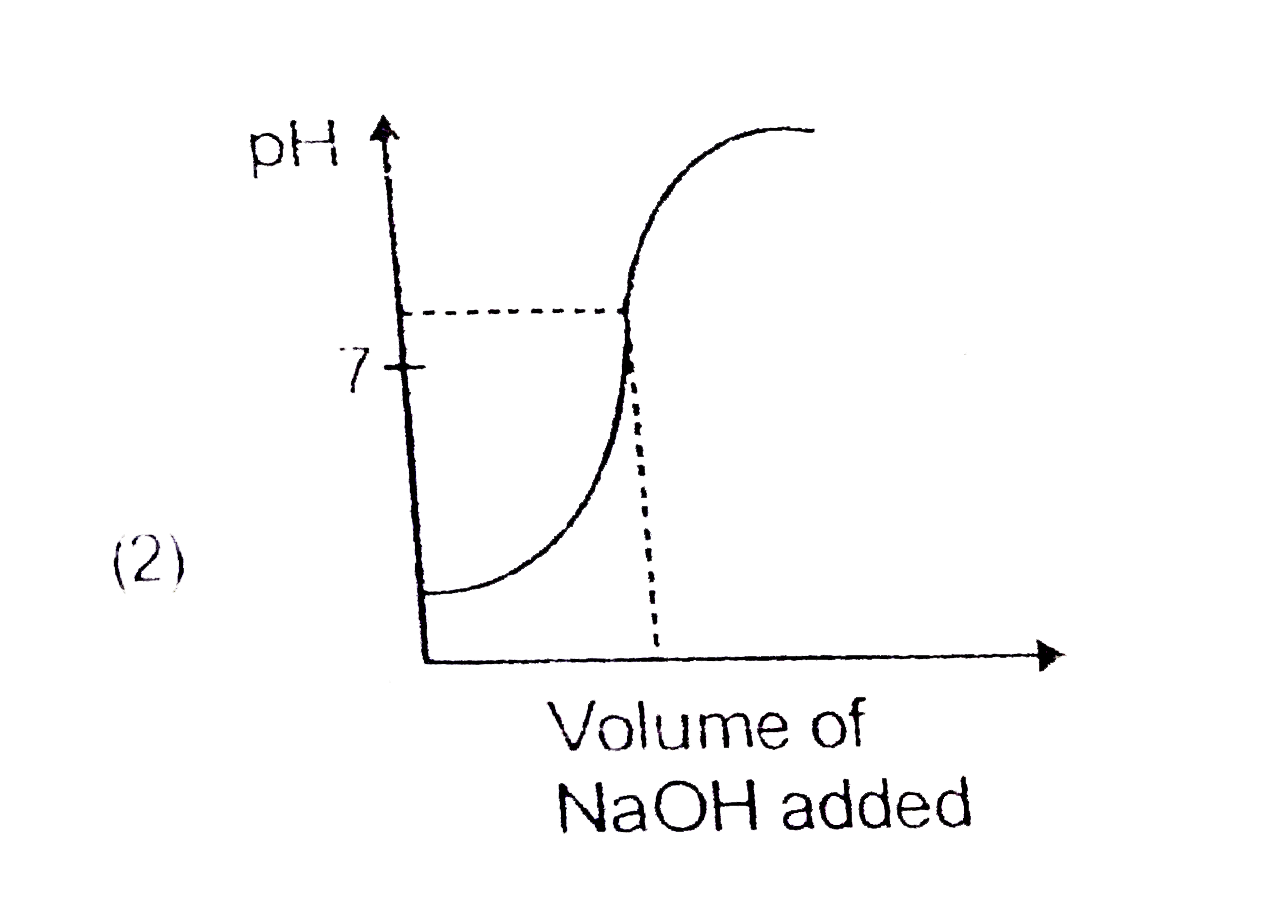 C
C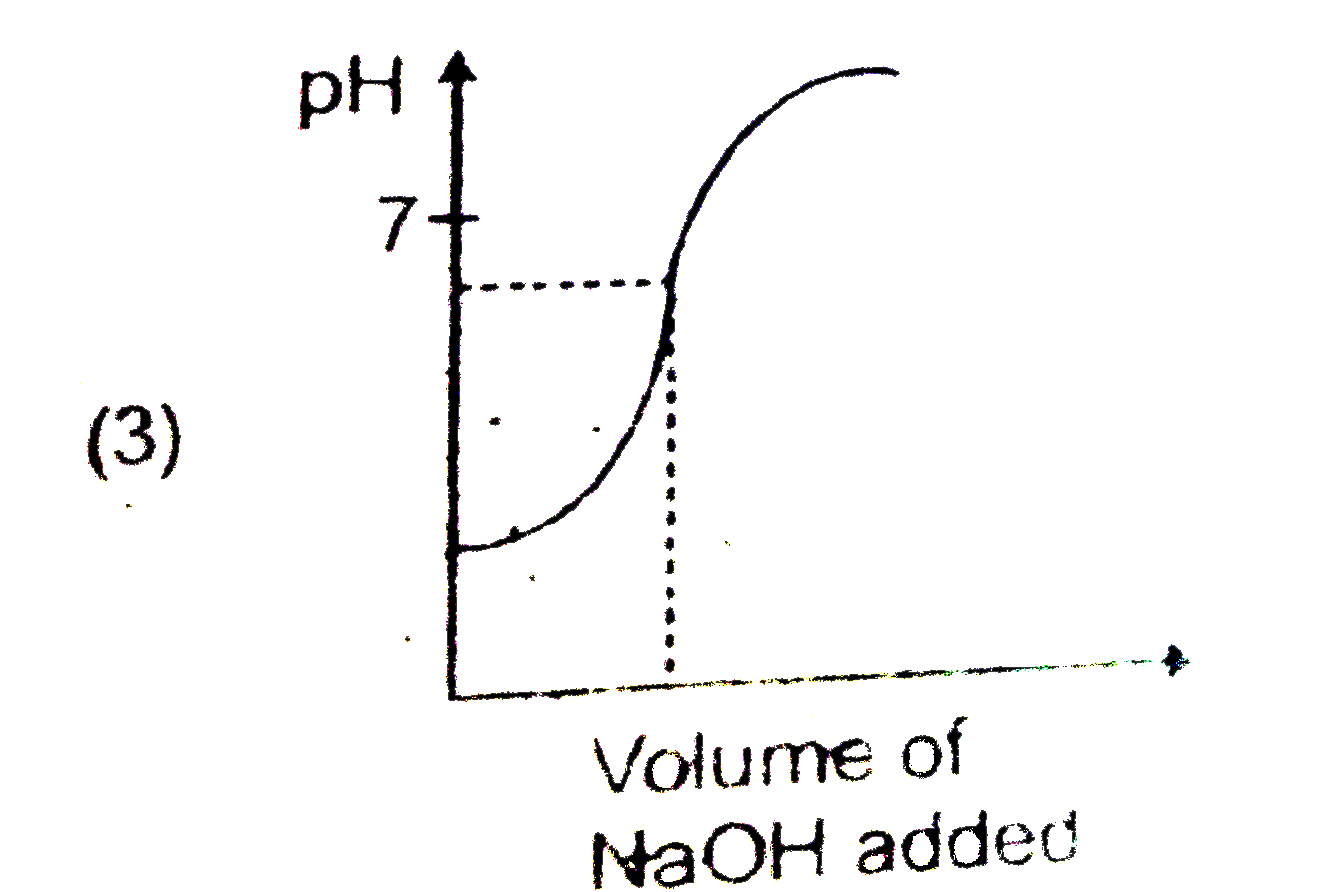 D
D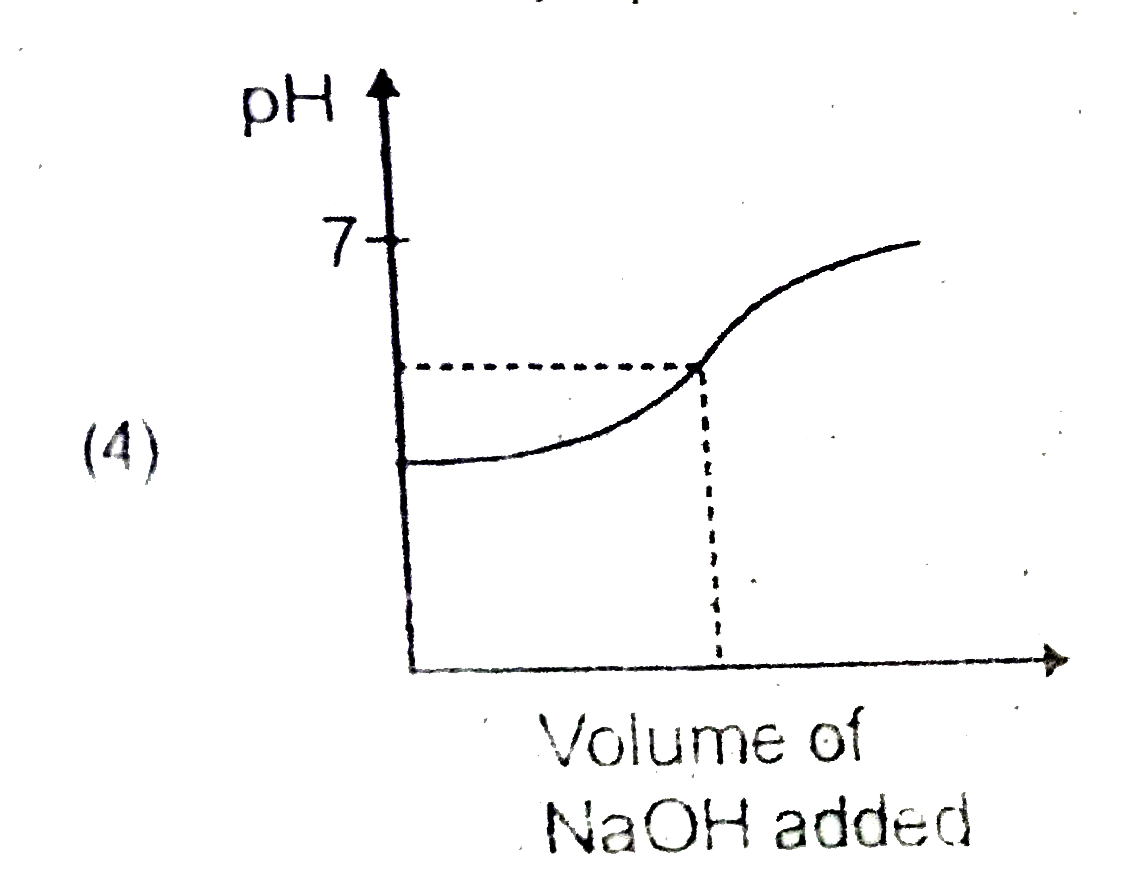
- Question 2 - Select One
Which of the following curves corresponds to the titration of a weak base with a strong acid?
A B
B C
C D
D
- Question 3 - Select One
Which of the following plots will obtained for a conductomeric titration of strong acid against a weak base?
A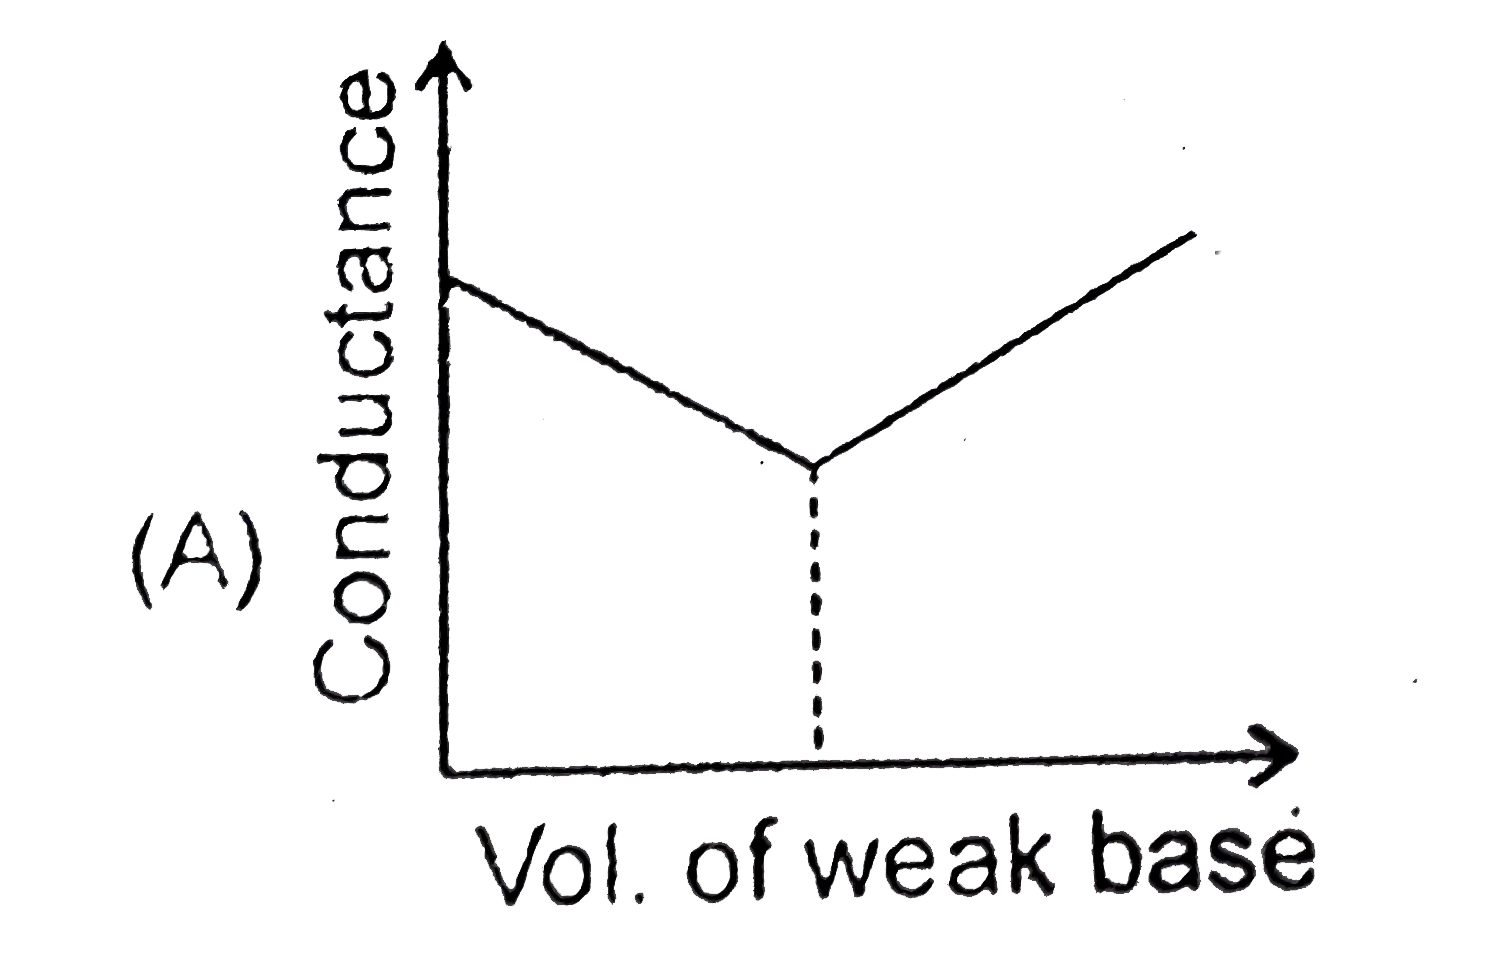 B
B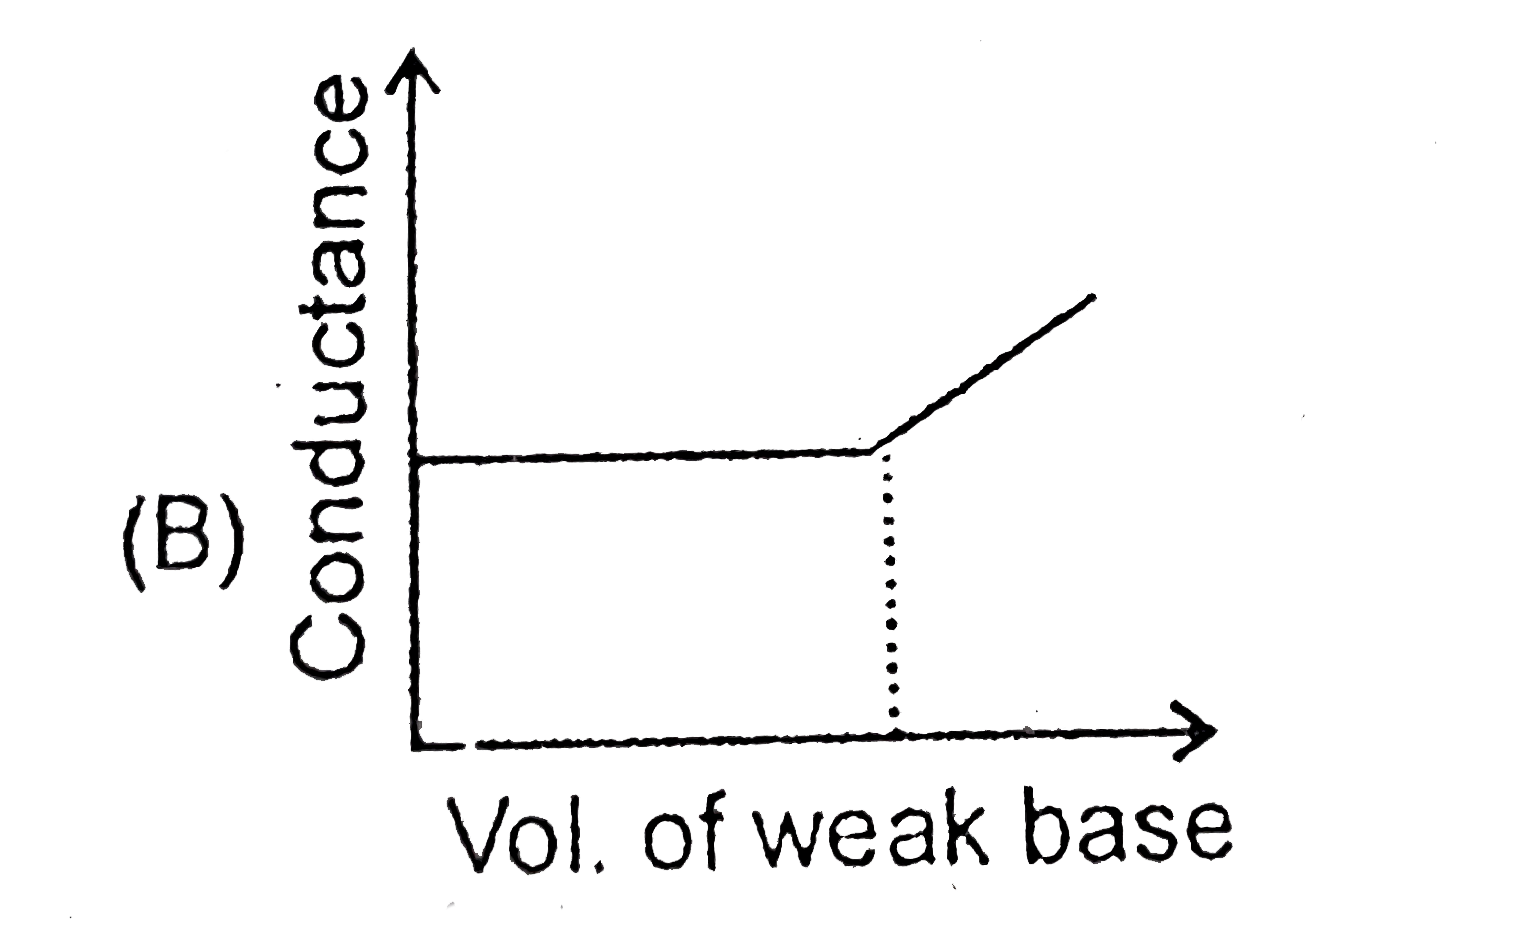 C
C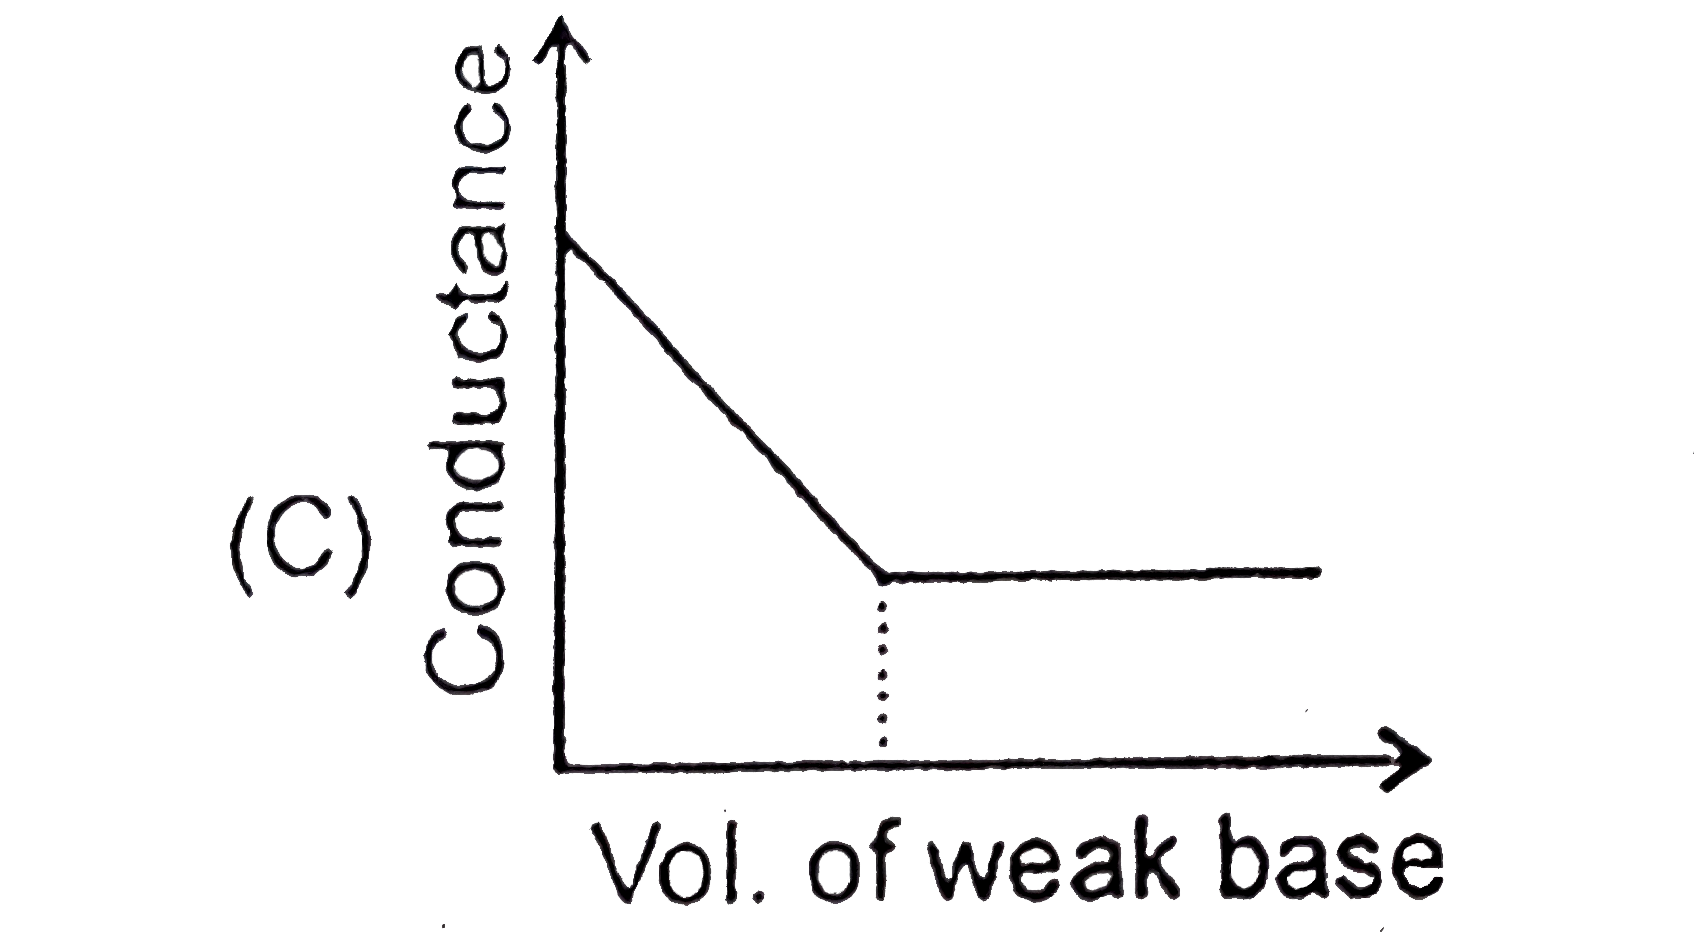 D
D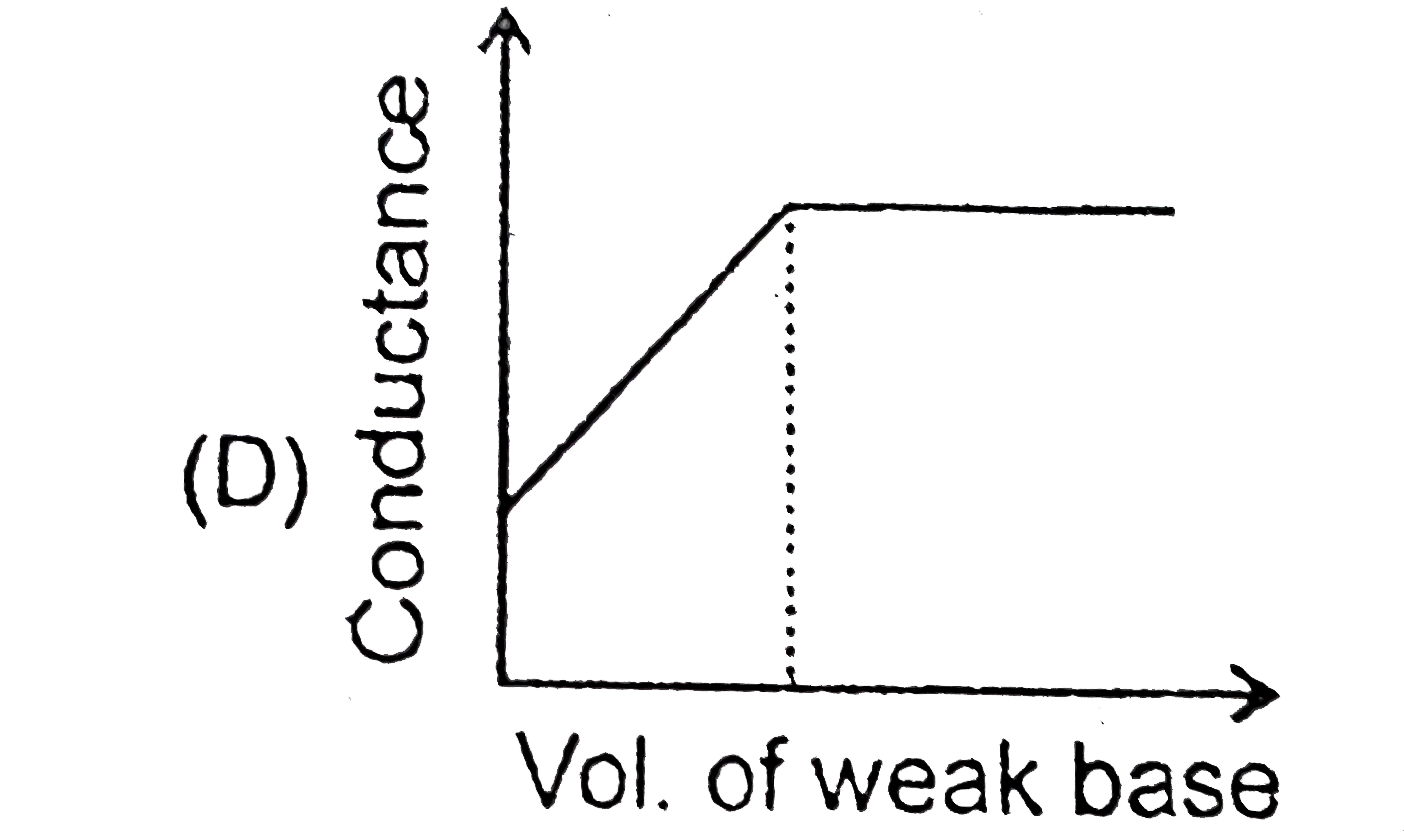
which of the following plots will obtained for a conductometric titration of strong acid against a weak base?
View SolutionWhich of the following statements about a weak acid strong base titration is//are correct?
View SolutionThe following curve shows the change of pH during the course of titration of weak acid HA with a strong base. At which point in the titration curve is the concentration of acid equal to that of its conjugate base.
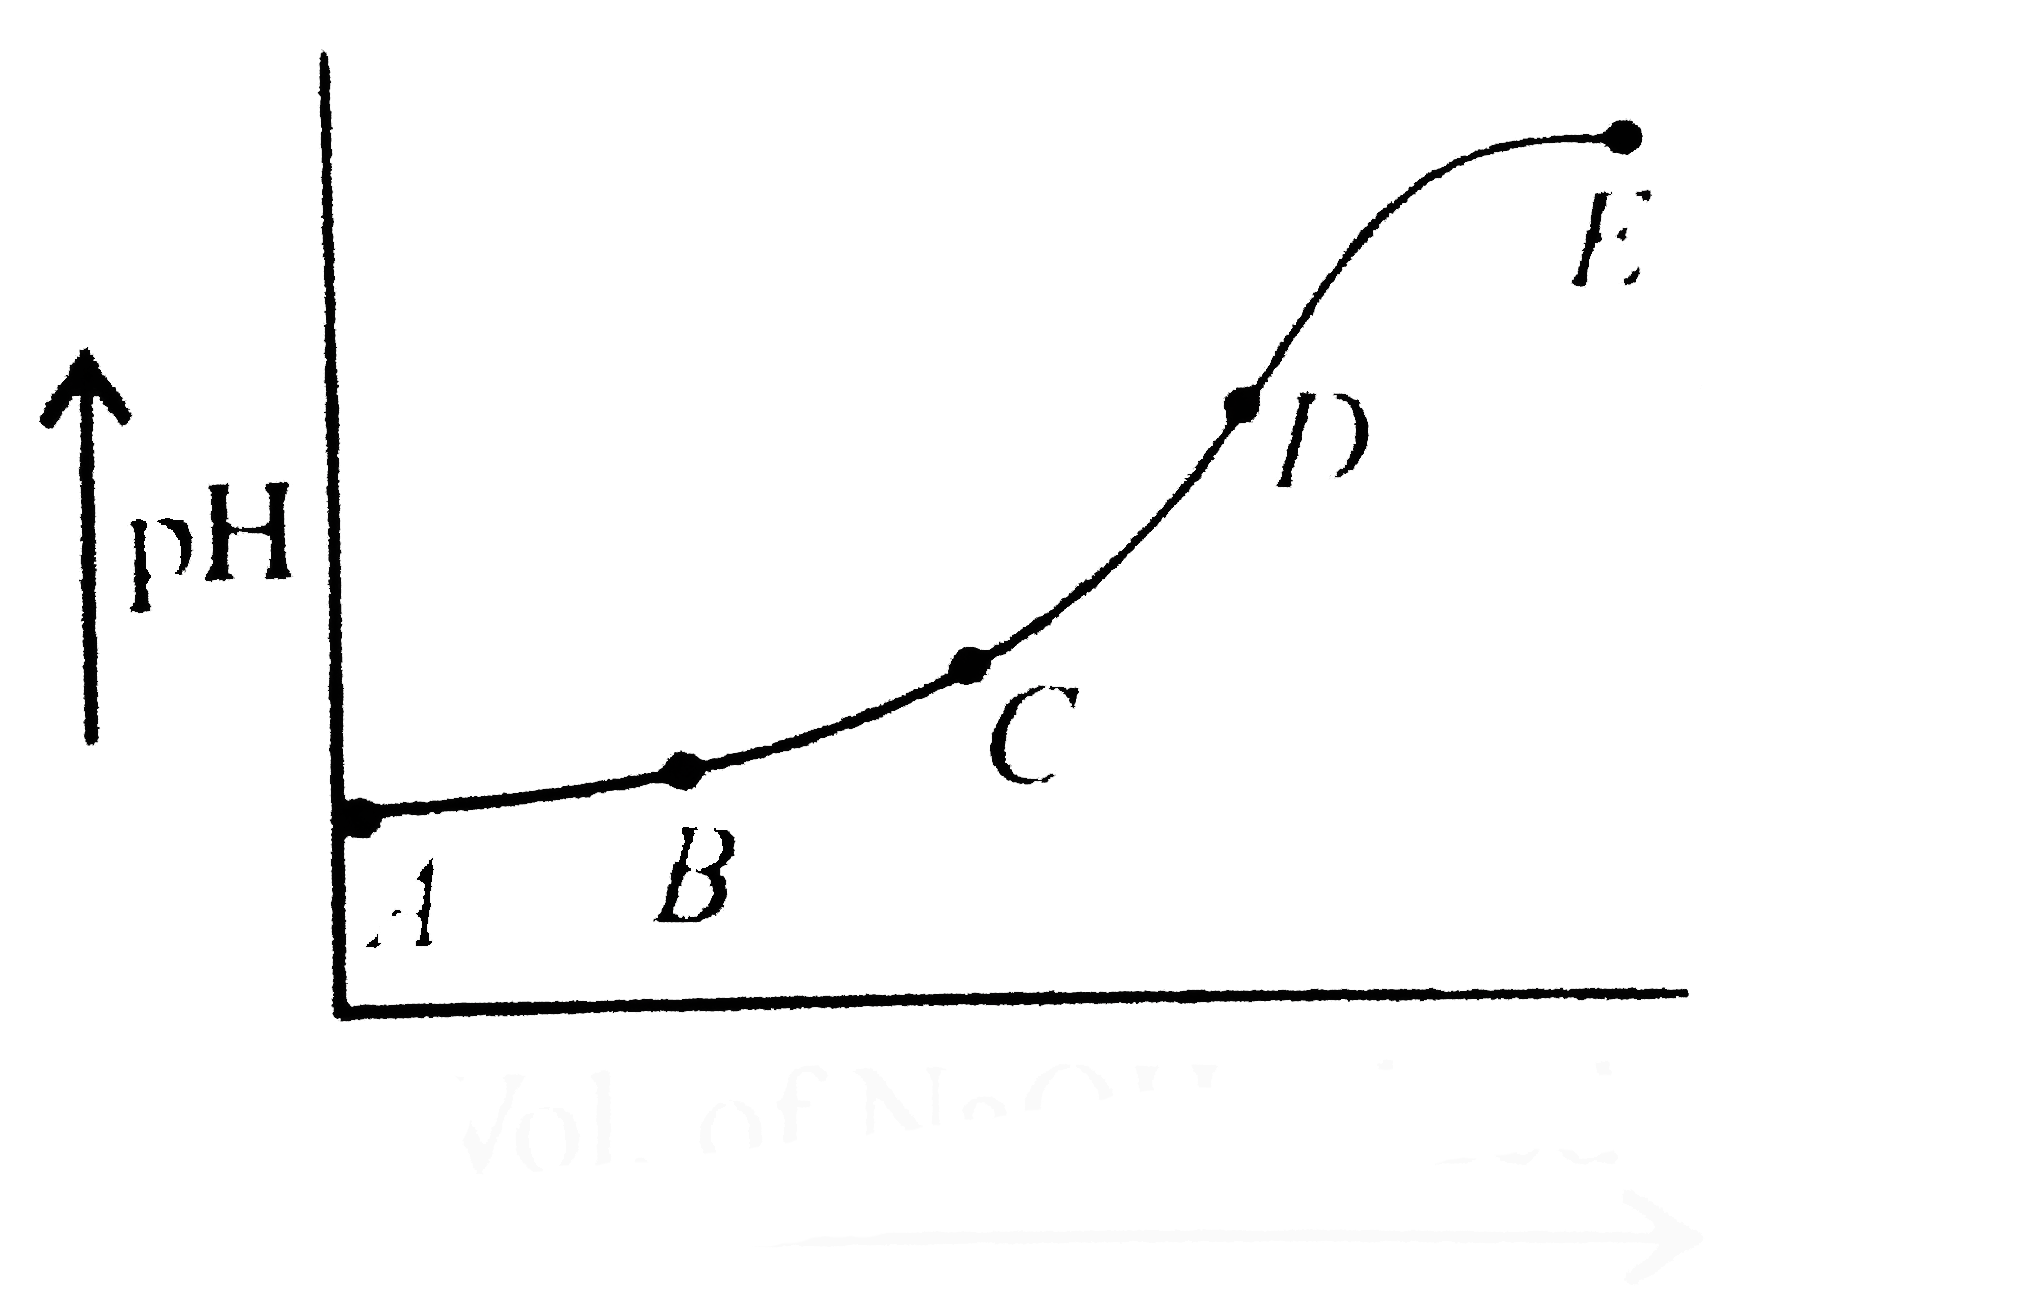 View Solution
The following acid base titration graphs are given:
(I)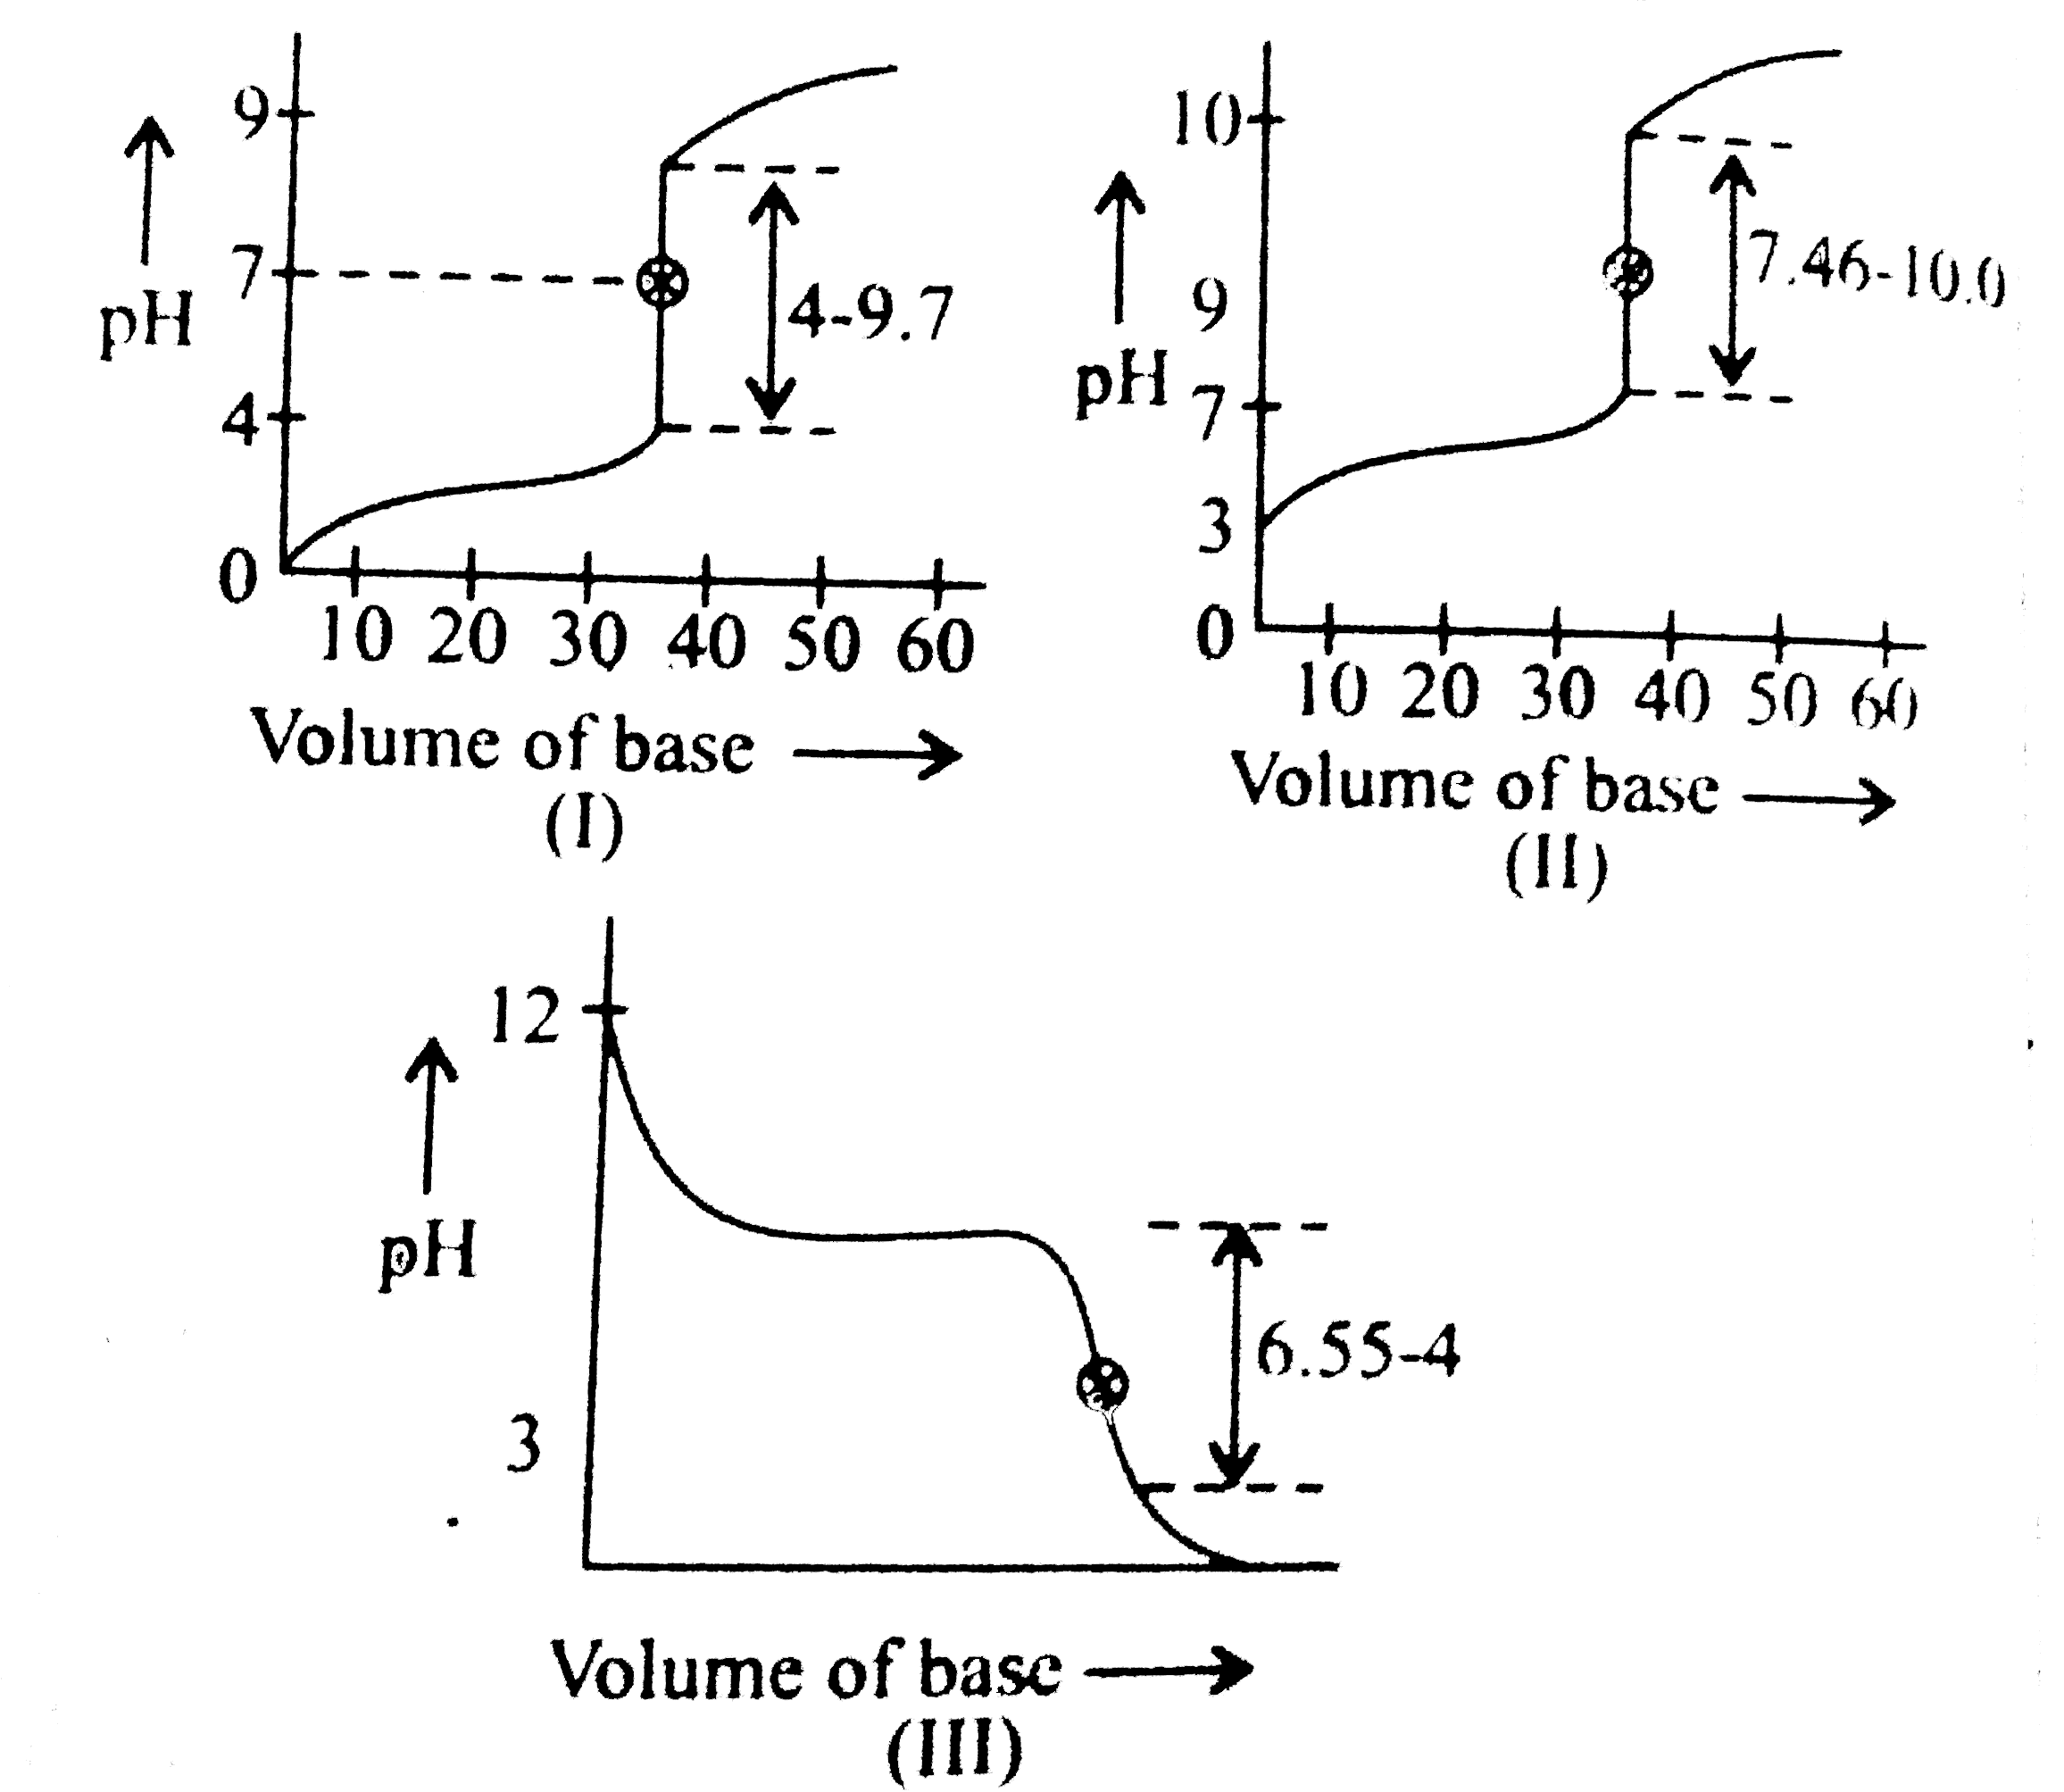
Which of the following graph represents titration of
i. NH4OH/HC1(WA/SA)
ii. HNO3/KOH(SA/SB)
iii. C6H5COOH/KOH(WA/SB)View SolutionIf the equilibrium constant for the reaction of weak acid HA with strong base is 109, then pH of 0.1M Na A is:
View Solution

