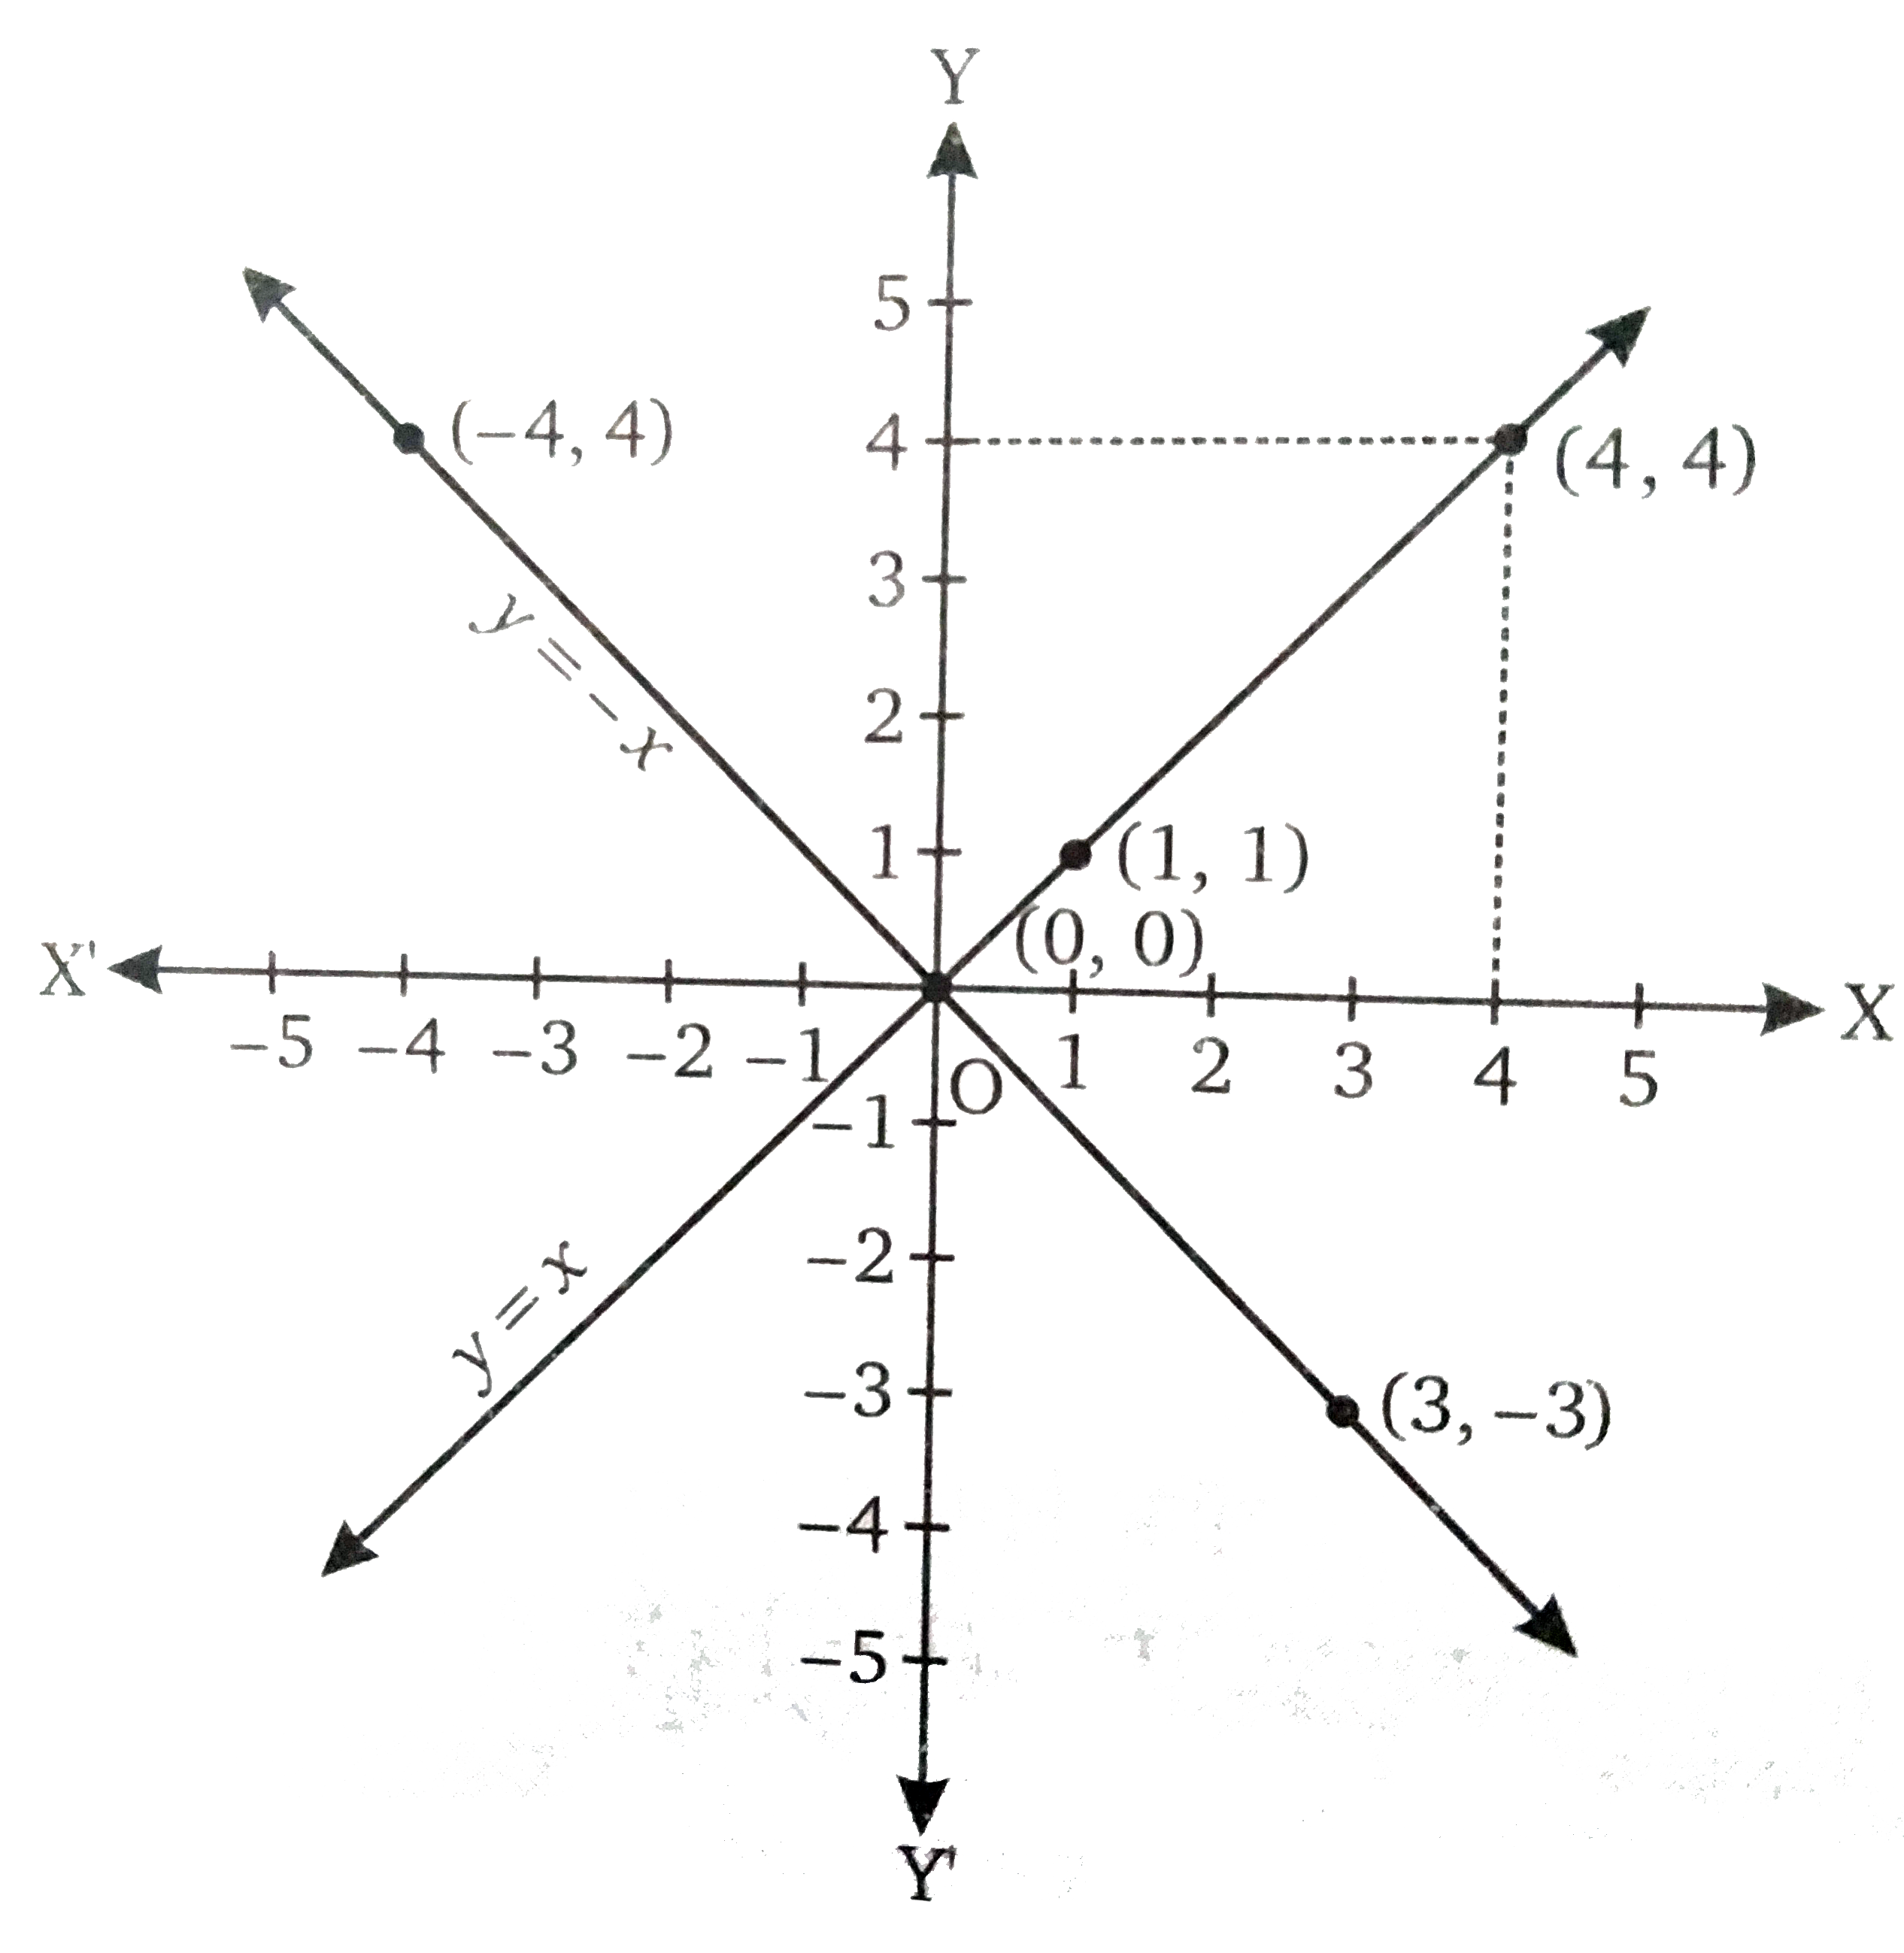
एक ही ग्राफ पर y=x और y=−x का ग्राफ खिचीय तथा उस बिंदु क निदेशक ज्ञात कीजिये जहां दोनों रेखाये प्रतिछडेड करती है |

(i) y=x का ग्राफ

(ii) y=−x का ग्राफ

अब बिंदुओं (1,1) और (4,4) को ग्राफ पेपर पर अंकित करें तथा इनके मिला दे तब हमें एक रेखा प्राप्त होती है जो y=x का ग्राफ है इस प्रकार बिन्दुओ (3,−4) को अकिंत करें तथा एक रेखा द्वारा इन्हें मिला दे यही y−x का एक ग्राफ है जो मिमं ग्राफ में दर्शाये गये है | इन रेखाओ का प्रतिच्छेद बिंदु (0,0) है |

Topper's Solved these Questions
- दो चरो के रैखिक समीकरण BOOK - BALAJI PUBLICATIONCHAPTER - दो चरो के रैखिक समीकरण EXERCISE - अभ्यास प्रश्न 7.1
30 Videos
- दो चरो के रैखिक समीकरण BOOK - BALAJI PUBLICATIONCHAPTER - दो चरो के रैखिक समीकरण EXERCISE - स्वमूल्यांकन परीक्षण
18 Videos
- त्रिभुजों की सर्वांगसमता BOOK - BALAJI PUBLICATIONCHAPTER - त्रिभुजों की सर्वांगसमता EXERCISE - स्वमूल्यांकन परीक्षण
15 Videos
- निर्देशांक ज्यामिति BOOK - BALAJI PUBLICATIONCHAPTER - निर्देशांक ज्यामिति EXERCISE - स्वमूल्यांकन परीक्षण
10 Videos
Similar Questions
एक समीकरण का ग्राफ खीचिए यदि,
(i) x=0,y=4 समीकरण का एक हल है |
(ii) x=1,y=5 समीकरण का एक हल है|
(iii) (−4,−4) संकरण के ग्राफ पर स्थिर है |
(iv) रेखा (y−2x=4) और अक्षों के निर्देशांक के द्वारा निर्मित त्रिभुज का क्षेत्रफल
View Solutionएक पुस्तक का मूल्य, एक पैन के मूल्य से दो गुना है | इसे व्यक्त करने के लिए दो चरो का रैखिक समीकरण लिखिये |
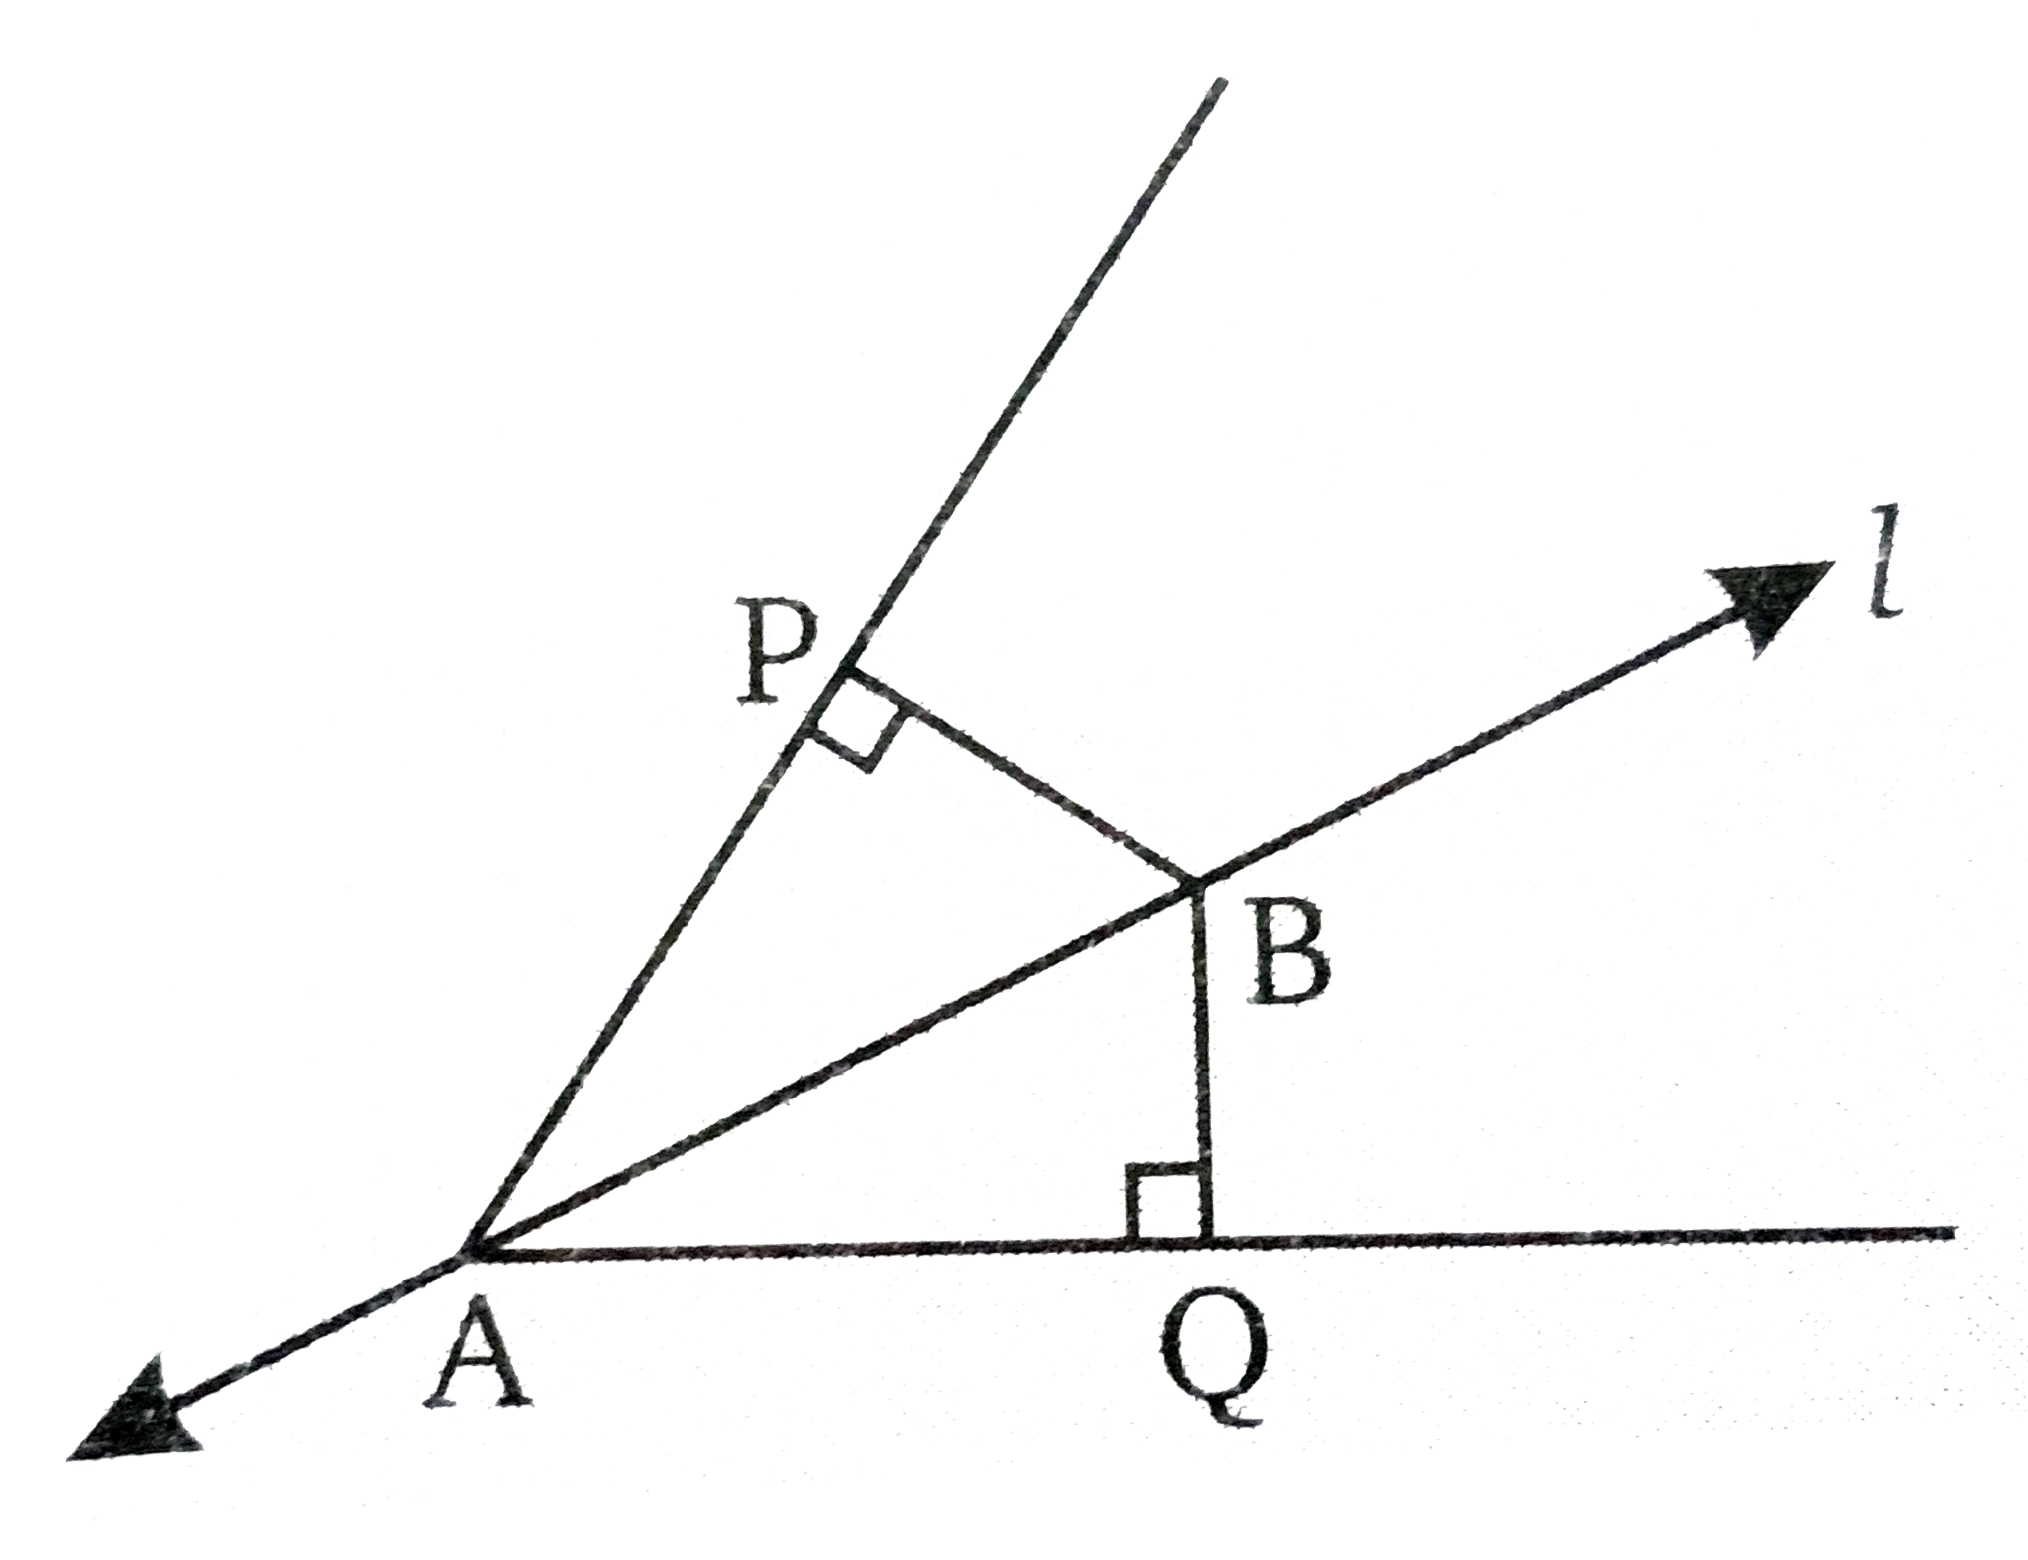
View Solutionरेखा l कोण A की समद्विभाजक है तथा l पर कोई बिंदु B है| BP और BQ बिंदु B से ∠Aकी भुजाओं पर लम्ब है तो दिखाइये कि-

(i) ΔAPB≅ΔAQB
(ii) BP=BQ
View Solutionनिम्न बिंदुओं को ग्राफ पेपर पर अंकित करें ।
(i) (3,5) (ii)(−3,4) (iii)(−3,−4)
View SolutionHow many lines of symmetry does the above figure have ?
View SolutionWhich of the following are correct chain isomers of butane ? (i)
View SolutionDetermine the point of symmetry of a regular hexagon.
View SolutionComplete adjectant figure so that X-axis and Y-axis are the lines of symmetry of the completed figure.
View SolutionDtermine the images of the following figure about the given line :
View SolutionMatch the following Column A to Column B

View SolutionMatch the following Column A to Column B

View SolutionMatch the following Column A to Column B

View SolutionThe inequation represented by the graph given below is :
View SolutionThe inequation that best describes the graph given below is _________
View SolutionThe inequation that best describes the following graph is _________
View SolutionWhich inequations represent the shaded region in the given figure
View Solution
