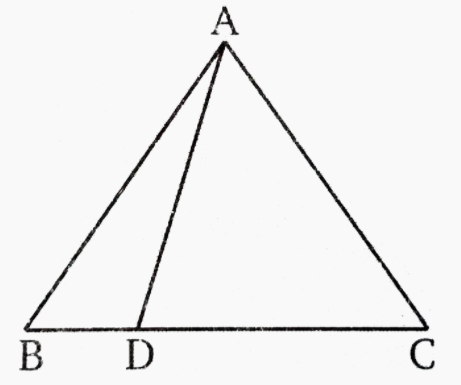
संलग्न चित्र में , AB>AC निम्न में से कौन- सा एक सत्य है ?

AB>AD
AB<AD
AB=AD
इनमें से कोई नहीं
The correct Answer is:A
Step by step video & image solution for संलग्न चित्र में , AB gt AC निम्न में से कौन- सा एक सत्य है ? by Maths experts to help you in doubts & scoring excellent marks in Class 9 exams.
Updated on:21/07/2023Topper's Solved these Questions
- त्रिभुजों की सर्वांगसमता BOOK - BALAJI PUBLICATIONCHAPTER - त्रिभुजों की सर्वांगसमता EXERCISE - स्वमूल्यांकन परीक्षण
15 Videos
- त्रिभुजों की सर्वांगसमता BOOK - BALAJI PUBLICATIONCHAPTER - त्रिभुजों की सर्वांगसमता EXERCISE - विविध प्रश्नावली (प्रकार - 1 अतिलघु उत्तरीय प्रश्न)
39 Videos
- त्रिभुज एवं उसके गुण BOOK - BALAJI PUBLICATIONCHAPTER - त्रिभुज एवं उसके गुण EXERCISE - स्वमूल्यांकन परिक्षण ( Self Assessment Test)
13 Videos
- दो चरो के रैखिक समीकरण BOOK - BALAJI PUBLICATIONCHAPTER - दो चरो के रैखिक समीकरण EXERCISE - स्वमूल्यांकन परीक्षण
18 Videos
Similar Questions
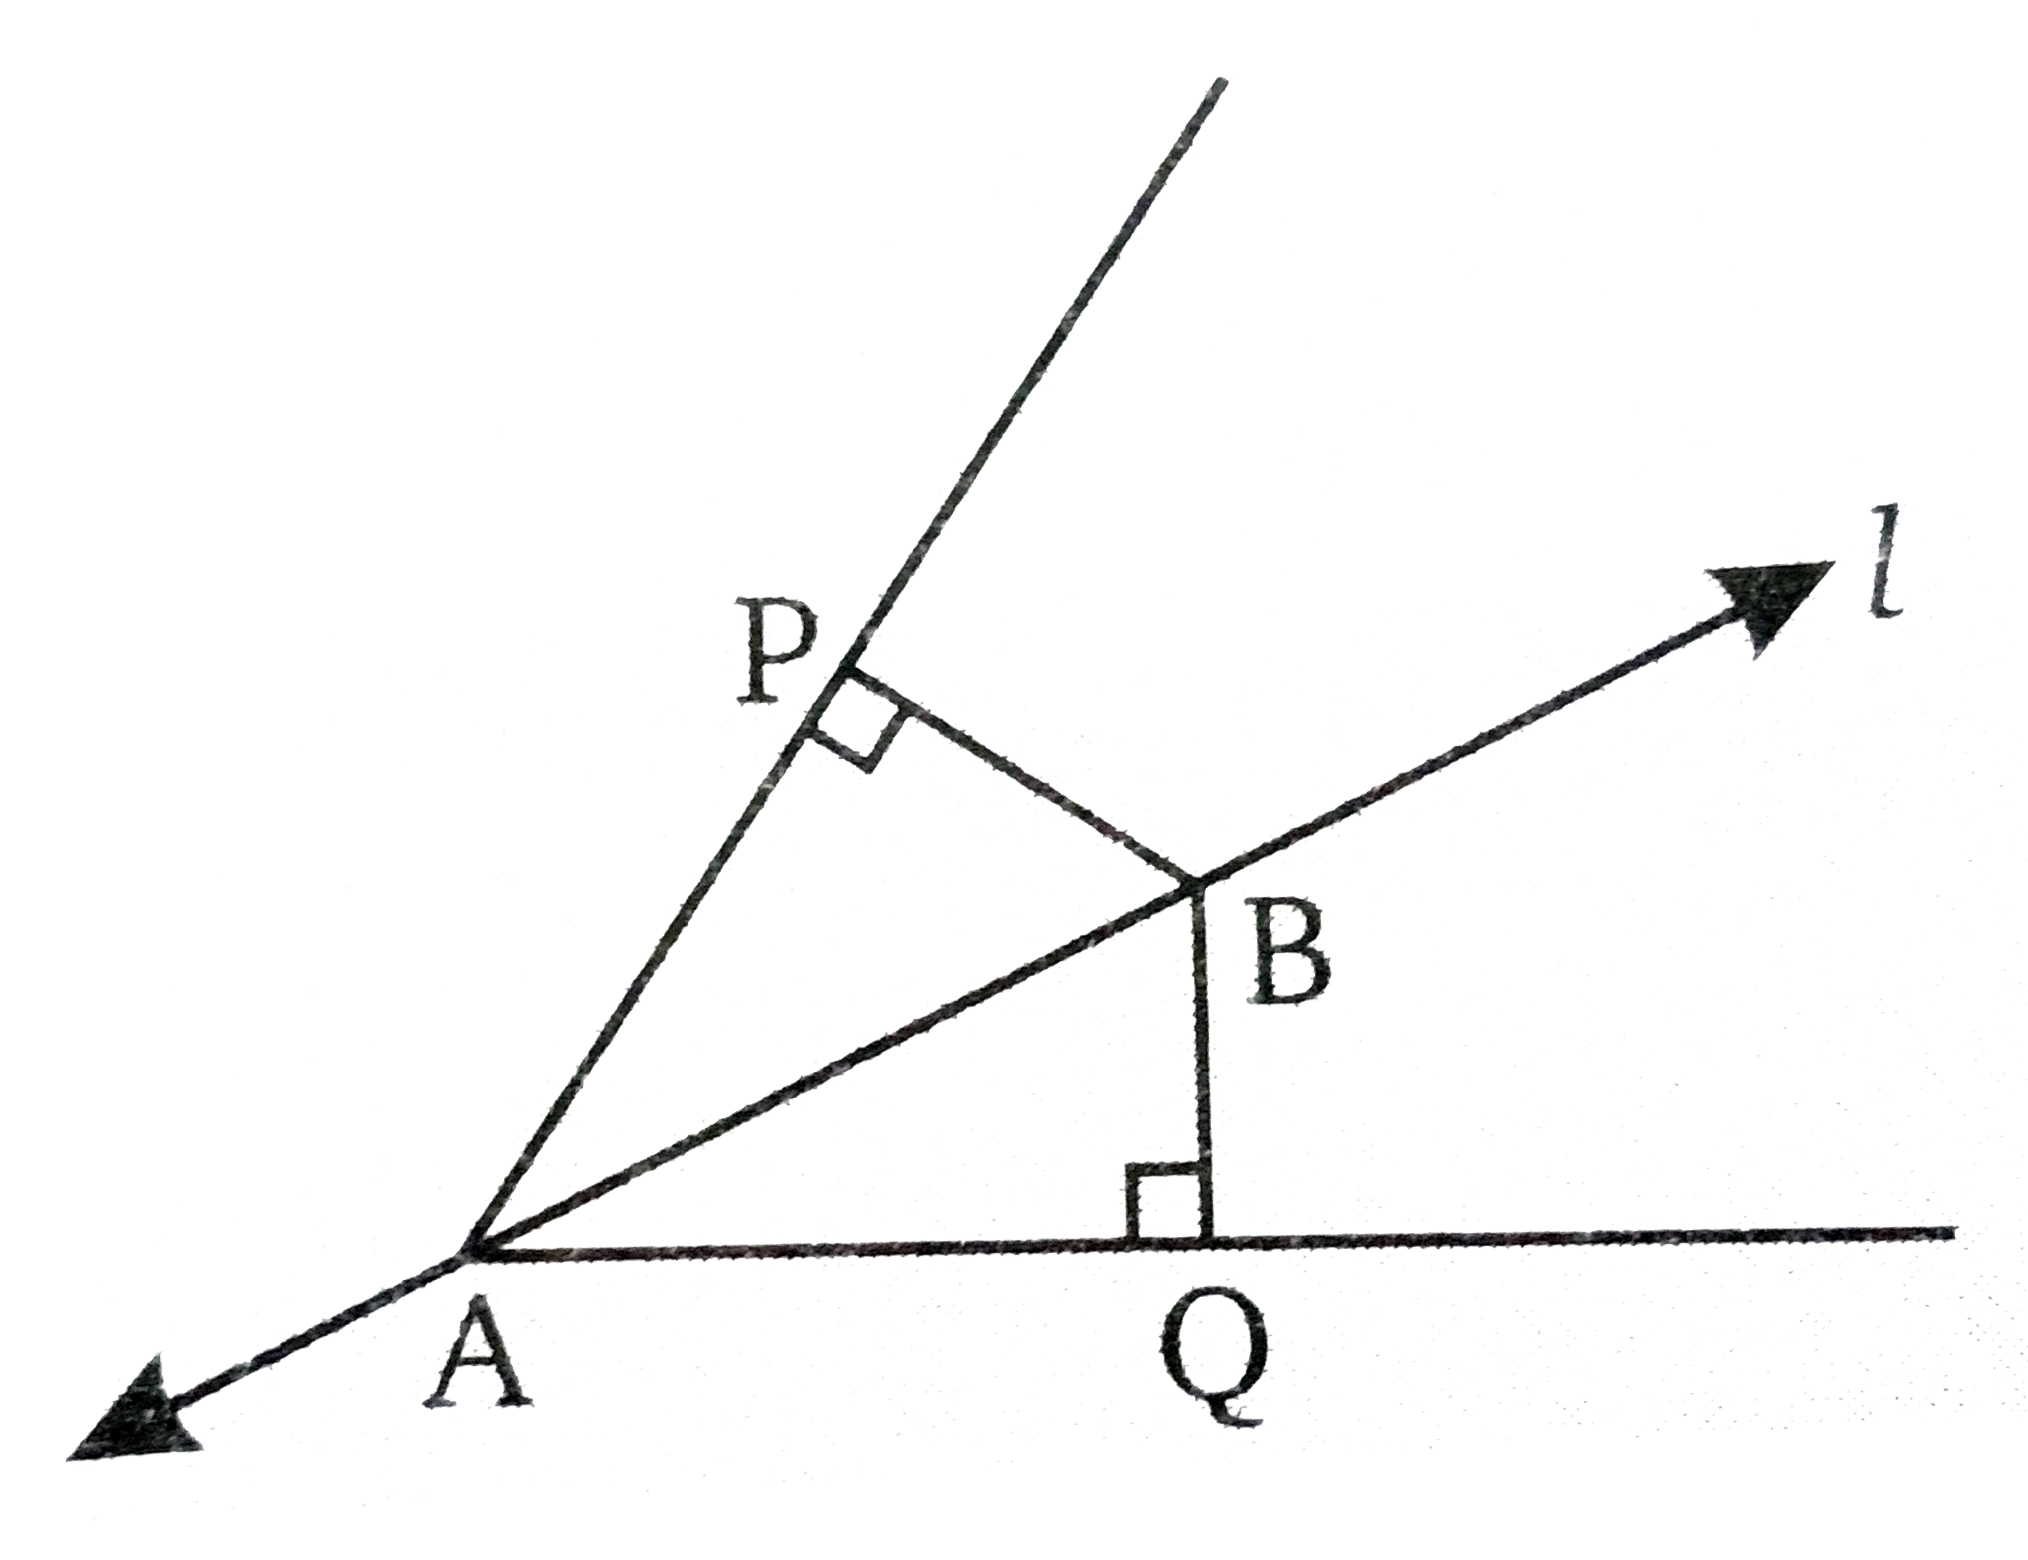
रेखा l कोण A की समद्विभाजक है तथा l पर कोई बिंदु B है| BP और BQ बिंदु B से ∠Aकी भुजाओं पर लम्ब है तो दिखाइये कि-

(i) ΔAPB≅ΔAQB
(ii) BP=BQ
View SolutionΔABCतथा ΔPQRमें ,AB = PR तथा ∠A=∠P तब SAS कथन द्वारा प्रतिबंध ज्ञात कीजिए कि दोनों त्रिभुज सर्वांगसम होंगे
View Solutionयदि एक त्रिभुज का एक कोण, अन्य दो के योग के बराबर है तब सिद्ध कीजिए की त्रिभुज एक समकोण त्रिभुज है।
View Solutionएक पुस्तक का मूल्य, एक पैन के मूल्य से दो गुना है | इसे व्यक्त करने के लिए दो चरो का रैखिक समीकरण लिखिये |
View SolutionHow many lines of symmetry does the above figure have ?
View SolutionWhich of the following are correct chain isomers of butane ? (i)
View SolutionDetermine the point of symmetry of a regular hexagon.
View SolutionDtermine the images of the following figure about the given line :
View SolutionIn the figure above (not to scale), ¯¯¯¯¯¯AB⊥¯¯¯¯¯¯CDandAD is the bisector of ∠BAE.AB=3cm and AC=5cm. Find CD.
View SolutionMatch the following Column A to Column B

View SolutionMatch the following Column A to Column B

View SolutionMatch the following Column A to Column B

View SolutionThe inequation represented by the graph given below is :
View SolutionThe inequation that best describes the graph given below is _________
View SolutionThe inequation that best describes the following graph is _________
View SolutionWhich inequations represent the shaded region in the given figure
View Solution
