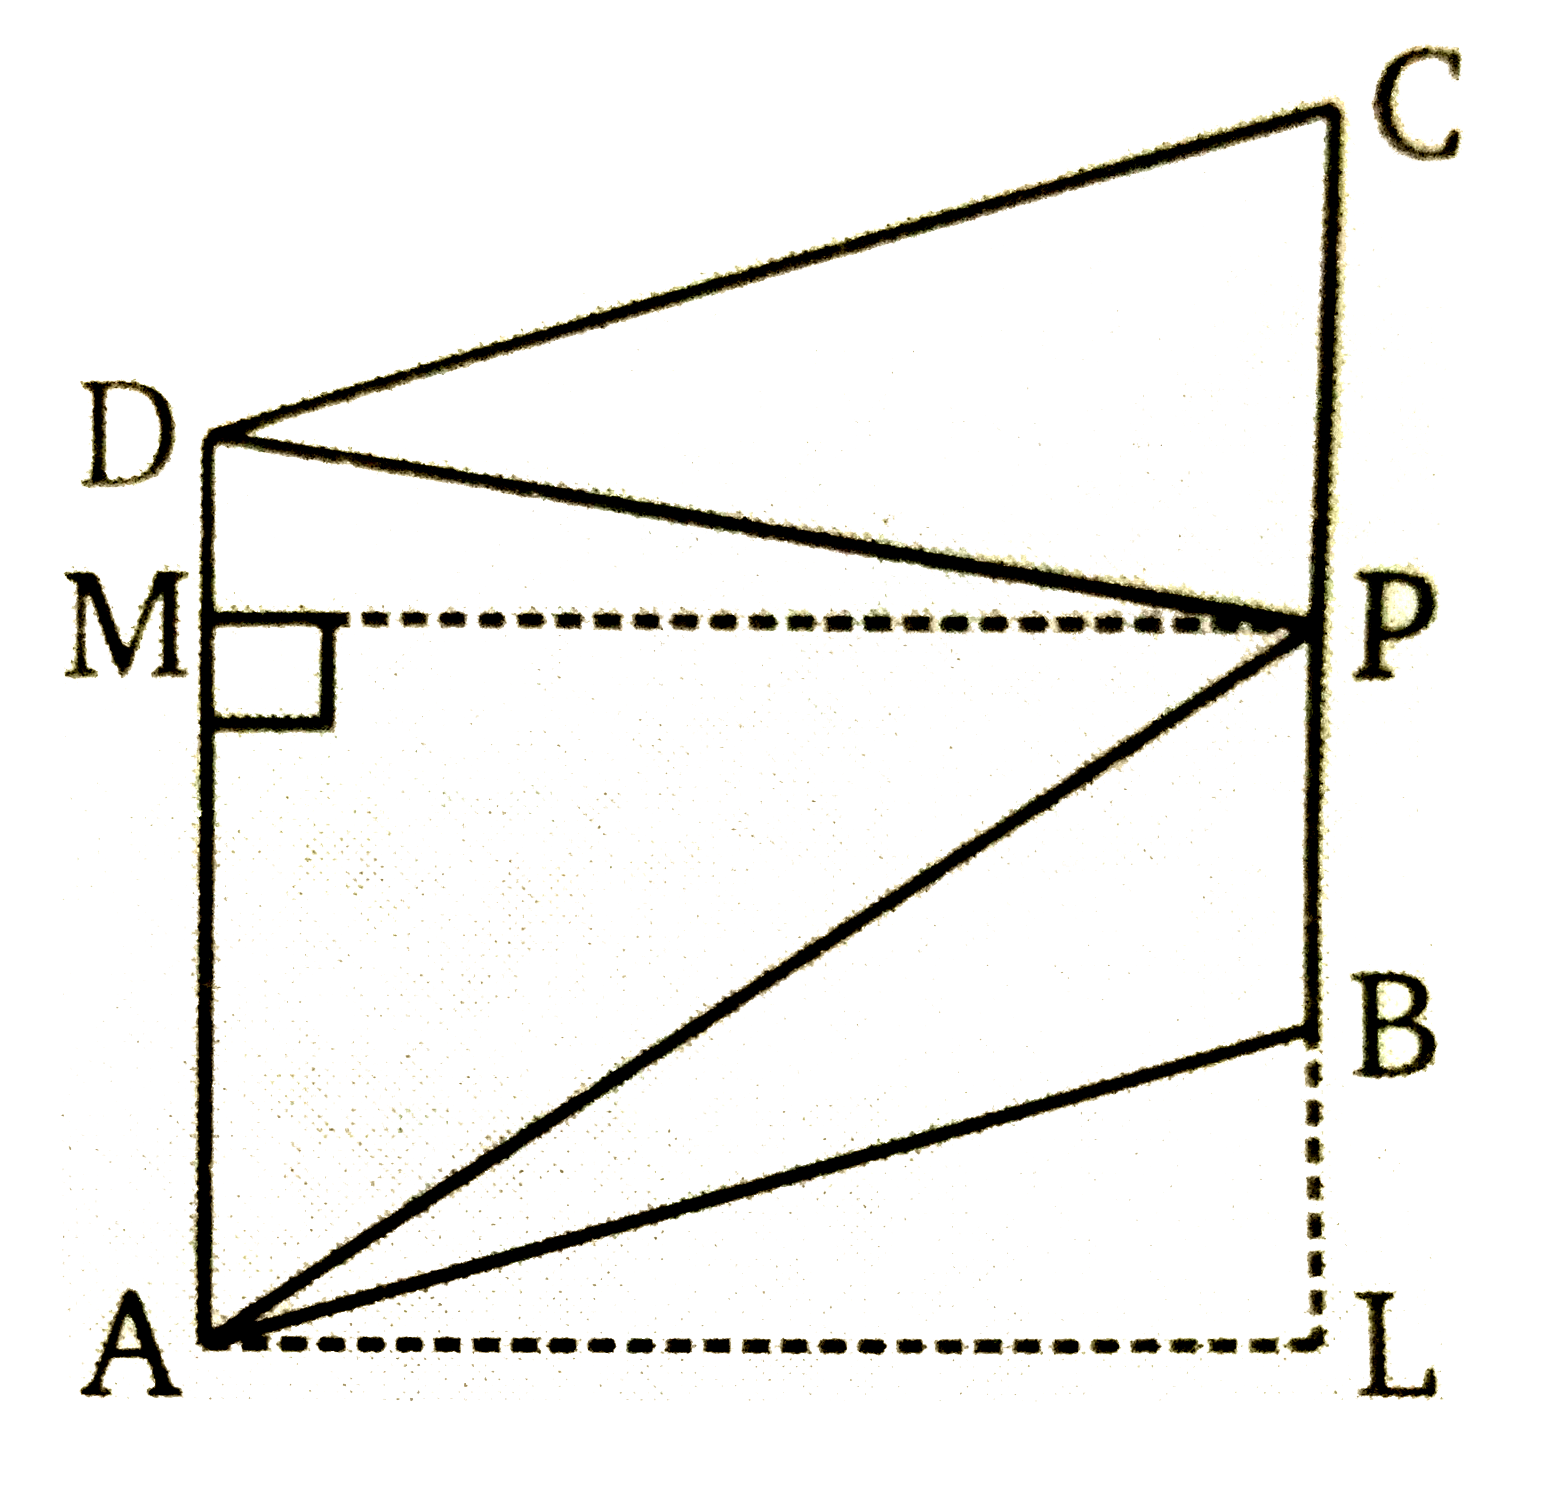
संलग्न चित्र में एक समांतर चतुर्भुज ABCD है तथा BC पर कोई बिंदु है तो सिद्ध कीजिए कि:
का क्षे0 का क्षे0 का क्षे0

चित्र में दिखाये अनुसार तथा खींची।
अब चूंकि इसलिए इनके बीच की दूरी भी समान हैं।
इसलिए
अब का क्षे0 का क्षे0
का क्षे0 तथा
Topper's Solved these Questions
- BOOK - BALAJI PUBLICATIONCHAPTER - समांतर चतुर्भुज व त्रिभुज के क्षेत्रफलEXERCISE - अति लघु उत्तरीय प्रश्न5videos
समांतर चतुर्भुज व त्रिभुज के क्षेत्रफल
- BOOK - BALAJI PUBLICATIONCHAPTER - समांतर चतुर्भुज व त्रिभुज के क्षेत्रफलEXERCISE - लघु उत्तरीय प्रश्न16videos
समांतर चतुर्भुज व त्रिभुज के क्षेत्रफल
- BOOK - BALAJI PUBLICATIONCHAPTER - शेषफल प्रमेय तथा गुणनखण्ड प्रमेय EXERCISE - स्वमूल्यांकन परिक्षण20videos
शेषफल प्रमेय तथा गुणनखण्ड प्रमेय
- BOOK - BALAJI PUBLICATIONCHAPTER - सांख्यिकीEXERCISE - स्वमूल्यांकन परीक्षण17videos
सांख्यिकी
Similar Questions
एक समांतर चतुर्भुज के विकर्ण इसे कितने भागों में विभक्त करते हैं?
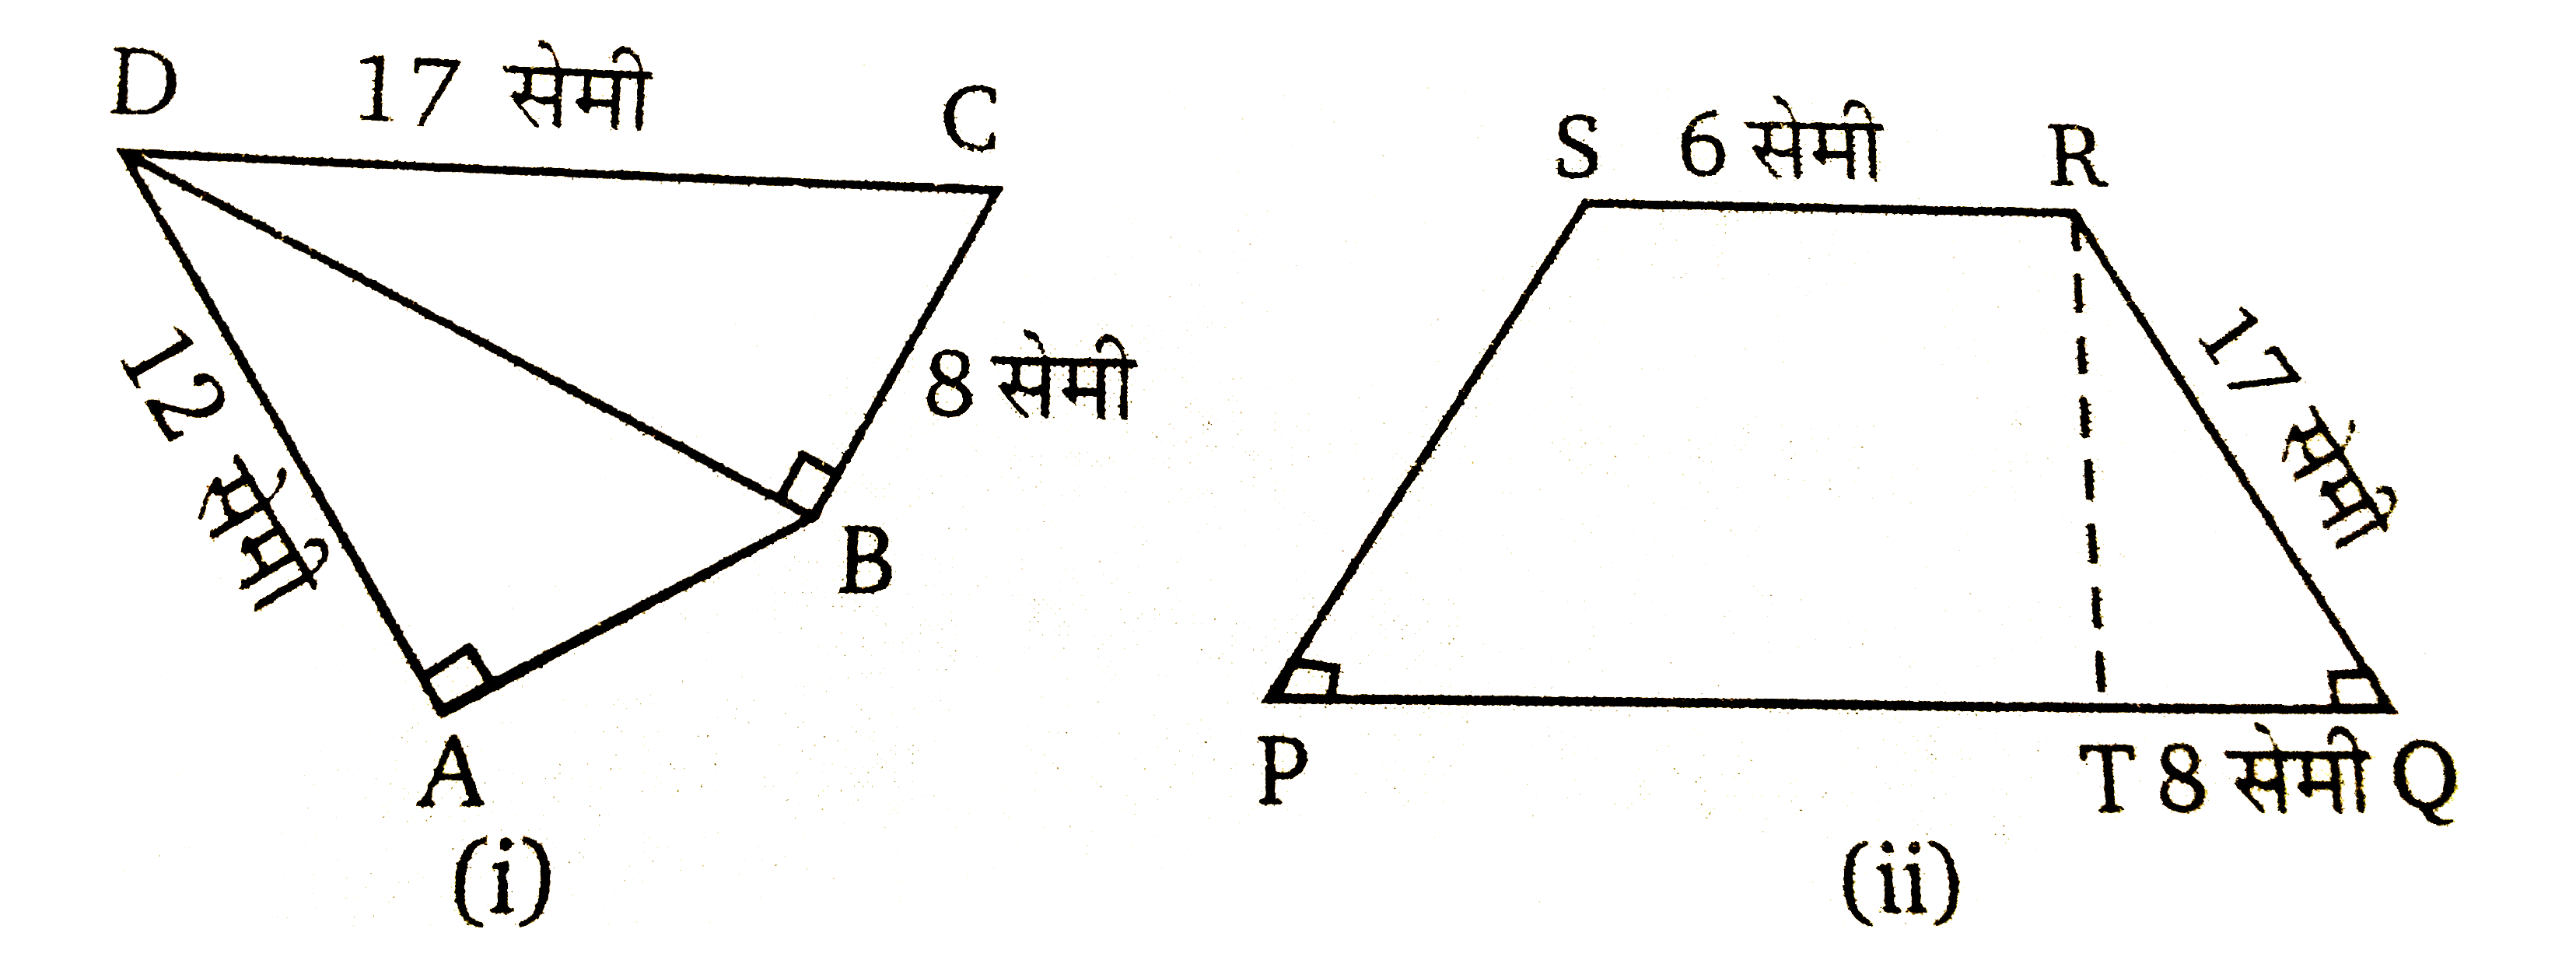
01:37View Solutionचित्र (i) और (ii) में दिए गये समलम्ब चतुर्भुजों ABCD और PQRS का क्षेत्रफल ज्ञात कीजिए।

06:07View Solutionx3+3x2+3x+1 को 5+2x से भाग करने पर शेषफल ज्ञात कीजिए।
02:11View Solutionतीन सिक्के 30 बार उछाले गये। प्रत्येक बार आये चित् की संख्या निम्न प्रकार लिखी गयी :
0,1,2,2,1,2,3,1,3,0,1,3,1,1,2,2,0,1,2,1,3,0,0,1,1,2,3,2,2,0
उपरोक्त आँकड़ों के लिए एक बारंबारता बंटन सारणी तैयार कीजिए।01:31View SolutionHow many lines of symmetry does the above figure have ?
02:45View SolutionWhich of the following are correct chain isomers of butane ? (i)
02:17View SolutionDetermine the point of symmetry of a regular hexagon.
05:41View SolutionDtermine the images of the following figure about the given line :
02:21View SolutionMatch the following Column A to Column B
 02:10View Solution
Match the following Column A to Column B
 02:17View Solution
Match the following Column A to Column B
 02:10View Solution
Find the area of the figure given below.
 04:23View Solution
The inequation represented by the graph given below is :
01:49View SolutionThe inequation that best describes the graph given below is _________
03:29View SolutionThe inequation that best describes the following graph is _________
03:10View SolutionWhich inequations represent the shaded region in the given figure
01:44View Solution

