संलग्न चित्र में यदि समांतर चतुर्भुज ABCD का क्षेत्रफल 30 सेमी2 है तब शीर्षलम्ब AQ की लम्बाई है-

6 सेमी
5 सेमी
4 सेमी
इनमें से कोई नहीं
The correct Answer is:B
Step by step video & image solution for संलग्न चित्र में यदि समांतर चतुर्भुज ABCD का क्षेत्रफल 30 सेमी"^(2) है तब शीर्षलम्ब AQ की लम्बाई है- by Maths experts to help you in doubts & scoring excellent marks in Class 9 exams.
Updated on:21/07/2023Topper's Solved these Questions
- समांतर चतुर्भुज व त्रिभुज के क्षेत्रफलBOOK - BALAJI PUBLICATIONCHAPTER - समांतर चतुर्भुज व त्रिभुज के क्षेत्रफलEXERCISE - स्वमूल्यांकन परीक्षण
15 Videos
- समांतर चतुर्भुज व त्रिभुज के क्षेत्रफलBOOK - BALAJI PUBLICATIONCHAPTER - समांतर चतुर्भुज व त्रिभुज के क्षेत्रफलEXERCISE - लघु उत्तरीय प्रश्न
16 Videos
- शेषफल प्रमेय तथा गुणनखण्ड प्रमेय BOOK - BALAJI PUBLICATIONCHAPTER - शेषफल प्रमेय तथा गुणनखण्ड प्रमेय EXERCISE - स्वमूल्यांकन परिक्षण
20 Videos
- सांख्यिकीBOOK - BALAJI PUBLICATIONCHAPTER - सांख्यिकीEXERCISE - स्वमूल्यांकन परीक्षण
17 Videos
Similar Questions
एक चतुर्भुज ABCD के विकर्ण AC और BD परस्पर बिंदु O पर इस प्रकार प्रतिच्छेद करते हैं कि (AOD) का क्षे0=(BOC) का क्षे0 तो सिद्ध कीजिए कि ABCD एक समलम्ब चतुर्भुज है।
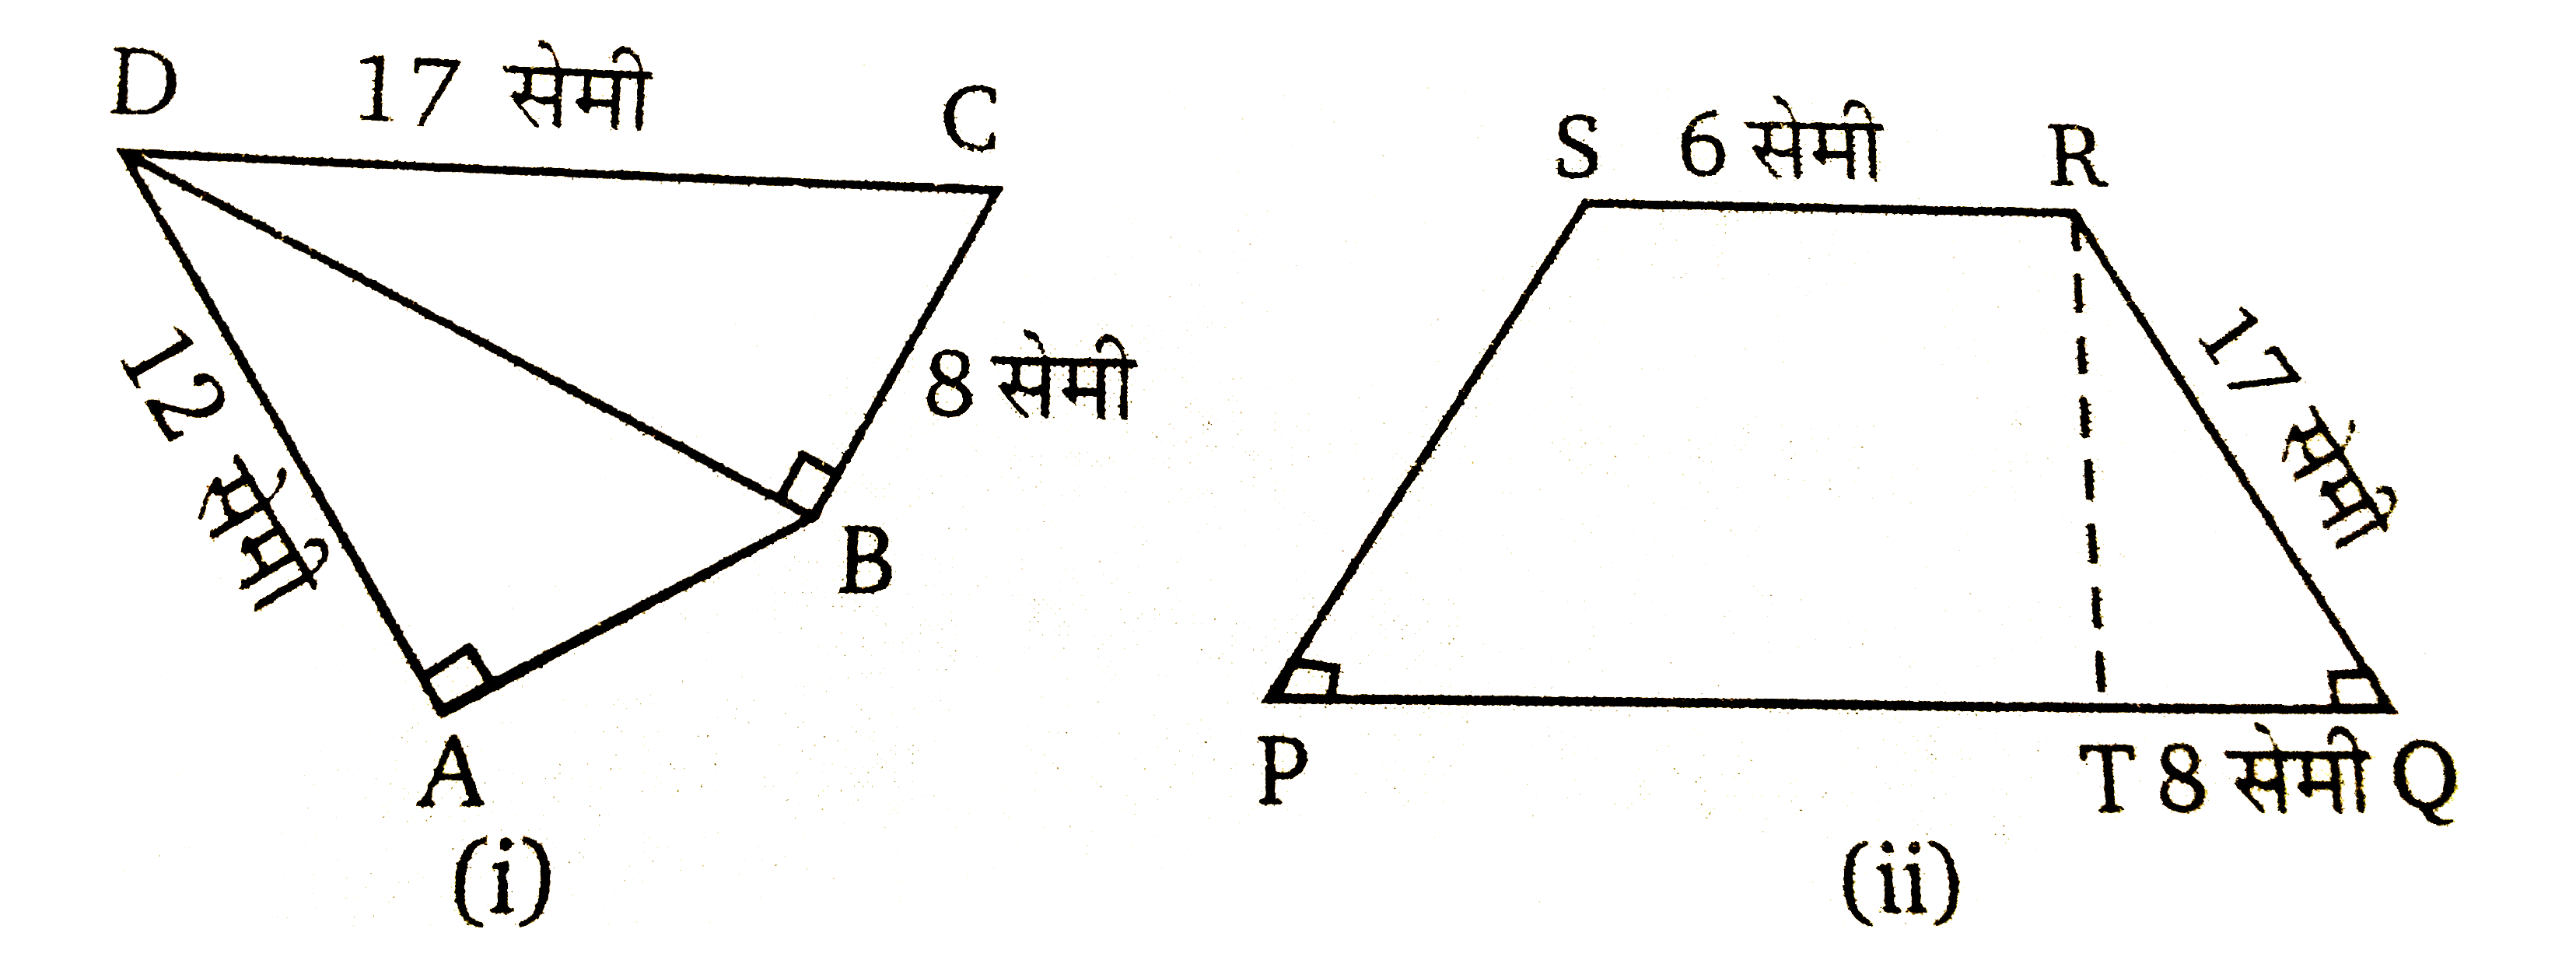
View Solutionचित्र (i) और (ii) में दिए गये समलम्ब चतुर्भुजों ABCD और PQRS का क्षेत्रफल ज्ञात कीजिए।

View Solutionx3+3x2+3x+1 को 5+2x से भाग करने पर शेषफल ज्ञात कीजिए।
View Solutionतीन सिक्के 30 बार उछाले गये। प्रत्येक बार आये चित् की संख्या निम्न प्रकार लिखी गयी :
0,1,2,2,1,2,3,1,3,0,1,3,1,1,2,2,0,1,2,1,3,0,0,1,1,2,3,2,2,0
उपरोक्त आँकड़ों के लिए एक बारंबारता बंटन सारणी तैयार कीजिए।
View SolutionHow many lines of symmetry does the above figure have ?
View SolutionWhich of the following are correct chain isomers of butane ? (i)
View SolutionDetermine the point of symmetry of a regular hexagon.
View SolutionDtermine the images of the following figure about the given line :
View SolutionMatch the following Column A to Column B

View SolutionMatch the following Column A to Column B

View SolutionMatch the following Column A to Column B

View SolutionFind the area of the figure given below.

View SolutionThe area of the shaded part in the figure given below is ______.

View SolutionThe inequation represented by the graph given below is :
View SolutionThe inequation that best describes the graph given below is _________
View SolutionThe inequation that best describes the following graph is _________
View Solution
