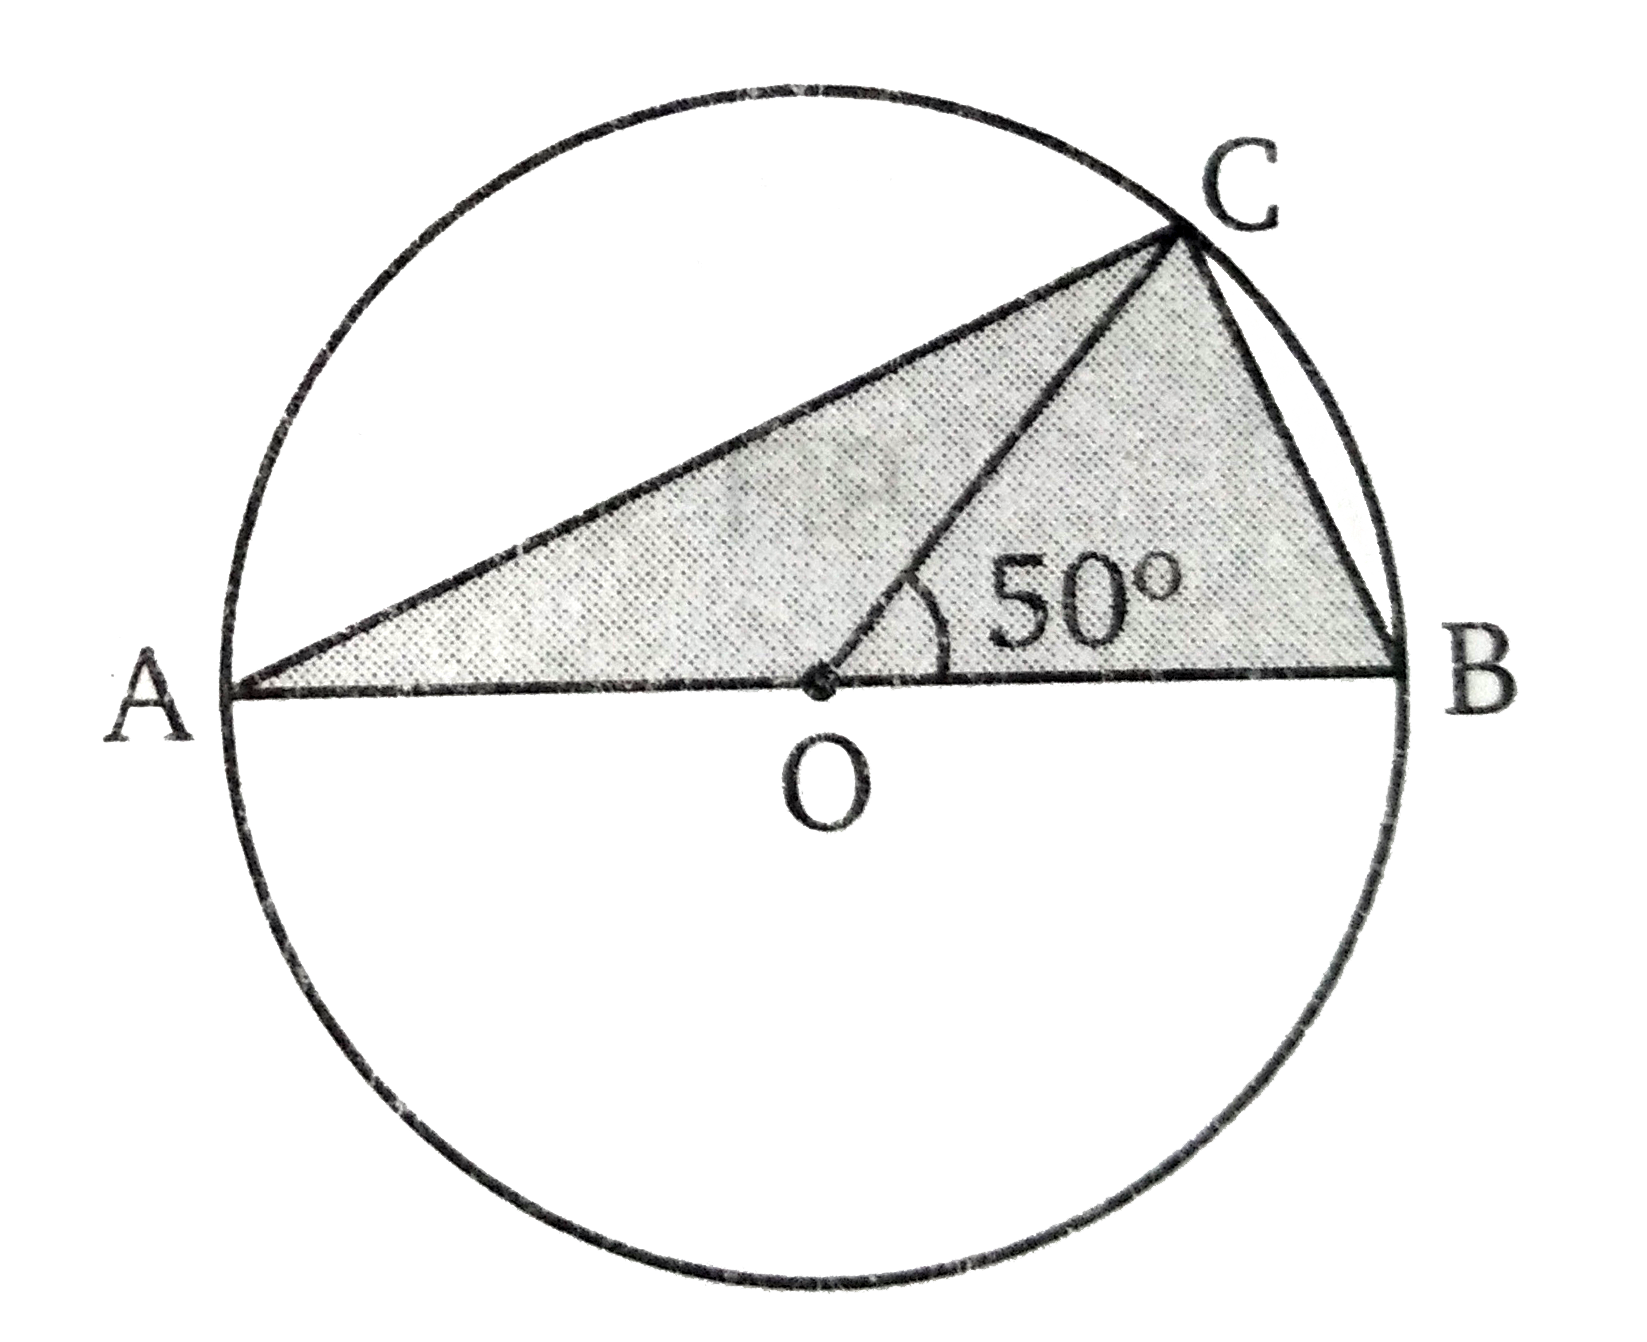
चित्र में O वृत्त का केन्द्र तथा AB इसका व्यास है । यदि ∠COB=50∘ तथा ∠CAB का मान ज्ञात कीजिए ।

प्रश्नानुसार ∠BOC=50∘
इसलिए ∠BAC=12×∠BOC=12×50∘=25∘
(∵ वृत्त के एक चाप का अंश माप चाप के सापेक्ष वृत्त के एकान्तर खंड के किसी एक बिंदु पर इस चाप द्वारा अन्तरित कोण का दोगुना होता है। )
Topper's Solved these Questions
- वृत्त BOOK - BALAJI PUBLICATIONCHAPTER - वृत्त EXERCISE - अभ्यास 15.1 (अतिलघु उत्तरीय प्रश्न)
8 Videos
- वृत्त BOOK - BALAJI PUBLICATIONCHAPTER - वृत्त EXERCISE - अभ्यास 15.1 (लघु उत्तरीय प्रश्न-I)
2 Videos
- वास्तविक संख्याओं के घातांक BOOK - BALAJI PUBLICATIONCHAPTER - वास्तविक संख्याओं के घातांक EXERCISE - स्वमूल्याकन परीक्षण
13 Videos
- शेषफल प्रमेय तथा गुणनखण्ड प्रमेय BOOK - BALAJI PUBLICATIONCHAPTER - शेषफल प्रमेय तथा गुणनखण्ड प्रमेय EXERCISE - स्वमूल्यांकन परिक्षण
20 Videos
Similar Questions
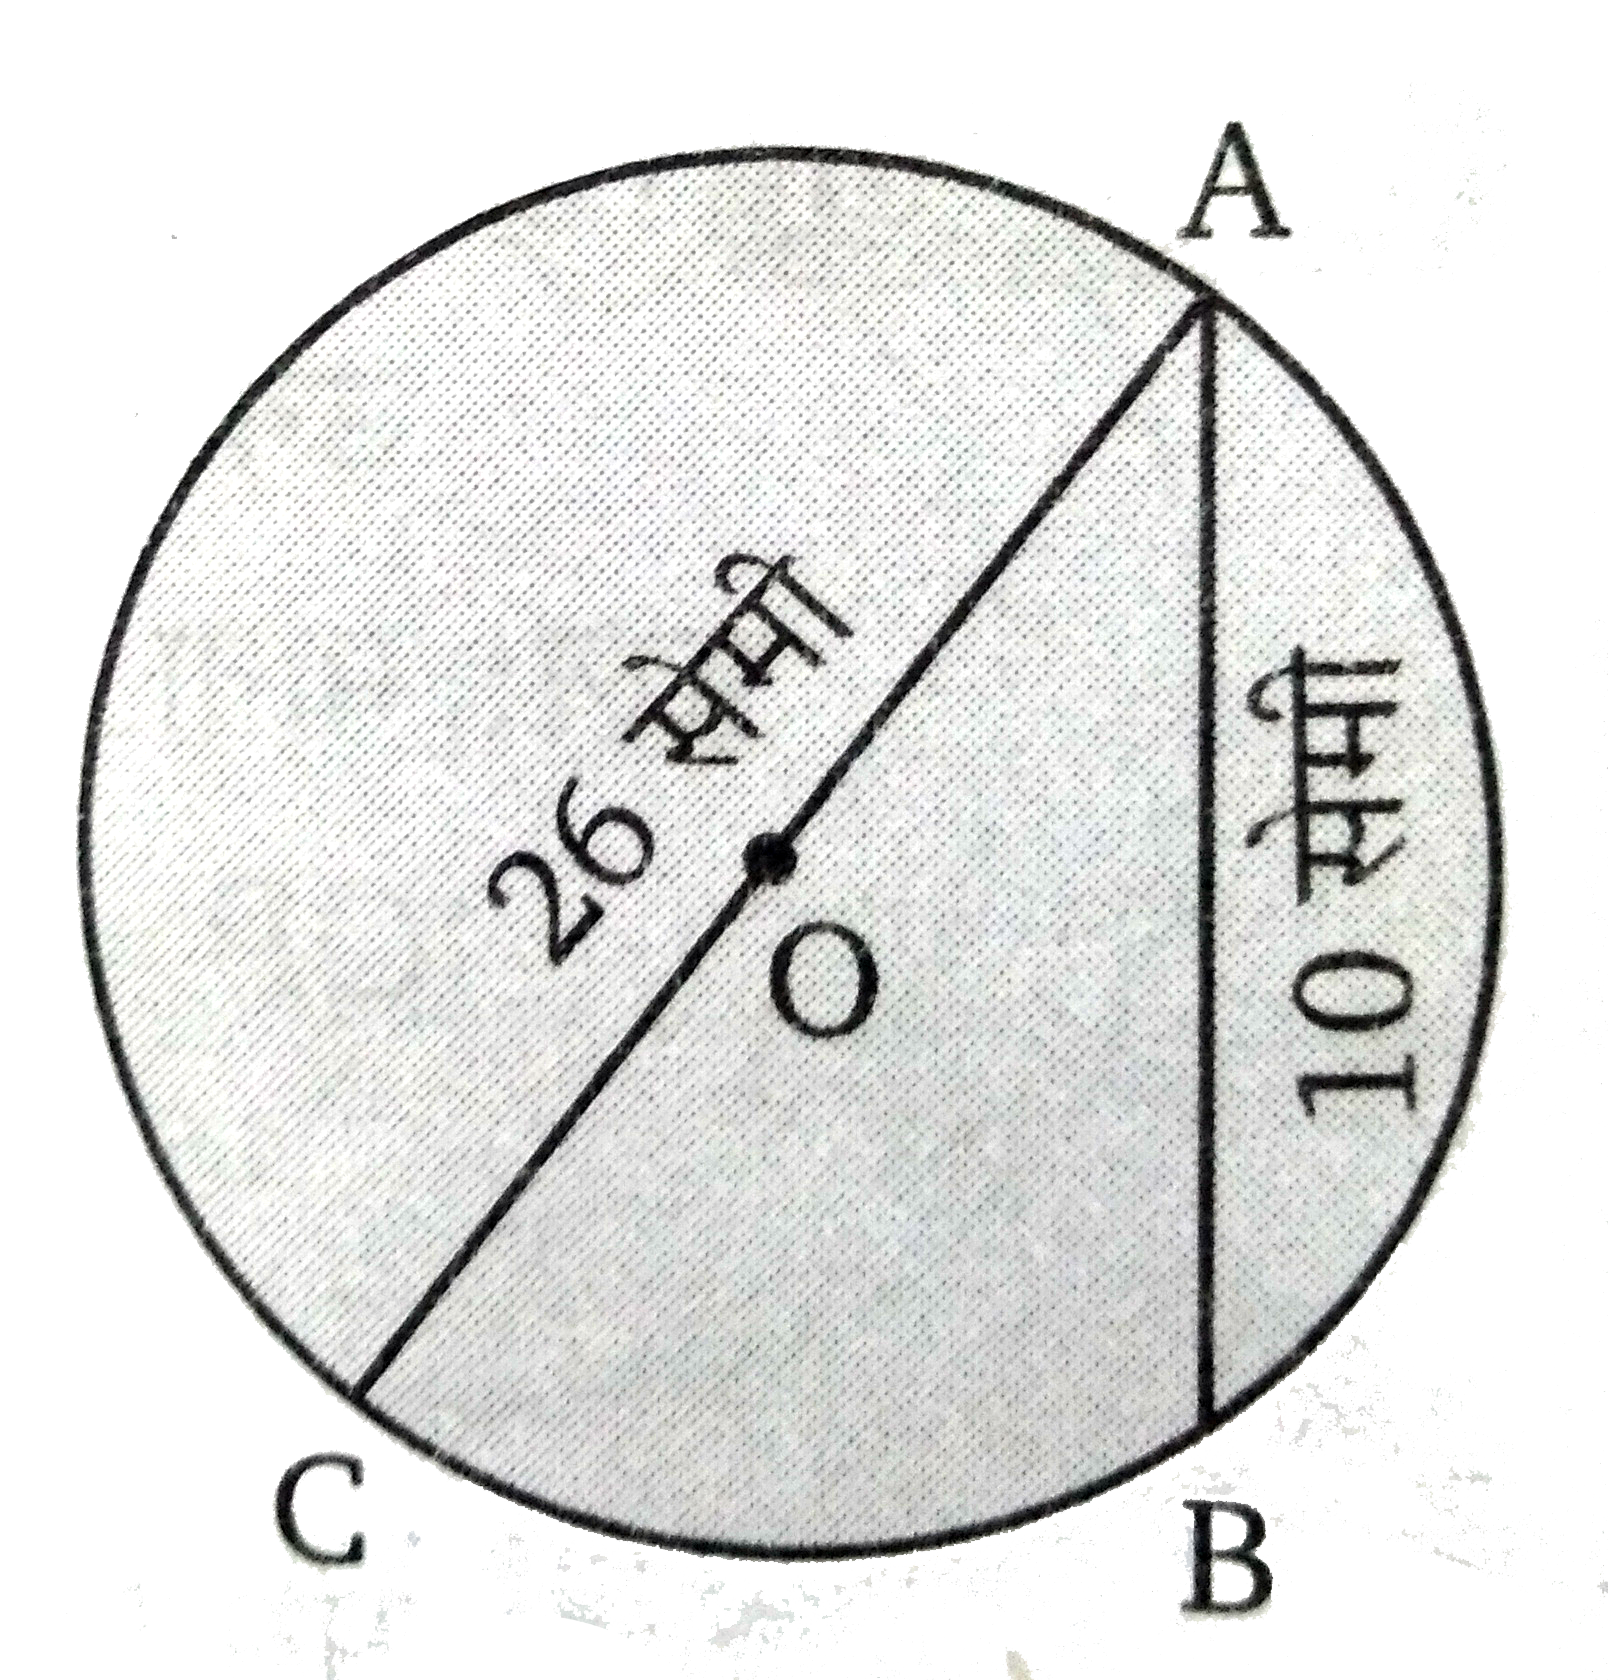
चित्र में O , वृत्त का केन्द्र, जीवा AB = 10 सेमी तथा व्यास AC = 26 सेमी है। जीवा AB की वृत्त के केन्द्र से दूरी ज्ञात कीजिए।

View Solutionएक 5 सेमी त्रिज्या वाले वृत्त के केन्द्र से 8 सेमी की एक जीवा की दूरी ज्ञात कीजिए।
View Solutionनिम्न का सरलीकरण कीजिए-
(24332)−4/5
View Solutionx3+3x2+3x+1 को 5+2x से भाग करने पर शेषफल ज्ञात कीजिए।
View SolutionIn the given figure (not to scale), O is the centre of the circle. A,B,C and D are concyclic and AB=CD . If /_MON =120^(@) , then find /_ OPN .
View SolutionHow many lines of symmetry does the above figure have ?
View SolutionWhich of the following are correct chain isomers of butane ? (i)
View SolutionDetermine the point of symmetry of a regular hexagon.
View SolutionDtermine the images of the following figure about the given line :
View SolutionIn the figure above (not to scale), ¯¯¯¯¯¯AB⊥¯¯¯¯¯¯CDandAD is the bisector of ∠BAE.AB=3cm and AC=5cm. Find CD.
View SolutionIn the given figure, AB is a diameter, O is the center of the circle and ∠OCB=50∘ then find ∠DBC.
View SolutionMatch the following Column A to Column B

View SolutionMatch the following Column A to Column B

View SolutionMatch the following Column A to Column B

View SolutionThe inequation represented by the graph given below is :
View SolutionThe inequation that best describes the graph given below is _________
View Solution
