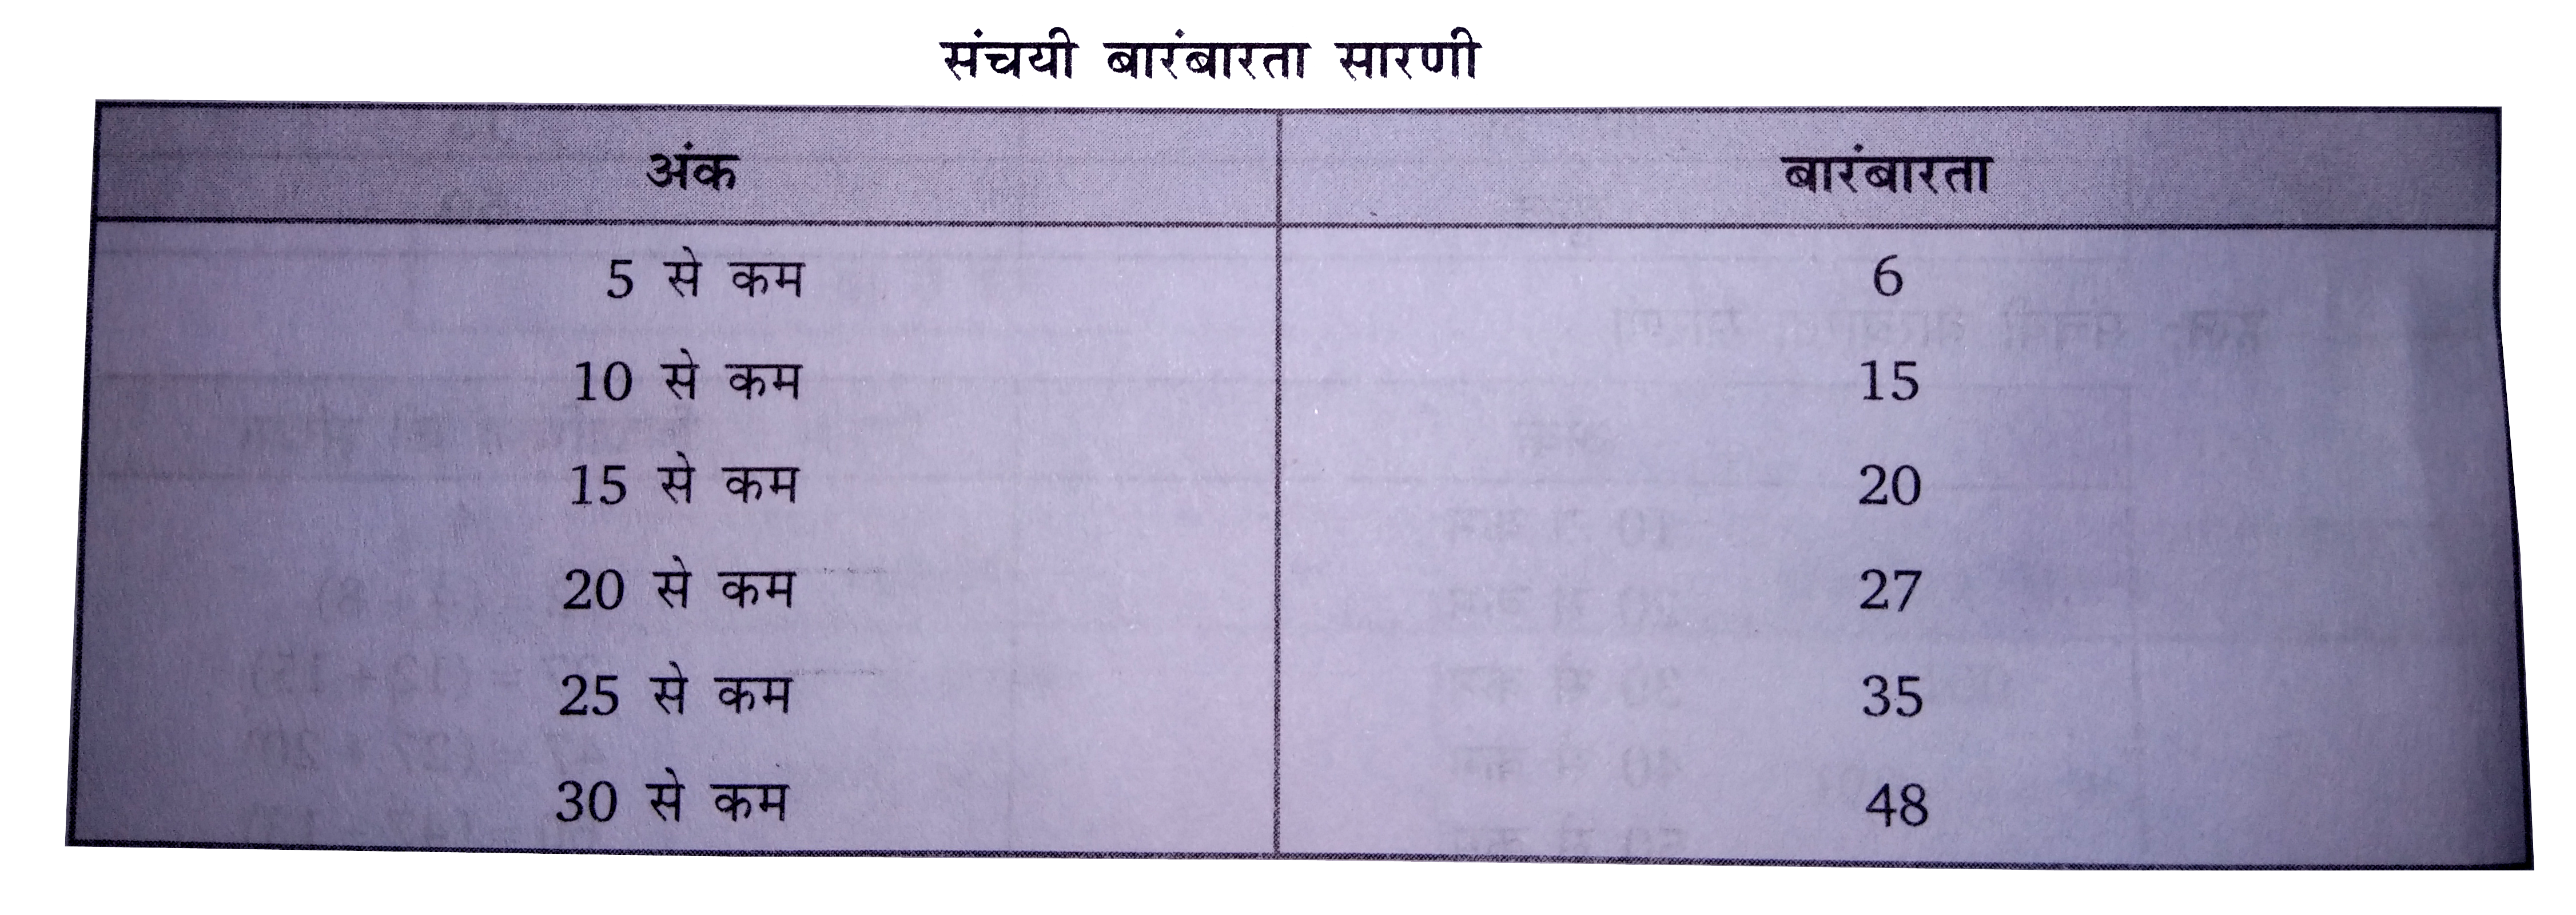
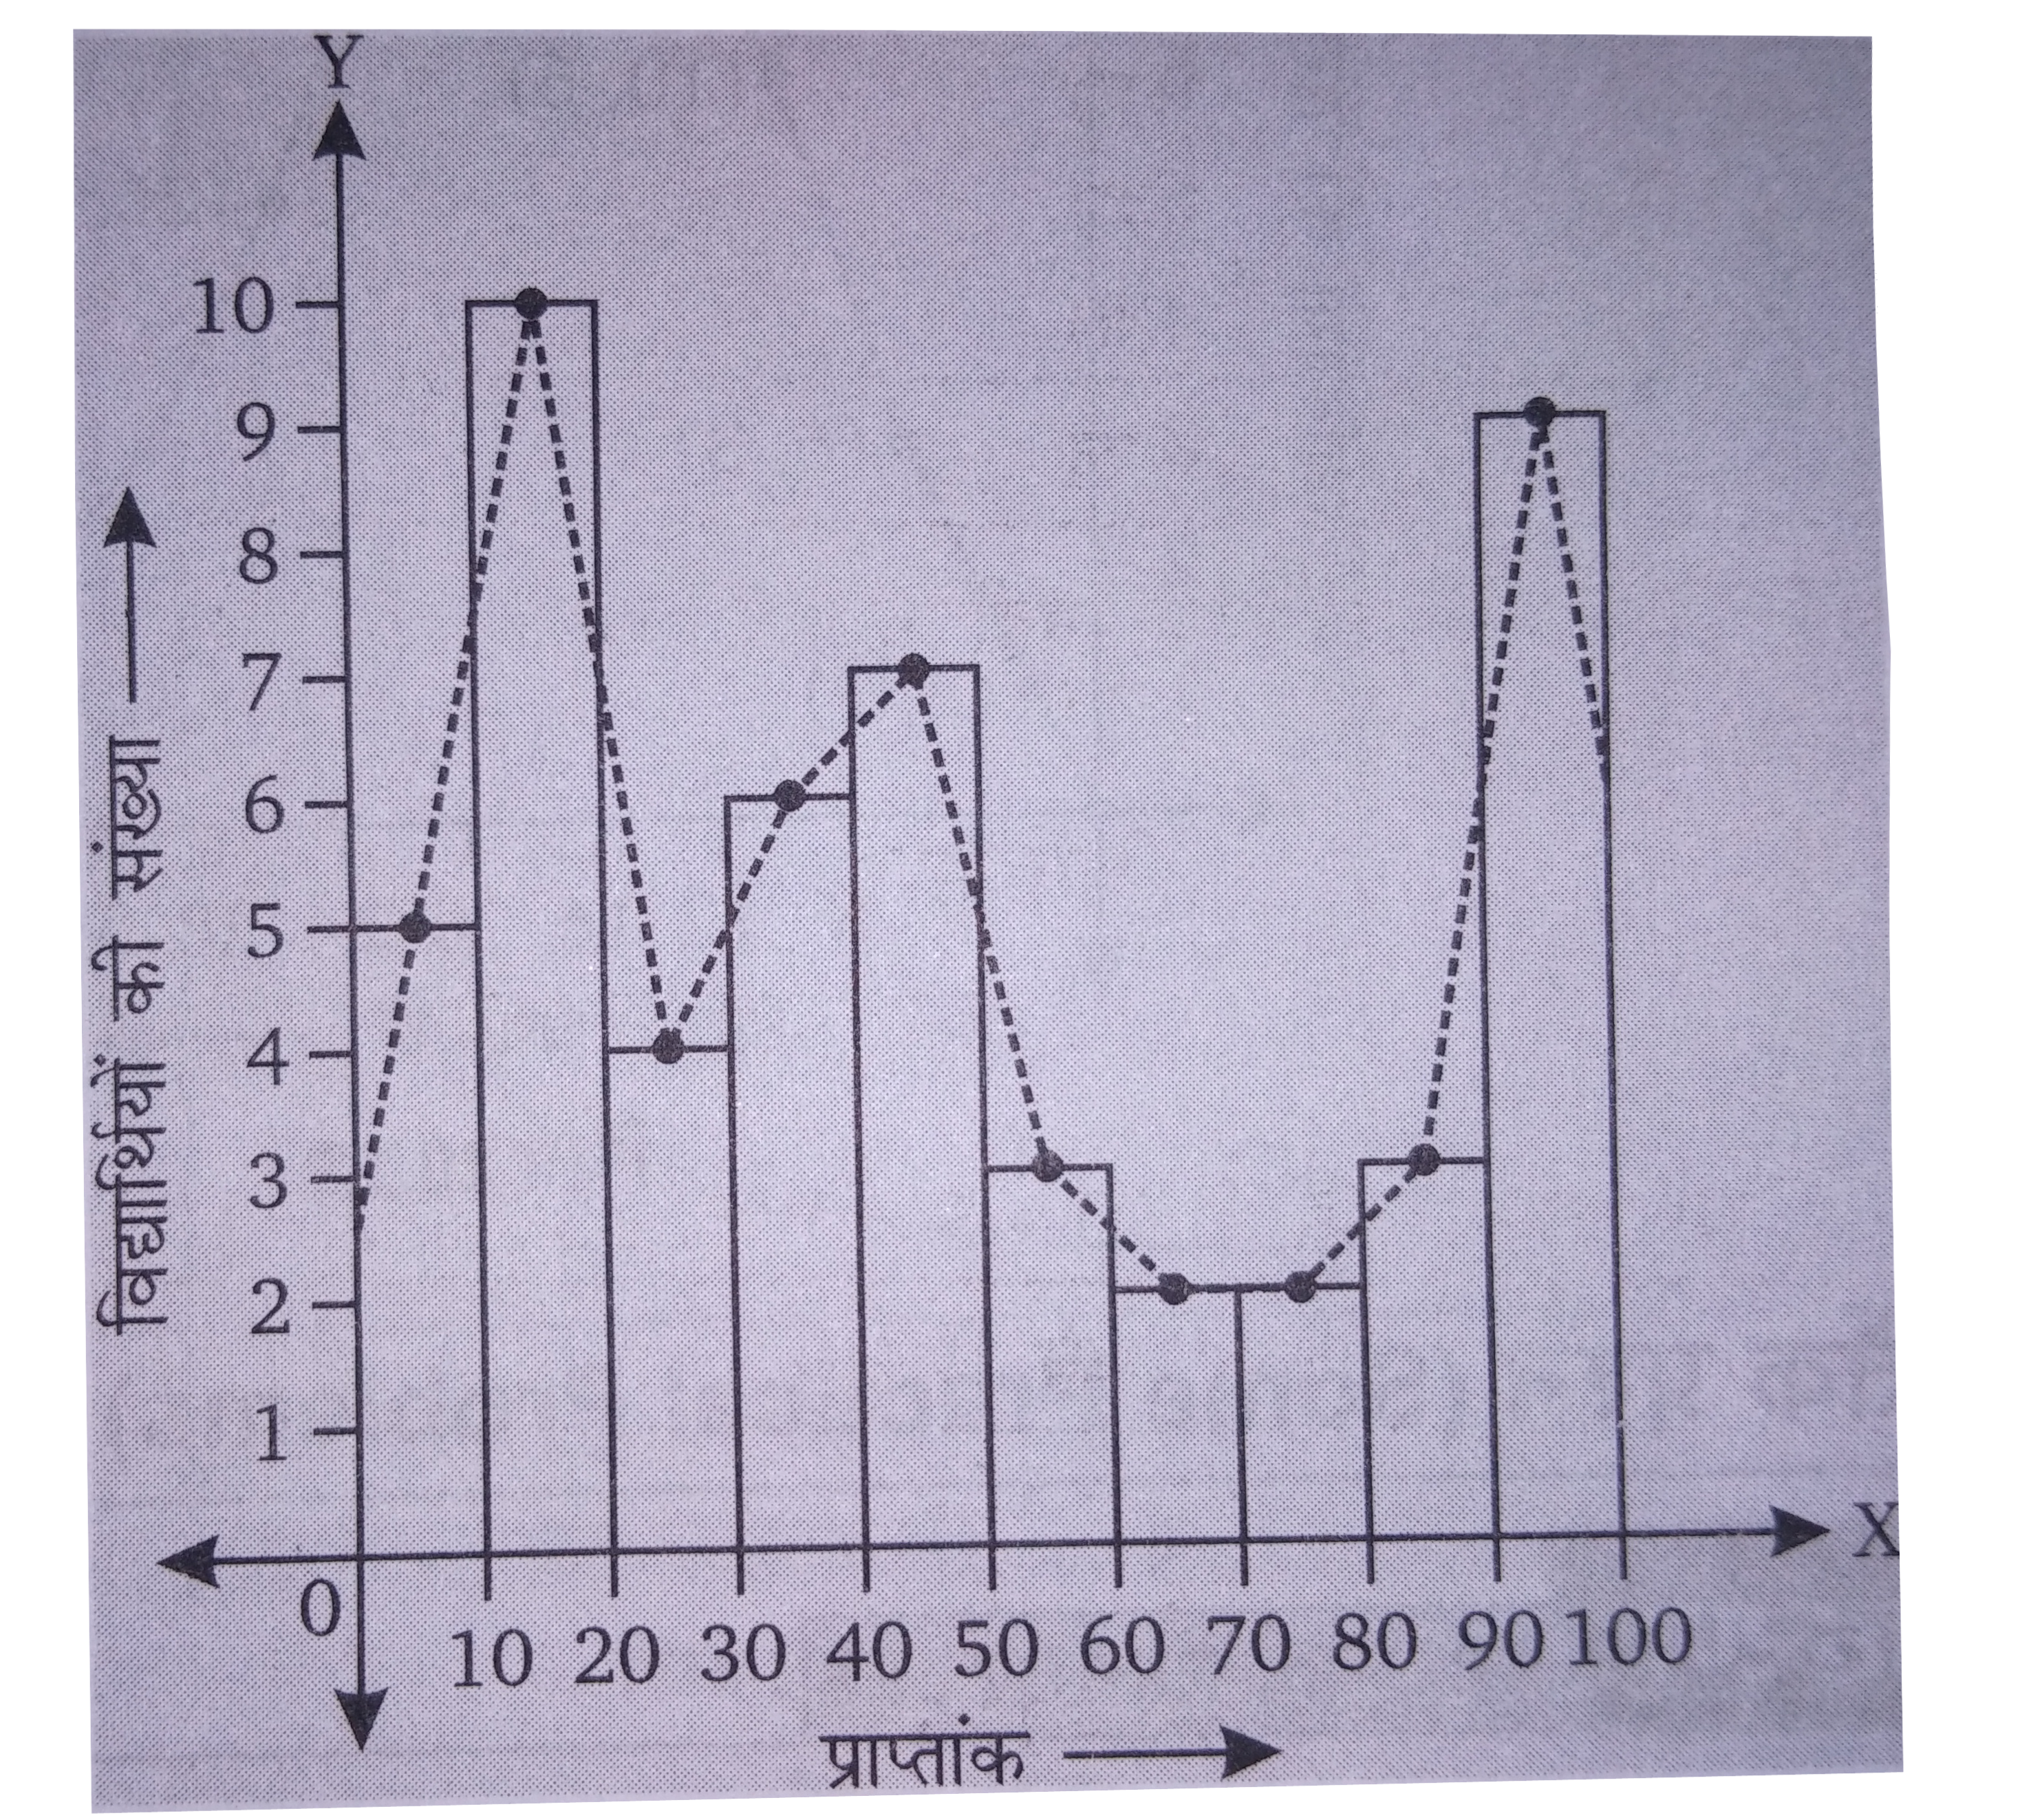
निम्नलिखित आँकड़ो से , एक आयत - चित्र तथा एक बारंबारता बहुभुज खीचिए ।

Topper's Solved these Questions
- सांख्यिकीBOOK - BALAJI PUBLICATIONCHAPTER - सांख्यिकीEXERCISE - अभ्यास प्रश्न 20.1
10 Videos
- सांख्यिकीBOOK - BALAJI PUBLICATIONCHAPTER - सांख्यिकीEXERCISE - अभ्यास प्रश्न 20.2
8 Videos
- समांतर चतुर्भुज व त्रिभुज के क्षेत्रफलBOOK - BALAJI PUBLICATIONCHAPTER - समांतर चतुर्भुज व त्रिभुज के क्षेत्रफलEXERCISE - स्वमूल्यांकन परीक्षण
15 Videos
- हीरोन का सूत्रBOOK - BALAJI PUBLICATIONCHAPTER - हीरोन का सूत्रEXERCISE - स्वमूल्यांकन परीक्षण
10 Videos
Similar Questions
30 विद्यार्थियों ने एक परीक्षा में निम्न अंक प्राप्त किए-
20,23,28,30,32,34,35,36,36,40,41,42,43,44,45,45,48,44,50,50,52,53,54,56,56,58,61,62,65,65
वर्ग अन्तराल 20-29, 30-39,40-49, 50-59 तथा 60-69 लेकर इन्हें बारंबारता बंटनीय रूप में दर्शाइये।
View Solutionनिम्नलिखित 'कम प्रकार की' संचयी बारंबारता सारणी को साधारण बारंबारता सारणी में बदलिये।

View Solutionएक चतुर्भुज ABCD के विकर्ण AC और BD परस्पर बिंदु O पर इस प्रकार प्रतिच्छेद करते हैं कि (AOD) का क्षे0=(BOC) का क्षे0 तो सिद्ध कीजिए कि ABCD एक समलम्ब चतुर्भुज है।
View Solutionएक त्रिभुज का क्षेत्रफल ज्ञात कीजिए जिसकी दो भुजाएं 8 सेमी और 11 सेमी है तथा परिमाप 32 सेमी है।
View SolutionIdentify the cell organelle 'A' :-
ltimg src="https://d10lpgp6xz60nq.cloudfront.net/physics_images/ALN_BIO_C10_E08_018_Q01.png" width="80%"gt
View SolutionHow many lines of symmetry does the above figure have ?
View SolutionWhich of the following are correct chain isomers of butane ? (i)
View SolutionDetermine the point of symmetry of a regular hexagon.
View SolutionDtermine the images of the following figure about the given line :
View SolutionMatch the following Column A to Column B

View SolutionMatch the following Column A to Column B

View SolutionMatch the following Column A to Column B

View SolutionFind the area of the figure given below.

View SolutionThe area of the shaded part in the figure given below is ______.

View SolutionThe inequation represented by the graph given below is :
View SolutionThe inequation that best describes the graph given below is _________
View Solution

