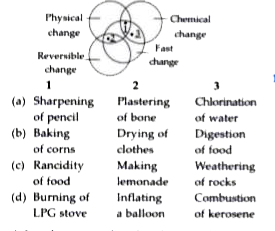
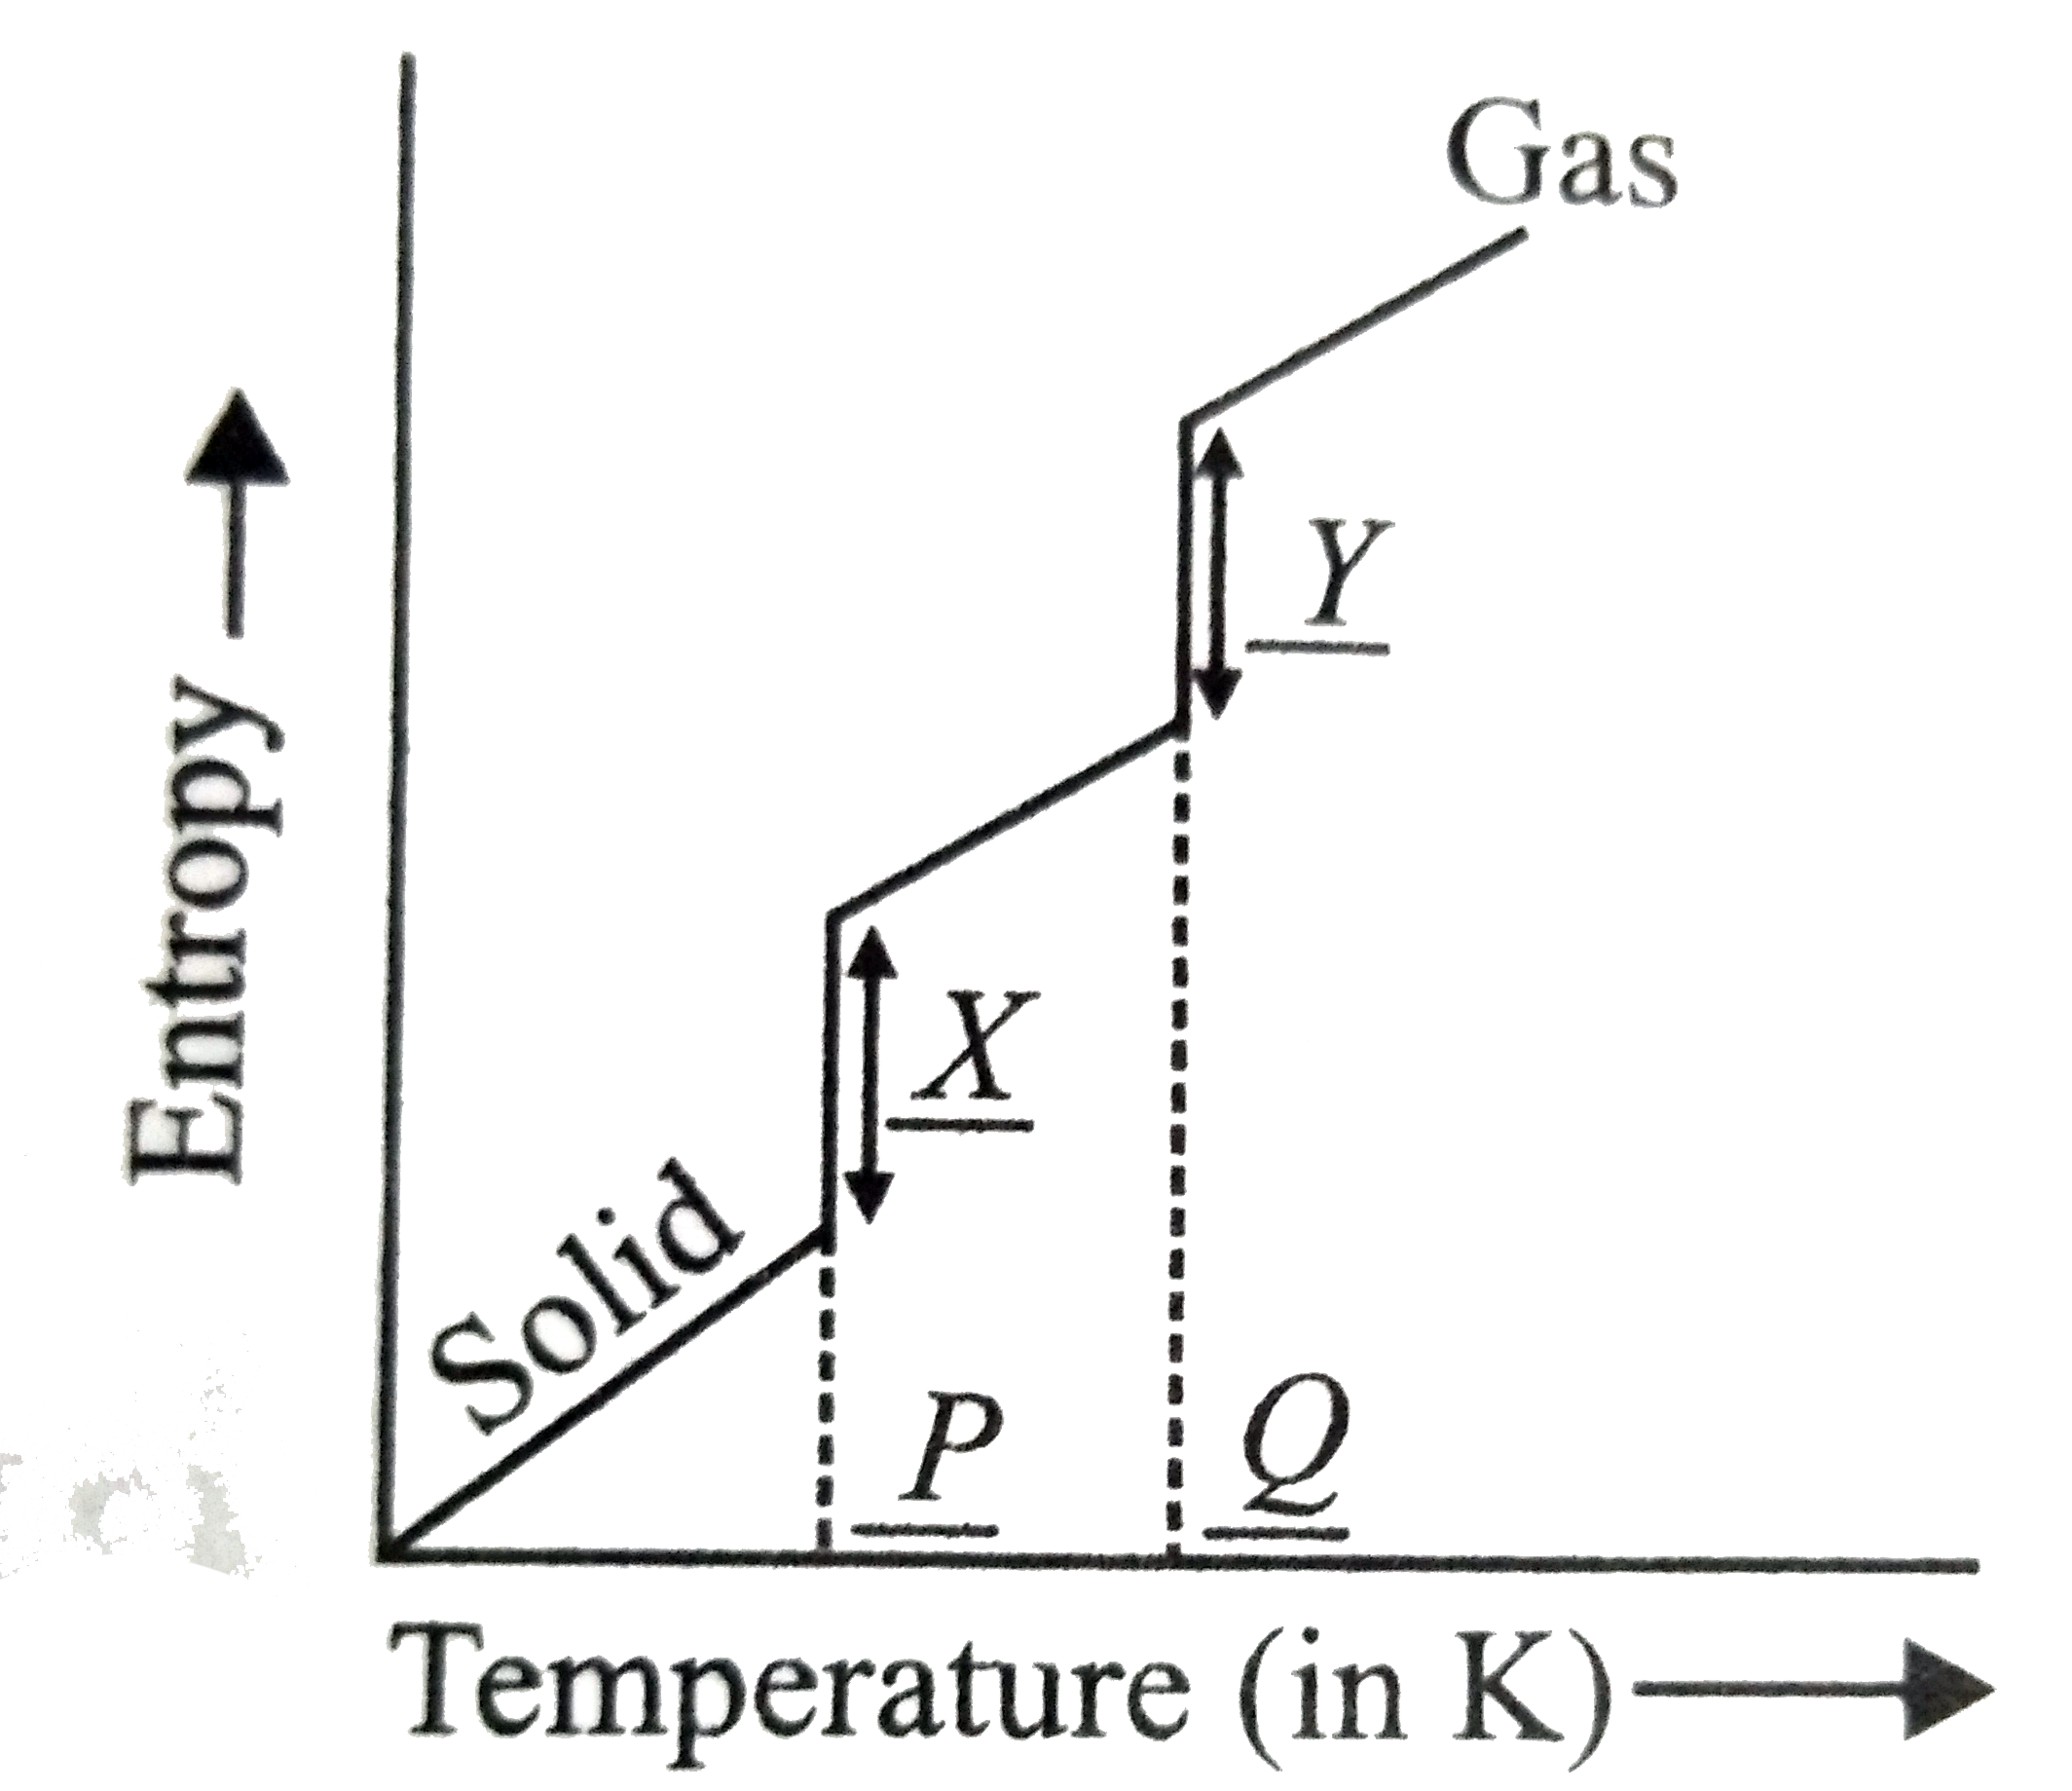
Study the following graph and fill in the blanks.
Text Solution
The correct Answer is:c
X represents melting of solid into liquid and P being the meling point. Y represents vaporisation of liquid into gas and Q represents boiling point of the liquid.
|
Topper's Solved these Questions
- THERMODYNAMICSBOOK - NCERT FINGERTIPSCHAPTER - THERMODYNAMICSEXERCISE - Enthalpy Change Of A Reaction
13 Videos
- THERMODYNAMICSBOOK - NCERT FINGERTIPSCHAPTER - THERMODYNAMICSEXERCISE - Enthalpies For Different Type Of Reaction
22 Videos
- THERMODYNAMICSBOOK - NCERT FINGERTIPSCHAPTER - THERMODYNAMICSEXERCISE - Applications
26 Videos
- THE S-BLOCK ELEMENTSBOOK - NCERT FINGERTIPSCHAPTER - THE S-BLOCK ELEMENTSEXERCISE - Assertion And Reason
15 Videos
Similar Questions
Knowledge Check
Study the following flowchart and fill up the blanks by selecting the correct option.
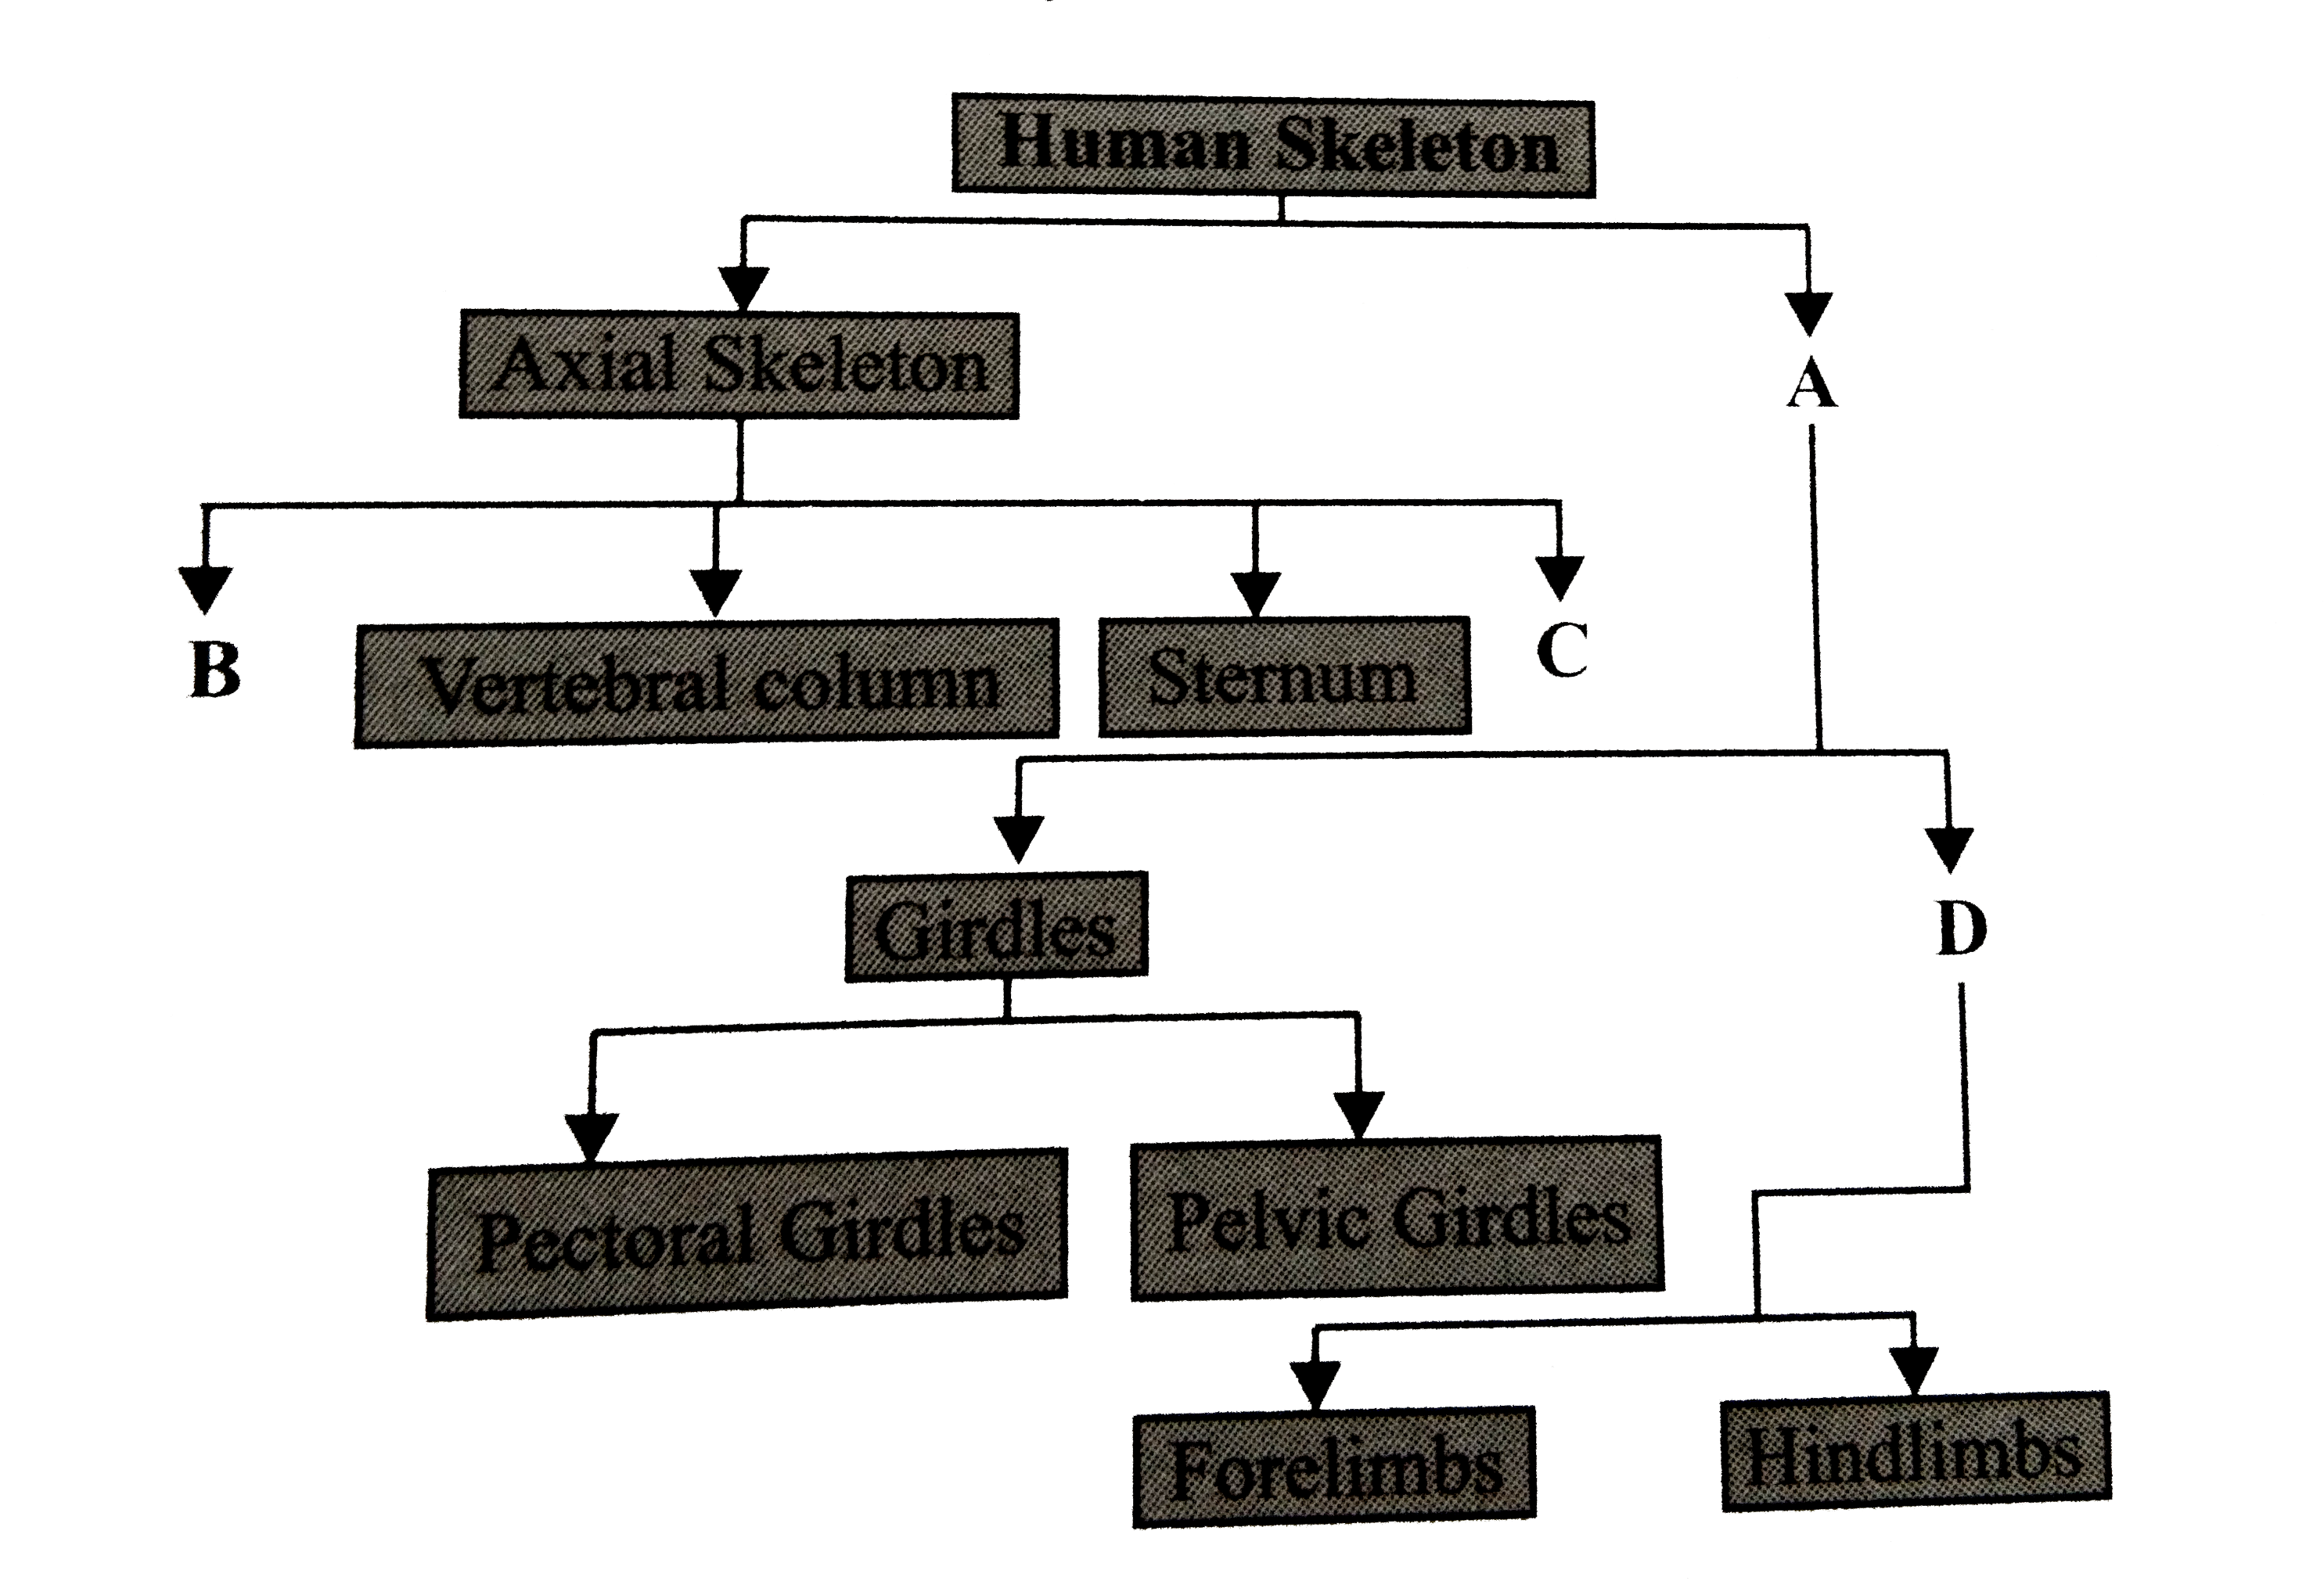 A(A)(B)(C)(D)Thoracic skeletonLimbsSkullRibsB(A)(B)(C)(D)Appendicular skeletonSkullRibsLimbsC(A)(B)(C)(D)Appendicular skeletonLimbsRibsSkullD(A)(B)(C)(D)Lumbar skeletonLimbsSkullRibs
Study the following flowchart and fill up the blanks by selecting the correct option.
 A(A)(B)(C)(D)Thoracic skeletonLimbsSkullRibsB(A)(B)(C)(D)Appendicular skeletonSkullRibsLimbsC(A)(B)(C)(D)Appendicular skeletonLimbsRibsSkullD(A)(B)(C)(D)Lumbar skeletonLimbsSkullRibs
Study the following graph carefully and answer the questions that follow
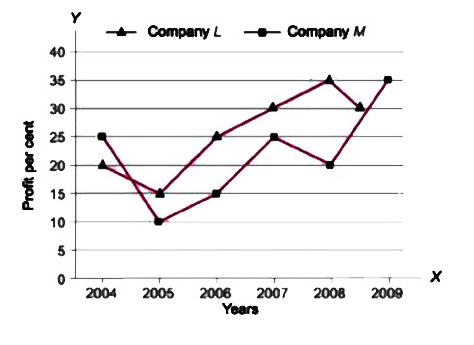
Which of the following statements is true with respect to the above graph ?ACompany M made the highest profit in the year 2009BCompany L made the least profit in the year 2005CThe ratio of the profits earned by company L and company M in the year 2006 was 6:5DCompany L made the highest profit in the year 2008
Study the following graph .
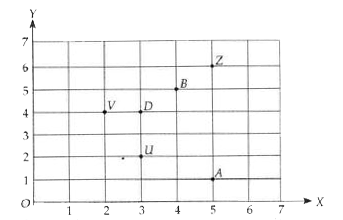
On the basis of above graph, coordinates of U and Z are
View SolutionStudy carefully the given flow chart and fill in the blanks (A) , (B) , (C ) and (D )
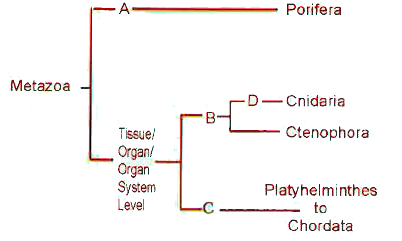
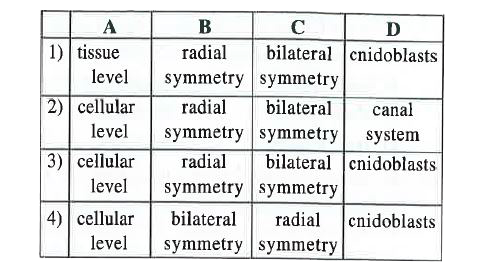
View SolutionStudy the following graph and mark the incorrect statement following it .
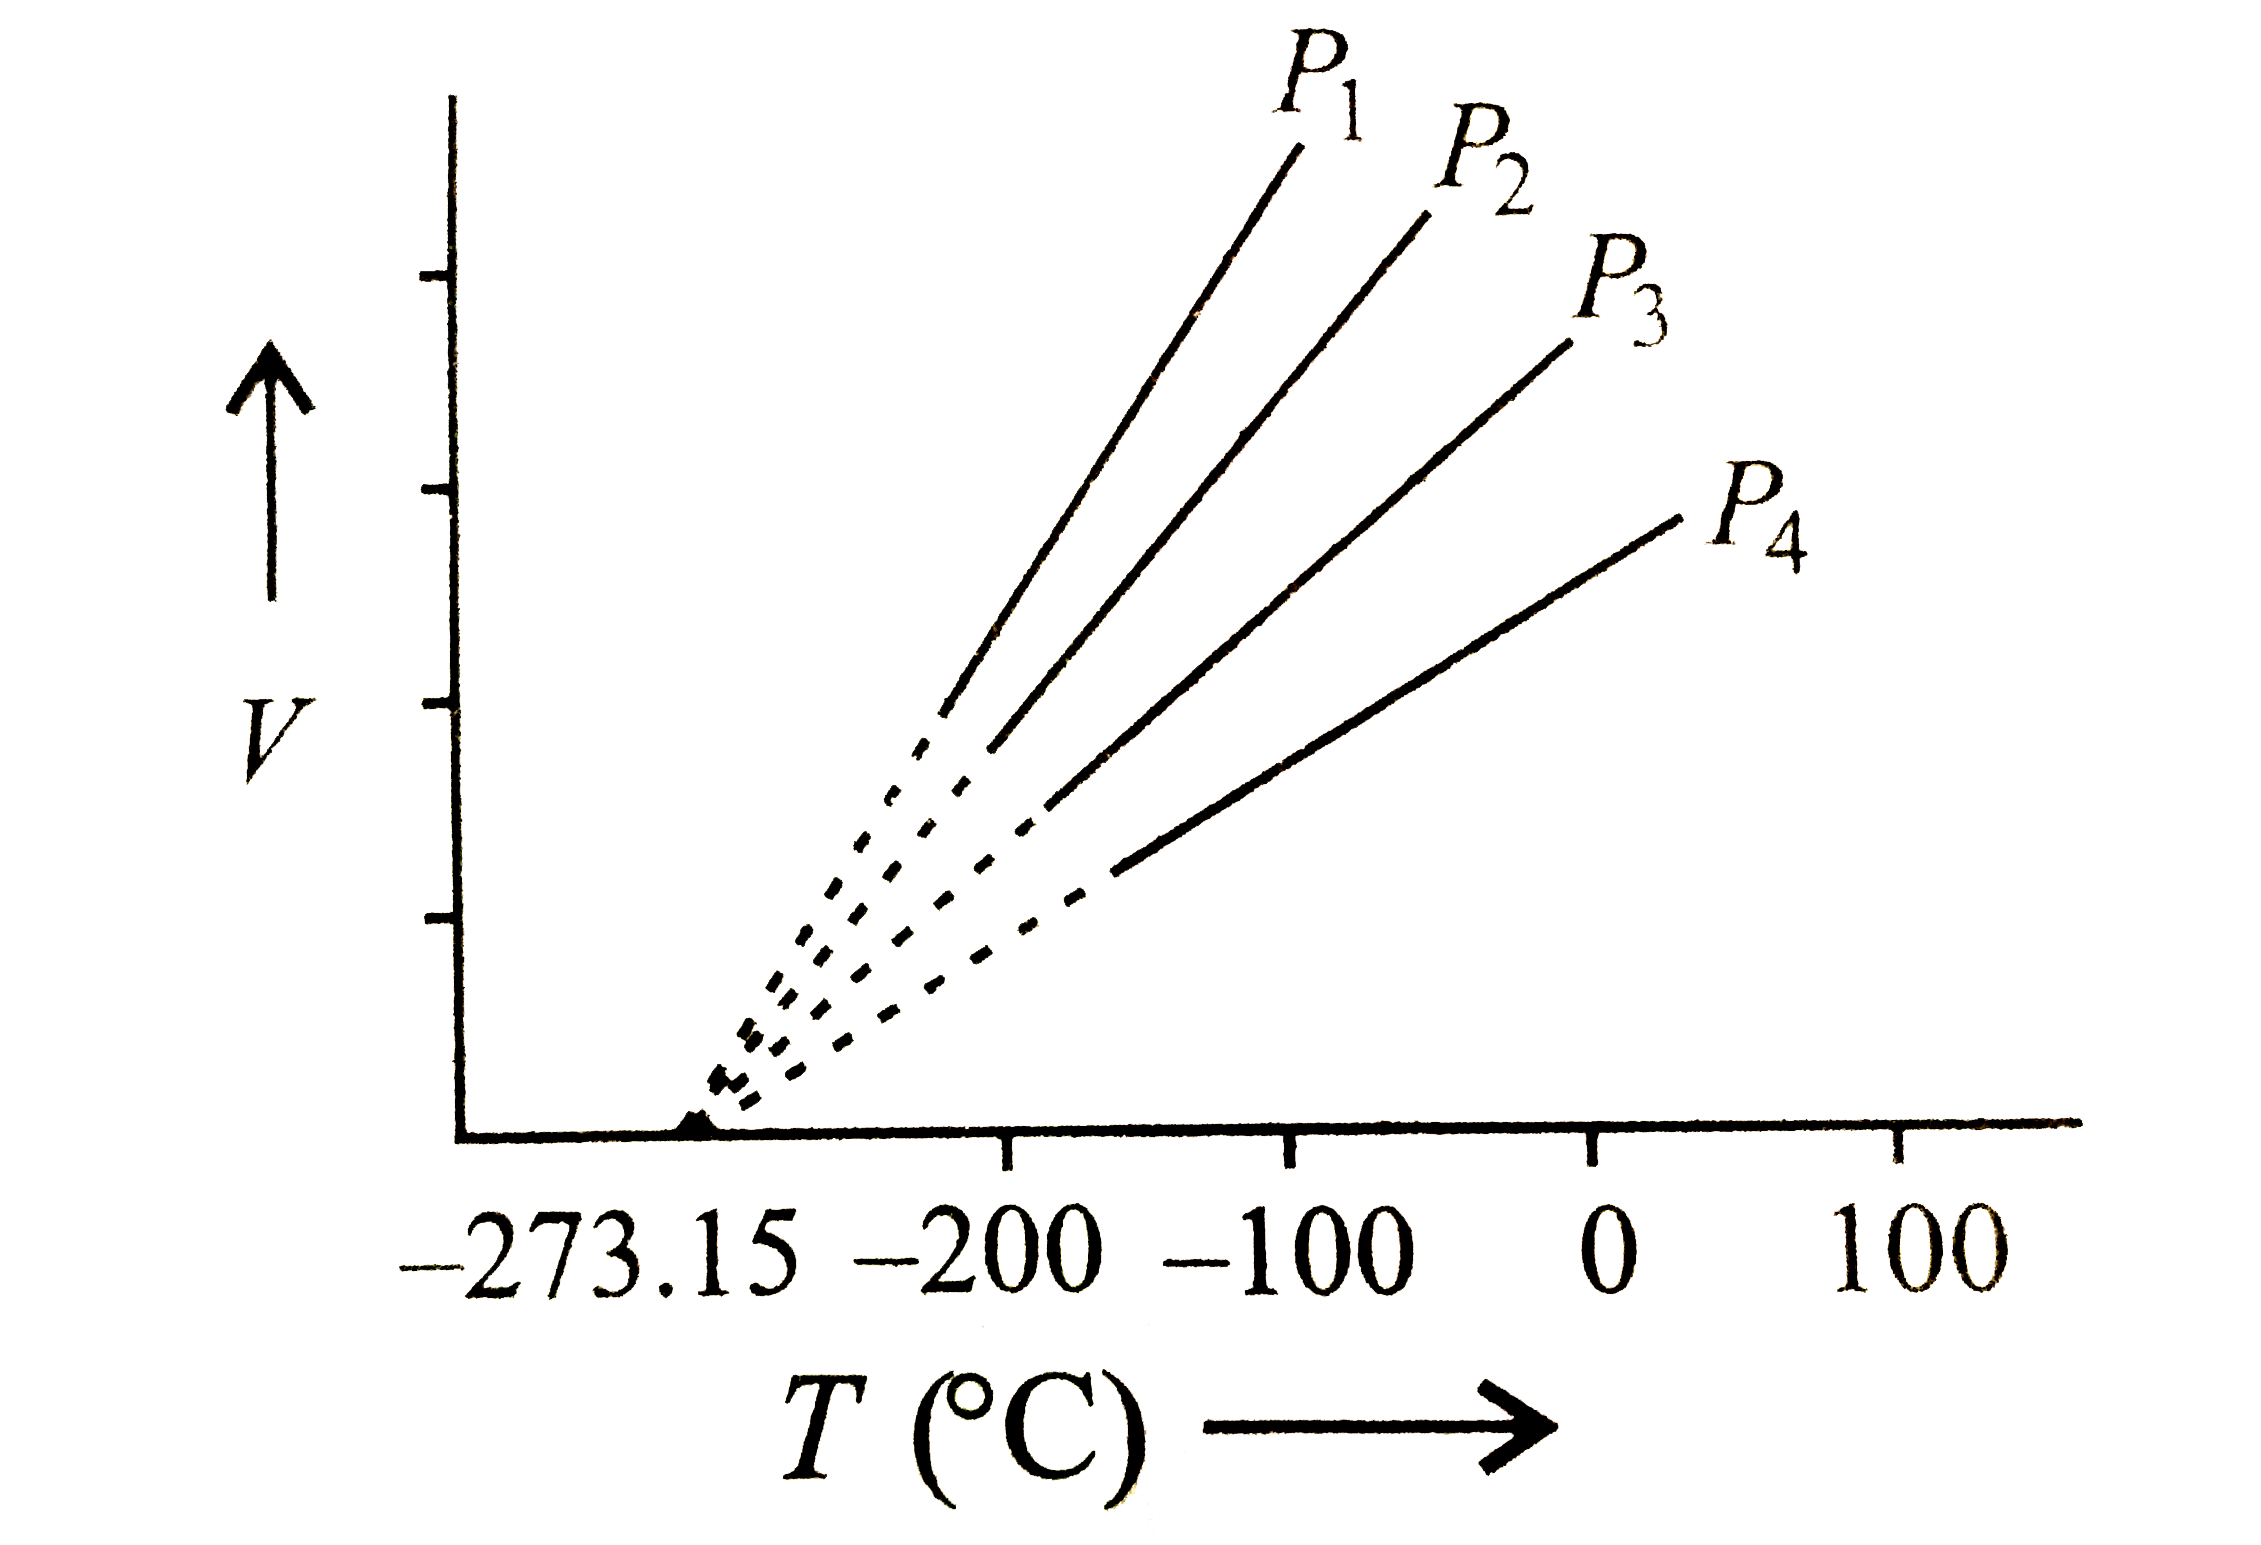
View SolutionStudy the following graph carefully to answer the questions that follow-----
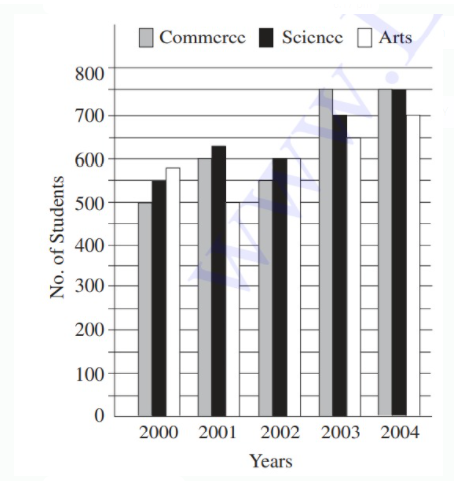
What is the total number of students studying Arts in all the years together ?
View SolutionStudy the following bar graph and answer the question that follows.
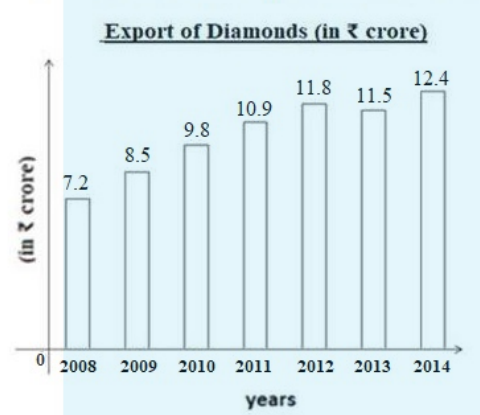
In which year was the maximin percentage increase in diamonds exports compared to the previous year?
View Solution

