A piece of ice is heated and the temperature is monitored as a function of time .Which of the following figures will justify the observation ?


The correct Answer is:A
Topper's Solved these Questions
- MATTER IN OUR SURROUNDINGS BOOK - BHARATI BHAWAN (ENGLISH)CHAPTER - MATTER IN OUR SURROUNDINGS EXERCISE - B. Very Short Answer Questions
19 Videos
- MATTER IN OUR SURROUNDINGS BOOK - BHARATI BHAWAN (ENGLISH)CHAPTER - MATTER IN OUR SURROUNDINGS EXERCISE - C. Short Answer Questions
31 Videos
- MATTER IN OUR SURROUNDINGS BOOK - BHARATI BHAWAN (ENGLISH)CHAPTER - MATTER IN OUR SURROUNDINGS EXERCISE - IV. Mark the statements True (T) or False (F) .
8 Videos
- CLASSES OF MATTER BOOK - BHARATI BHAWAN (ENGLISH)CHAPTER - CLASSES OF MATTER EXERCISE - D. Long Answer Questions
14 Videos
- NATURAL RESOURCES BOOK - BHARATI BHAWAN (ENGLISH)CHAPTER - NATURAL RESOURCES EXERCISE - D. Long Answer Questions
12 Videos
Similar Questions
Which of the following piece will fit in the figure given below?
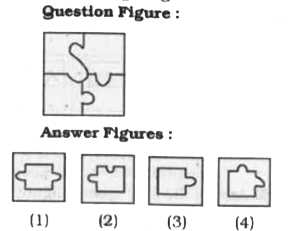
View SolutionA student heats a beaker containing ice and water. He measures the temperature of the content of the beaker as a function of lime. Which of the following would correctly represent the result ? Justify your choice .

View Solution
Knowledge Check
A block of ice, initially at −20∘C, is heated a steady rate until the temperature of the sample reaches 120∘C. Which of the following graphs best illustrates the temperature of the sample as a function of time?
A B
B C
C D
D
A piece of ice kept at room temperature melts of its own. This reaction is governed by which law ?
AFirst law of thermodynamicsBZeroth law of thermodynamicsCSecond law of thermodynamicsDThird law of thermodynamics100 g of ice at −15∘C was heated. The rise in temperature of ice was plotted against the heat given to ice. Which of the following graphs (Fig. 6.2) correctly depicts this behaviour?
A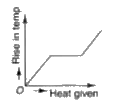 B
B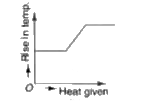 C
C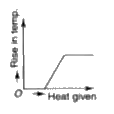 D
D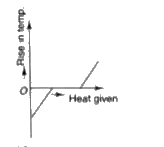
A student heats a beaker containing ice and water. He measures the temperature of the content of the beaker as a function of lime. Which of the following would correctly represent the result ? Justify your choice .

View SolutionA student heats a beaker containing ice and water. He measures the temperature of the content of the beaker as a function of lime. Which of the following would correctly represent the result ? Justify your choice .

View SolutionA block of ice at temperature −20∘C is slowly heated and converted to steam at 100∘C. Which of the following diagram is most appropriate?
View Solutiona block of ice at temperature −20∘C is slowly heated and converted to steam at 100∘C which of the following diagram is most appropriate
View Solutiona block of ice at temperature −20∘C is slowly heated and converted to steam at 100∘C which of the following diagram is most appropriate
View Solution
