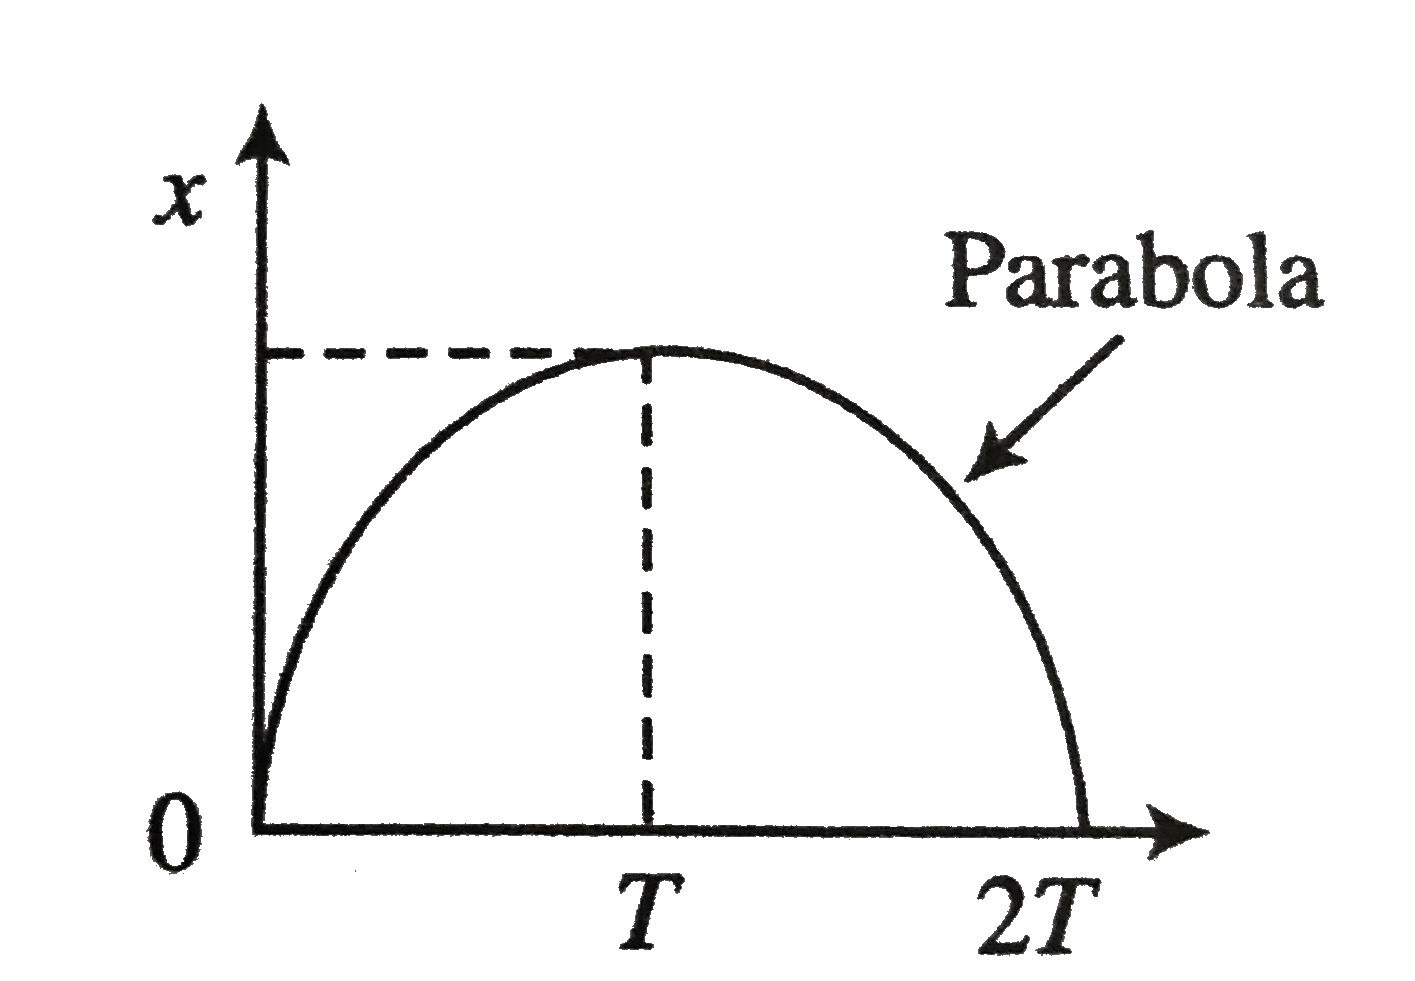
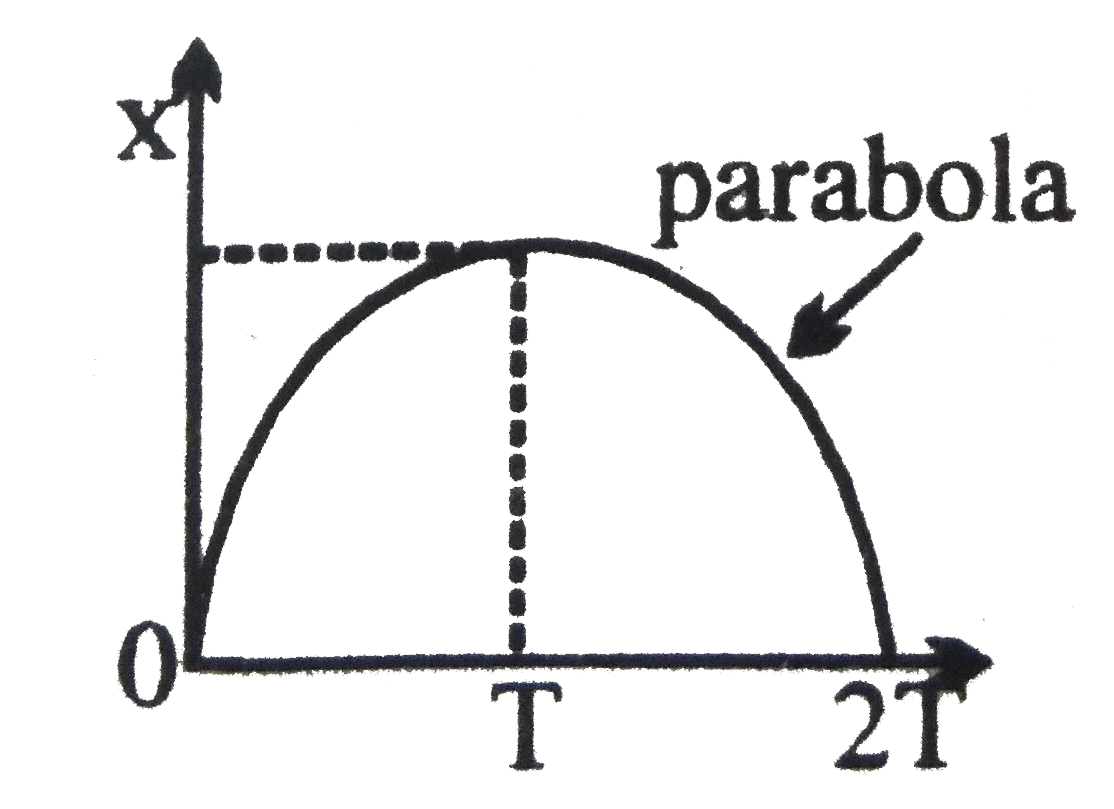
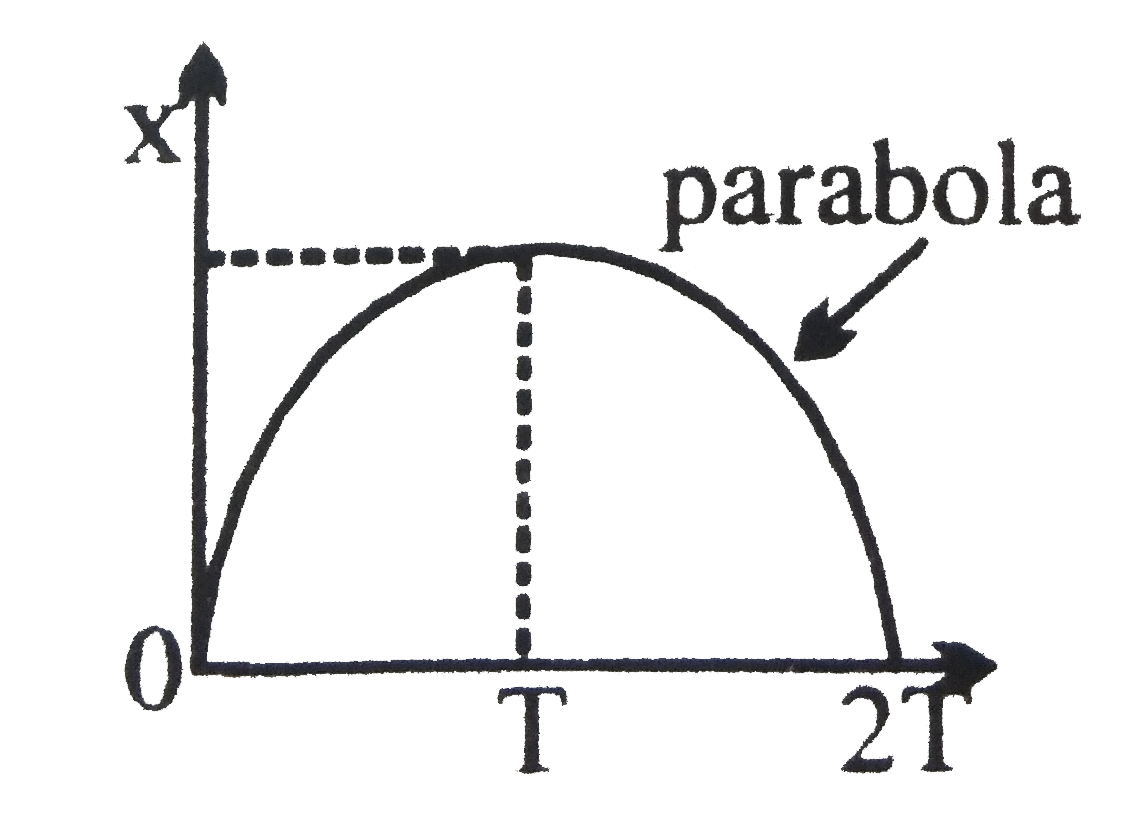
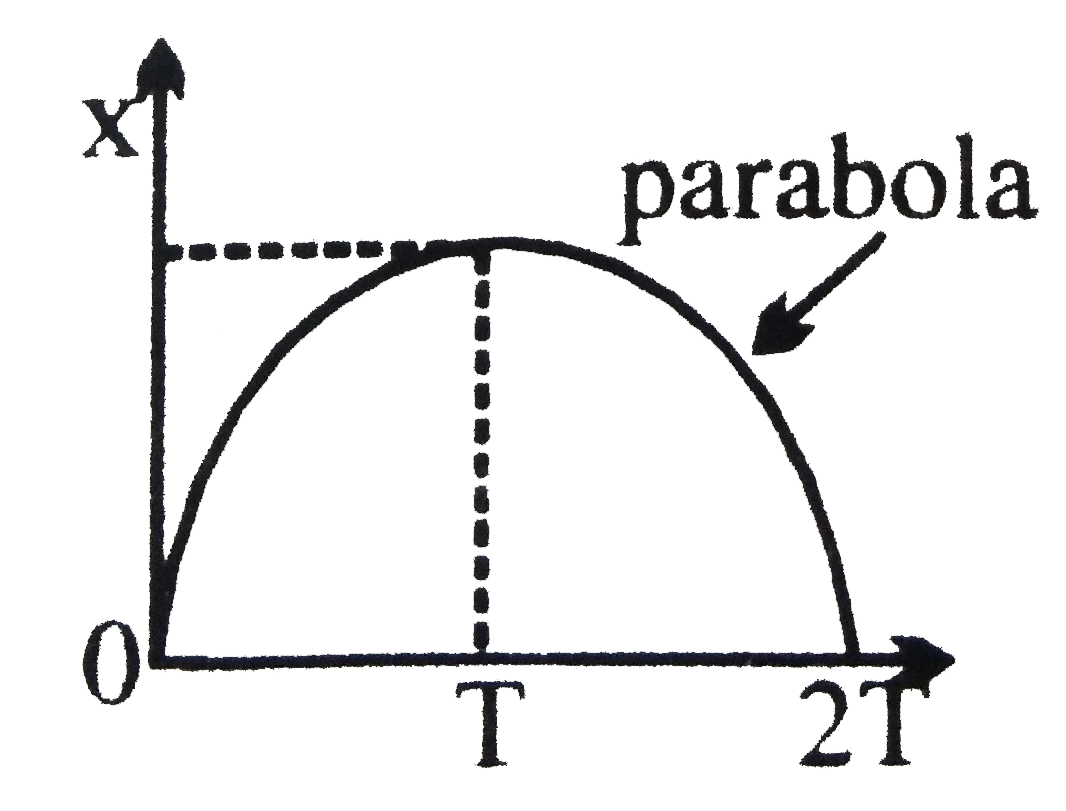
The x-t graph of a particle moving along a straight line is shown in figure

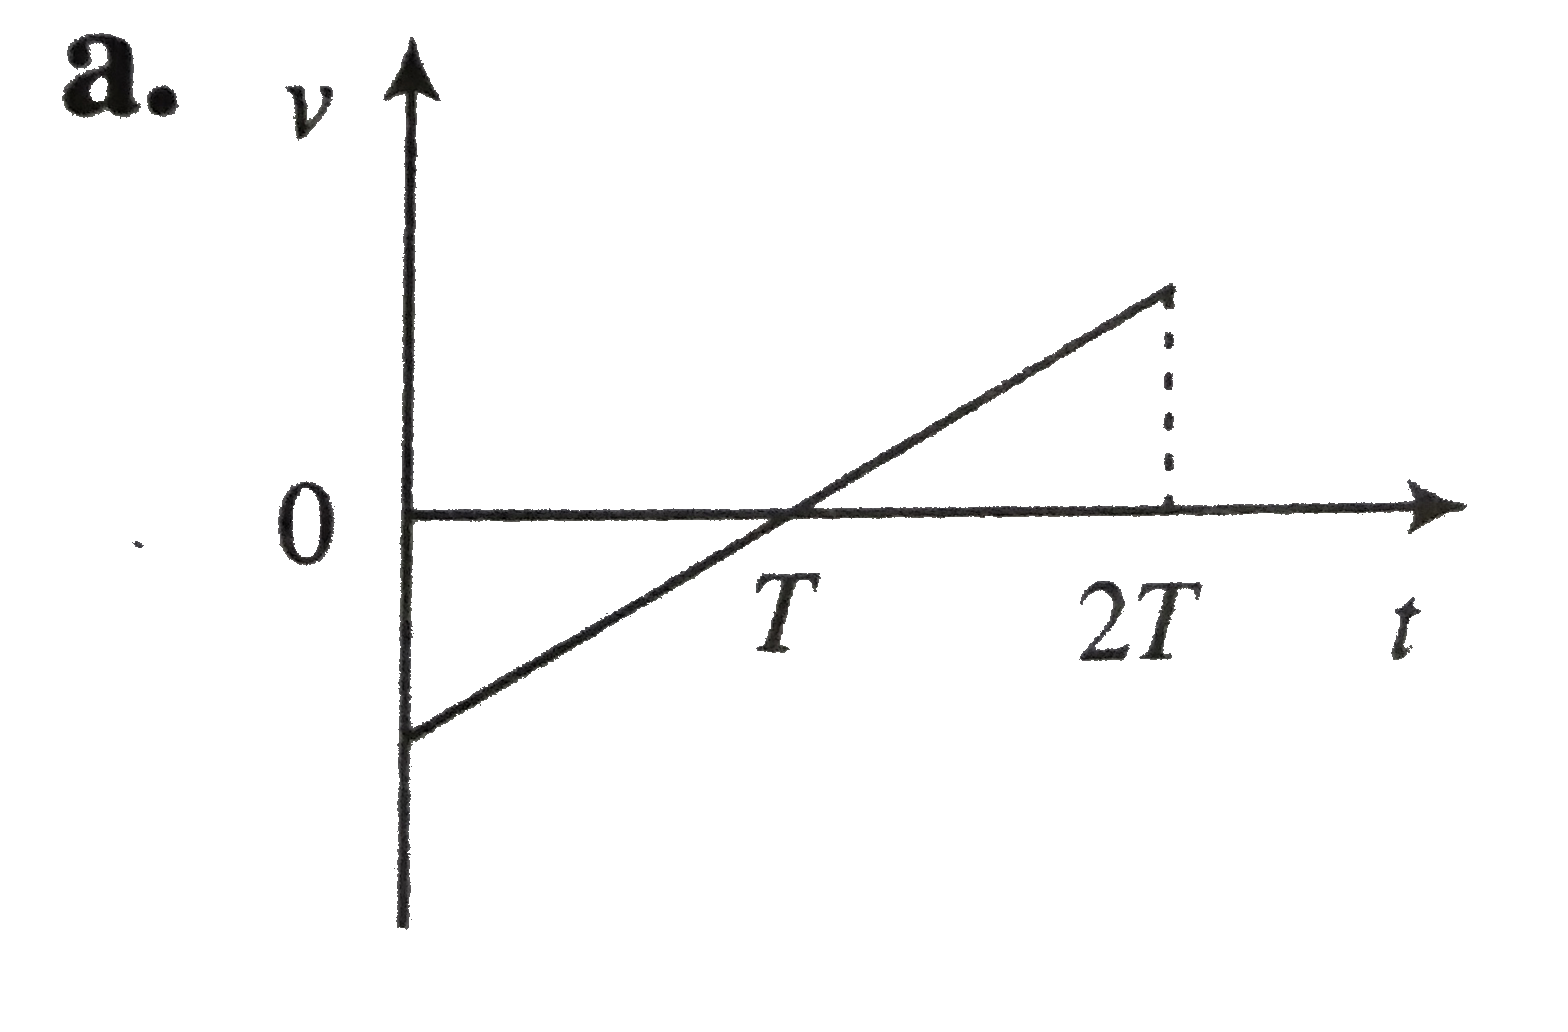
The v-t graph of the particle is correctly shown by
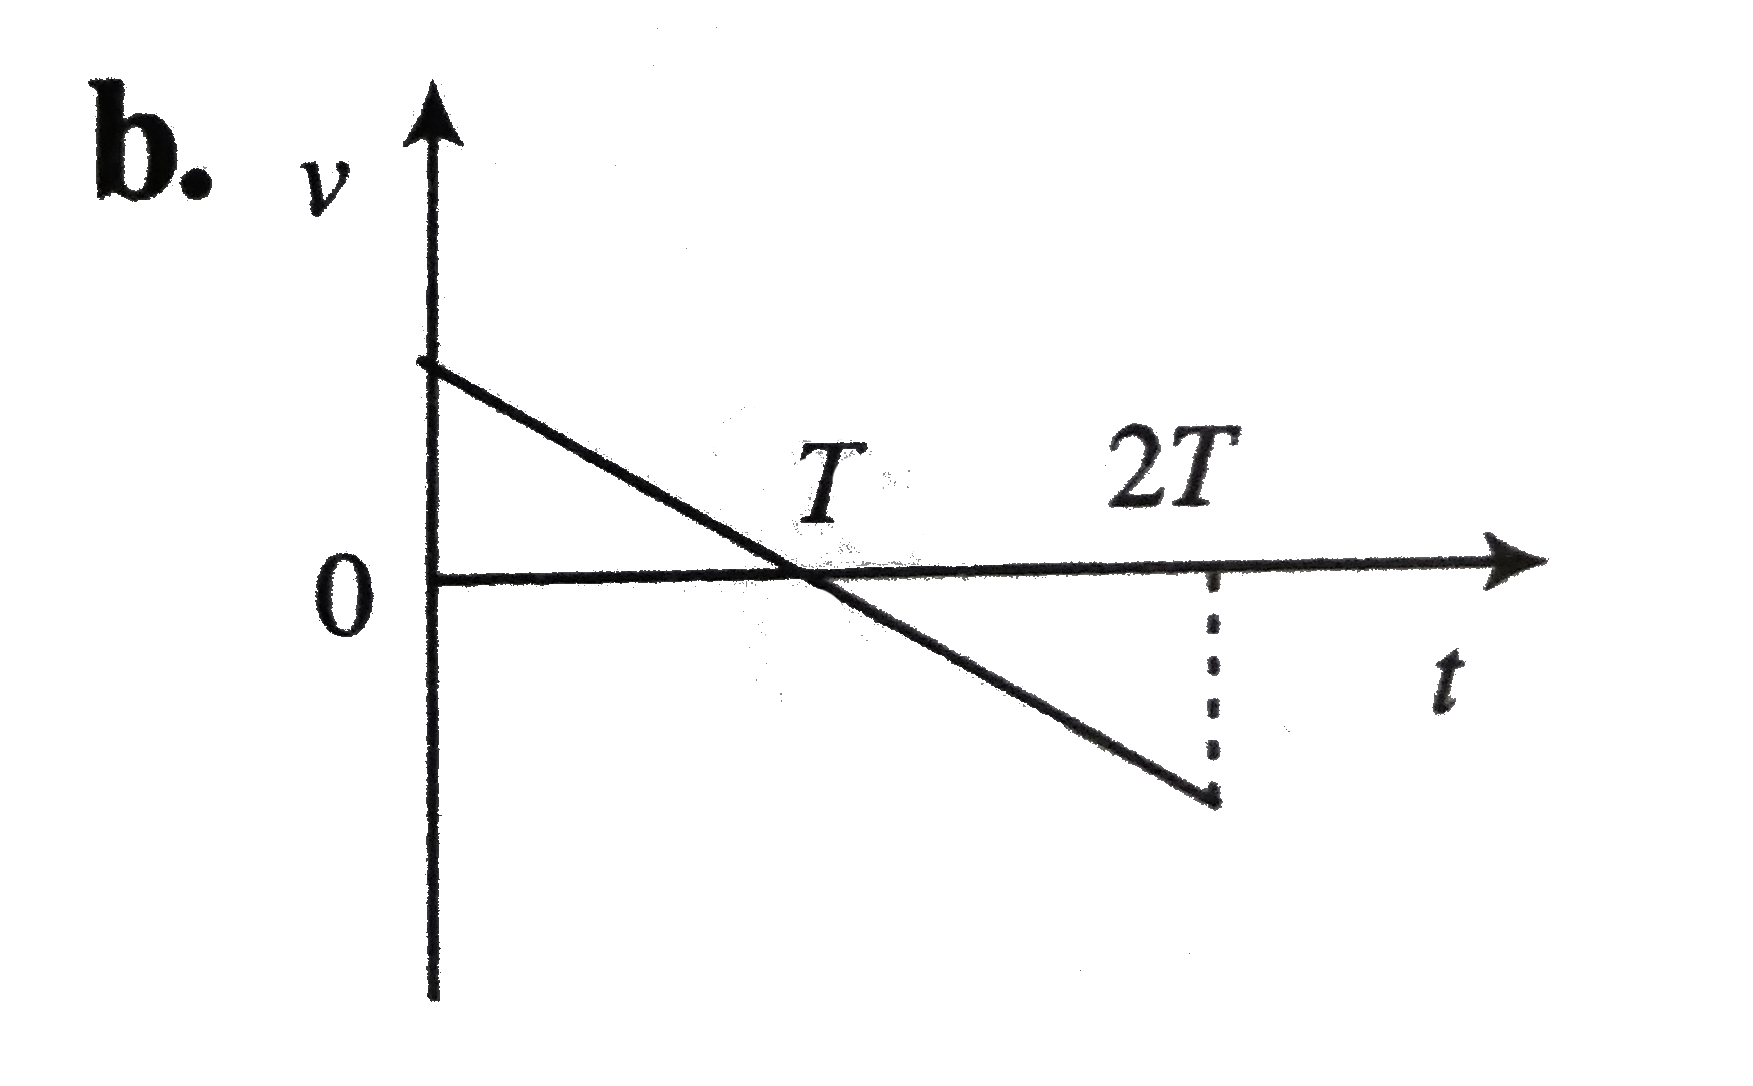
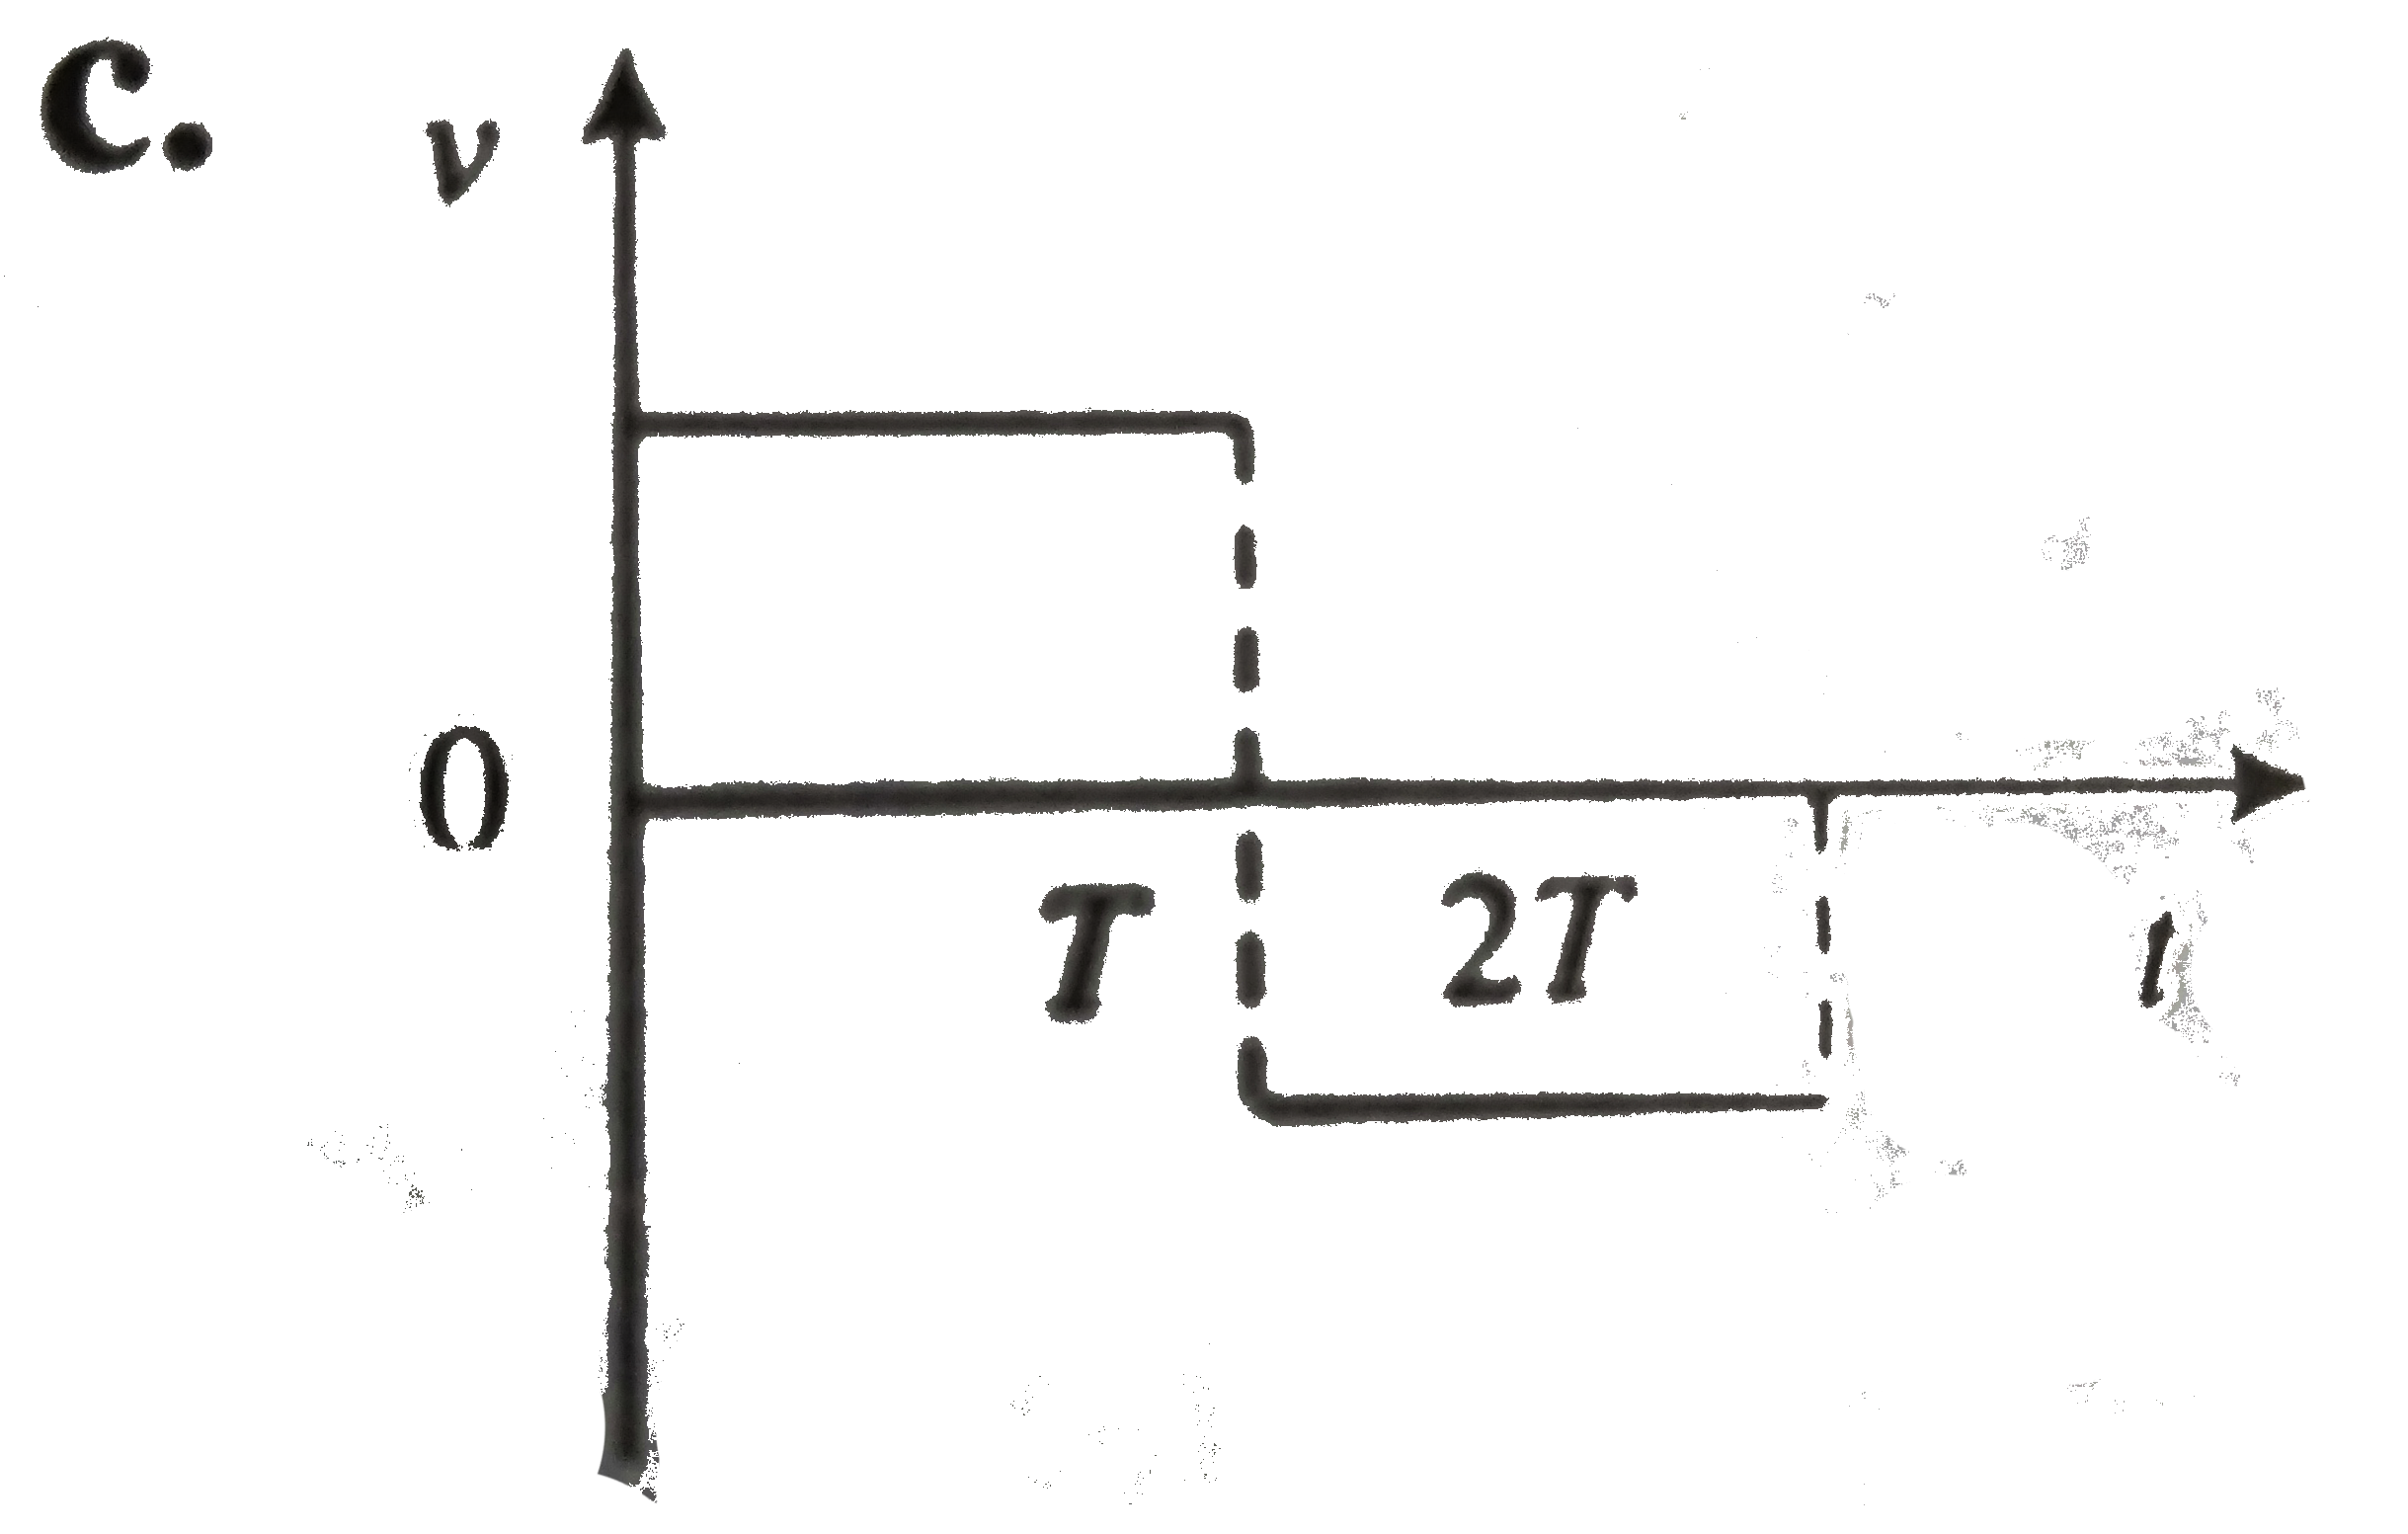
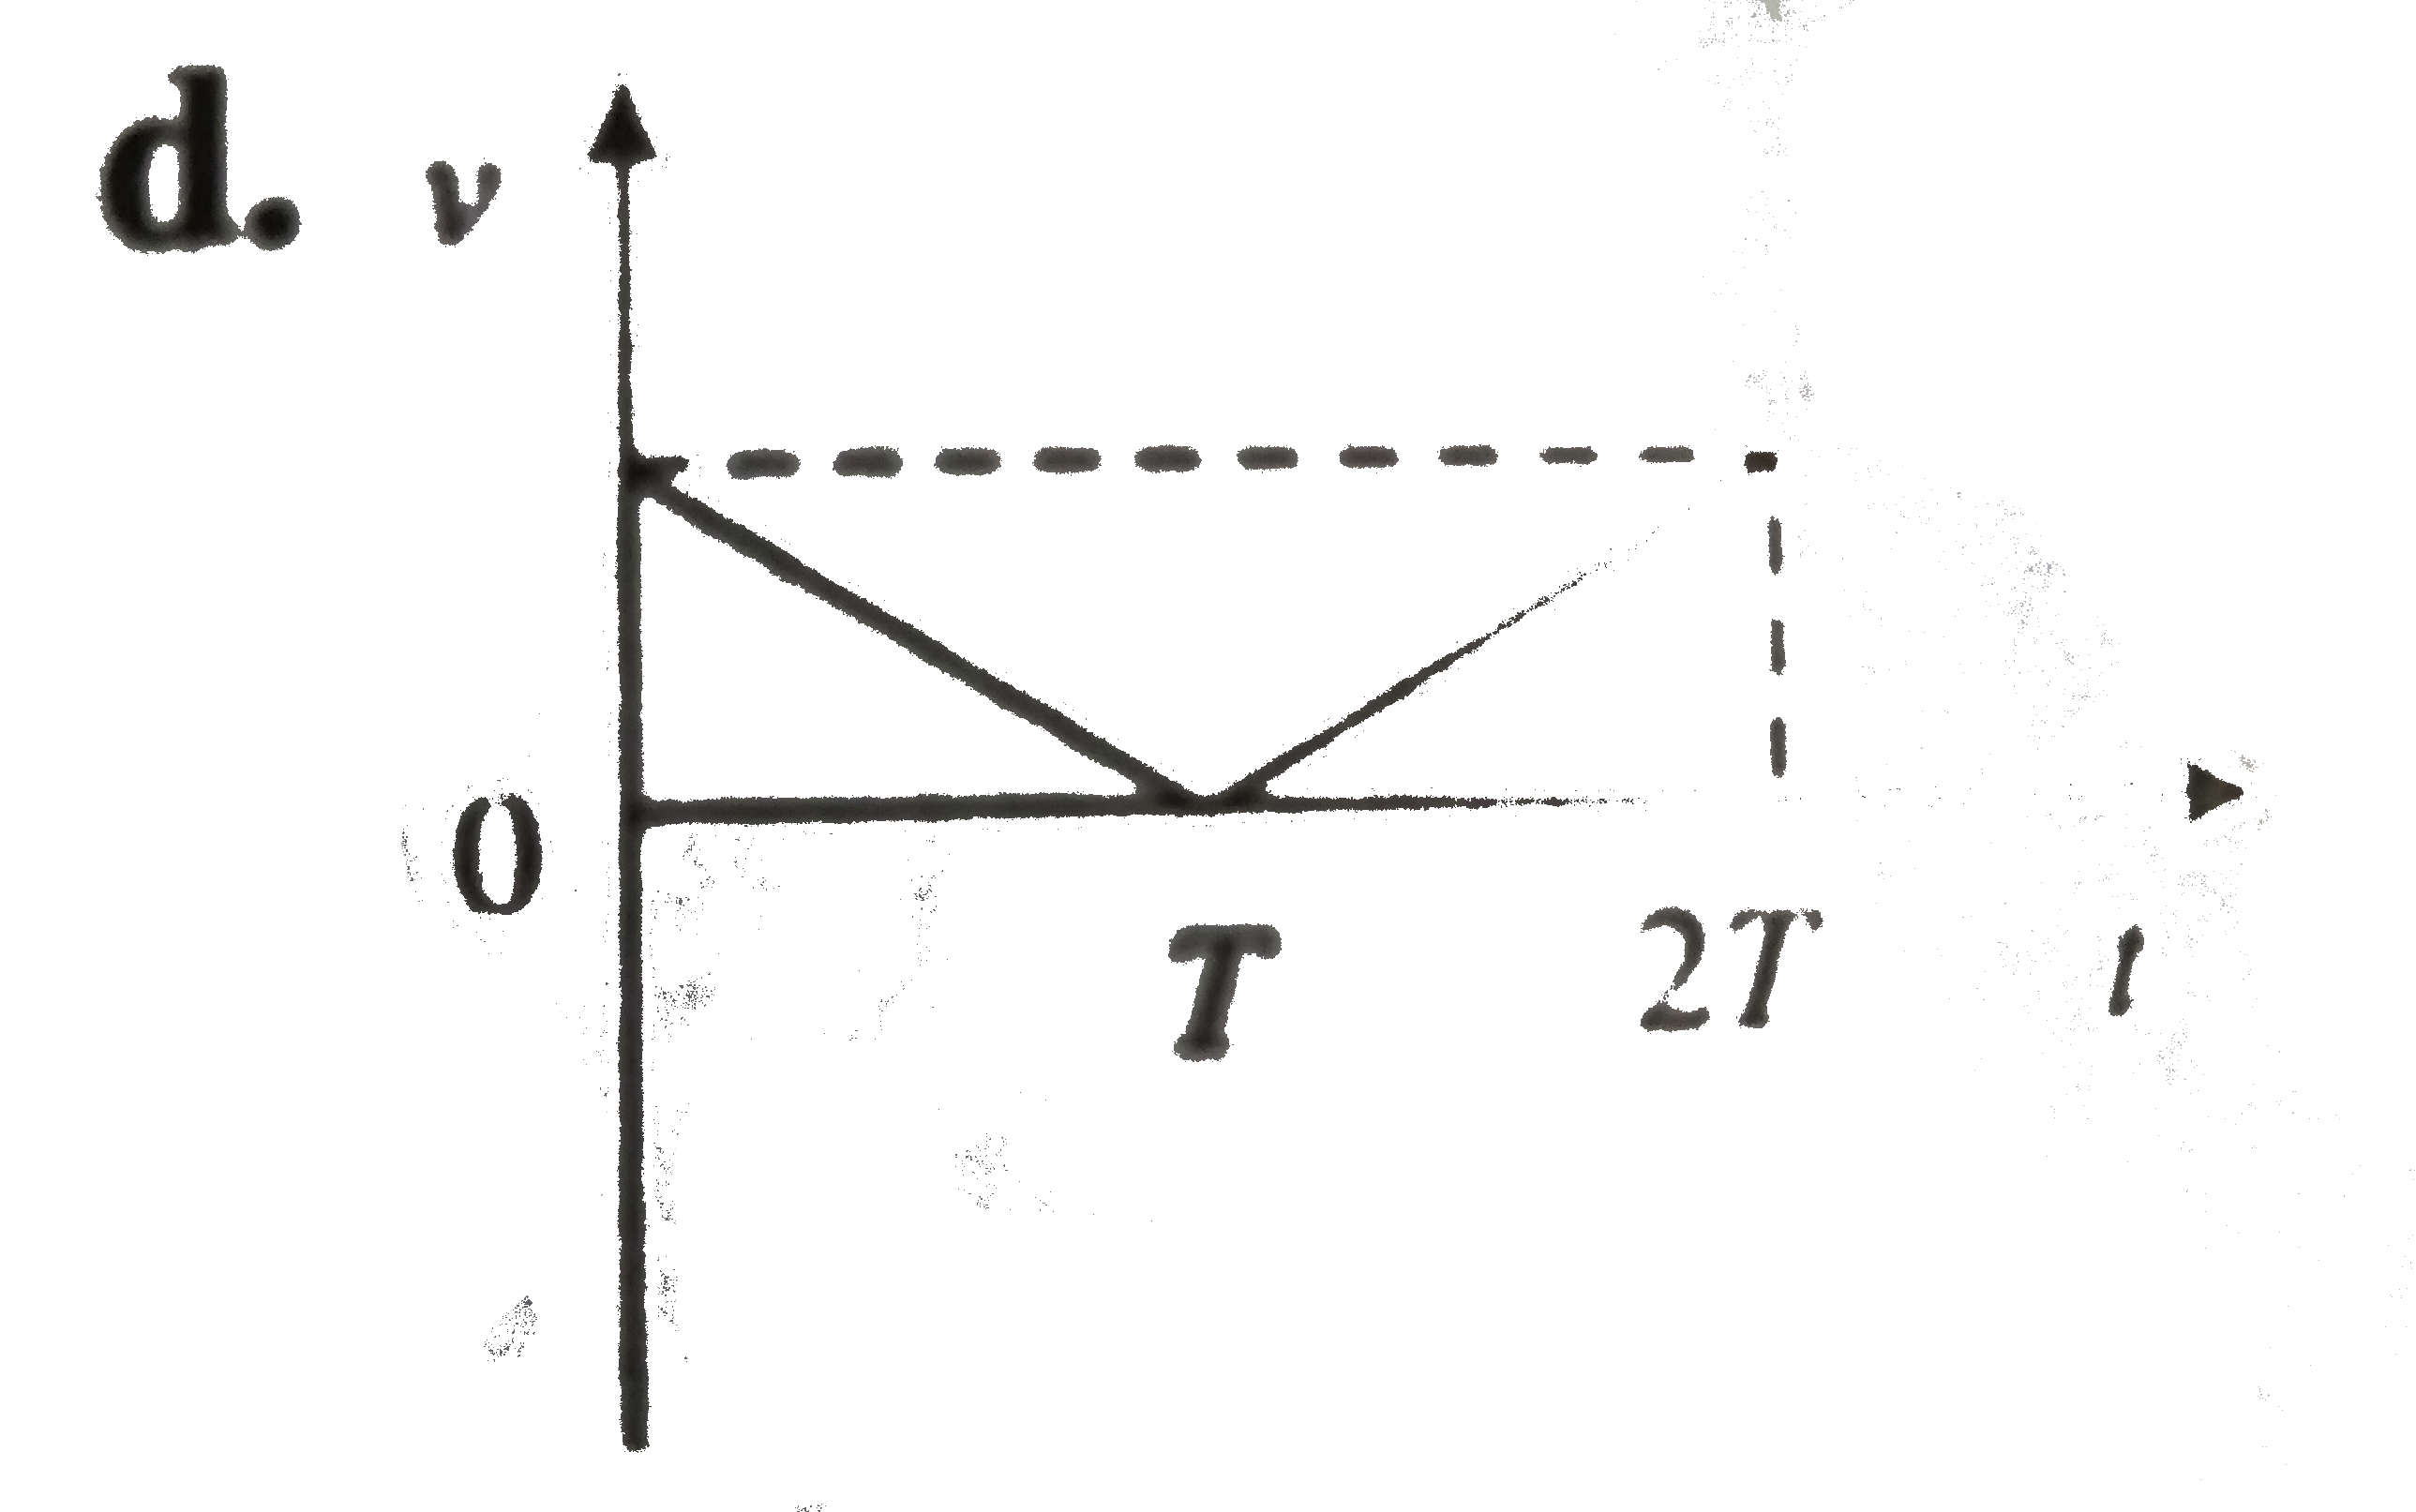
The correct Answer is:B
b. Since the x-t graph is parabolic, its slope (velocity) should
change linearly. At t = 0, slope is positive, so velocity should
be positive. At t = T, slope is zero, so velocity should be zero .
At t = 0 , slope is negative, so velocity should be negative.
Topper's Solved these Questions
- MISCELLANEOUS KINEMATICSBOOK - CENGAGE PHYSICSCHAPTER - MISCELLANEOUS KINEMATICSEXERCISE - Integer Type
17 Videos
- MISCELLANEOUS KINEMATICSBOOK - CENGAGE PHYSICSCHAPTER - MISCELLANEOUS KINEMATICSEXERCISE - Fill in the blanks
4 Videos
- MISCELLANEOUS KINEMATICSBOOK - CENGAGE PHYSICSCHAPTER - MISCELLANEOUS KINEMATICSEXERCISE - Multiple Correct Answer Type
26 Videos
- LINEAR AND ANGULAR SIMPLE HARMONIC MOTIONBOOK - CENGAGE PHYSICSCHAPTER - LINEAR AND ANGULAR SIMPLE HARMONIC MOTIONEXERCISE - Multiple Correct Answer Type
9 Videos
- MISCELLANEOUS VOLUME 2BOOK - CENGAGE PHYSICSCHAPTER - MISCELLANEOUS VOLUME 2EXERCISE - INTEGER_TYPE
10 Videos
Similar Questions
Knowledge Check
The x-t graph of a particle moving along a straight line is shown in figure
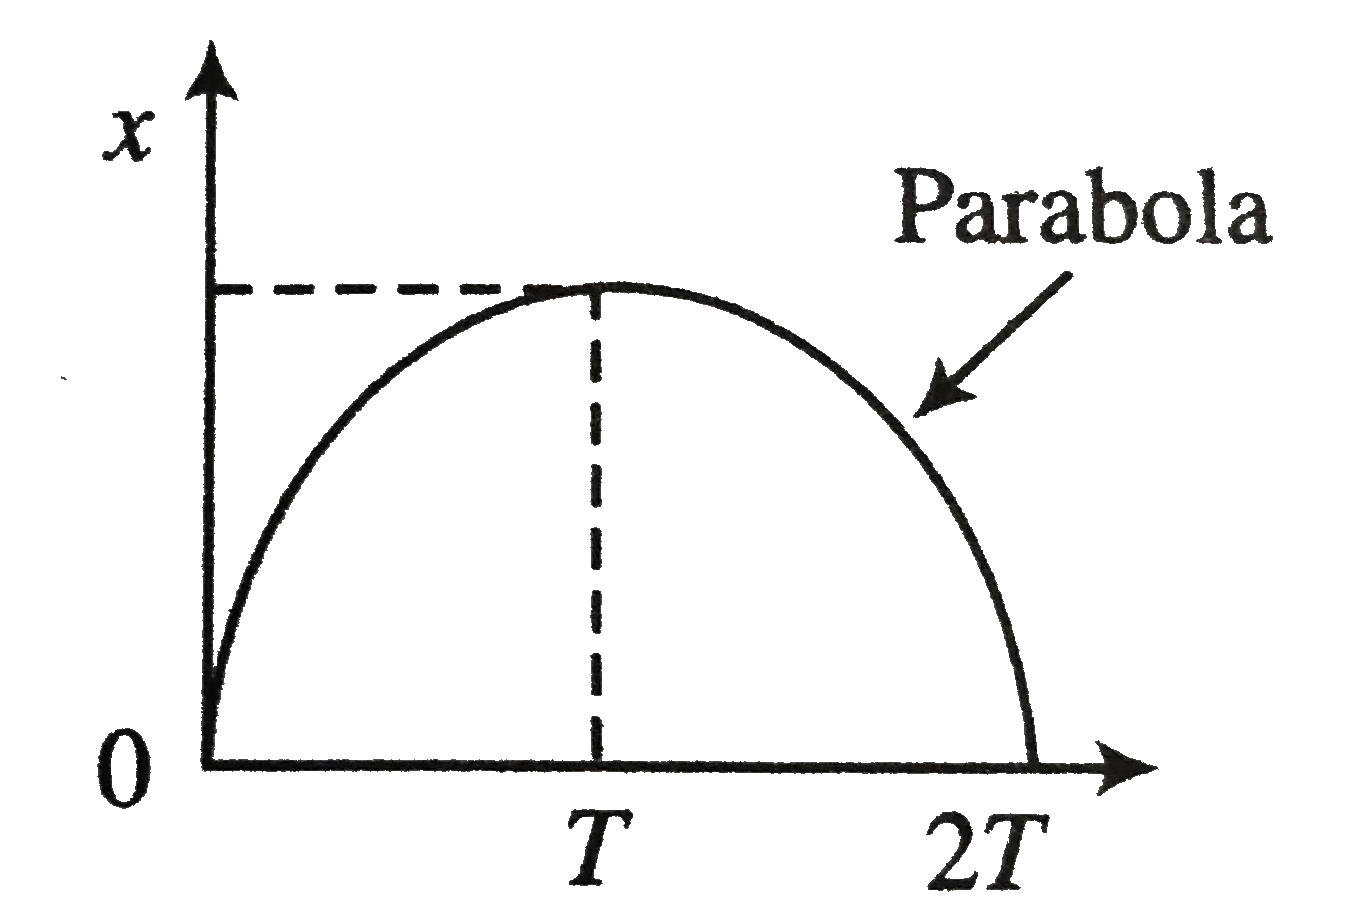
The a-t graph of the particle is correctly shown byA B
B C
C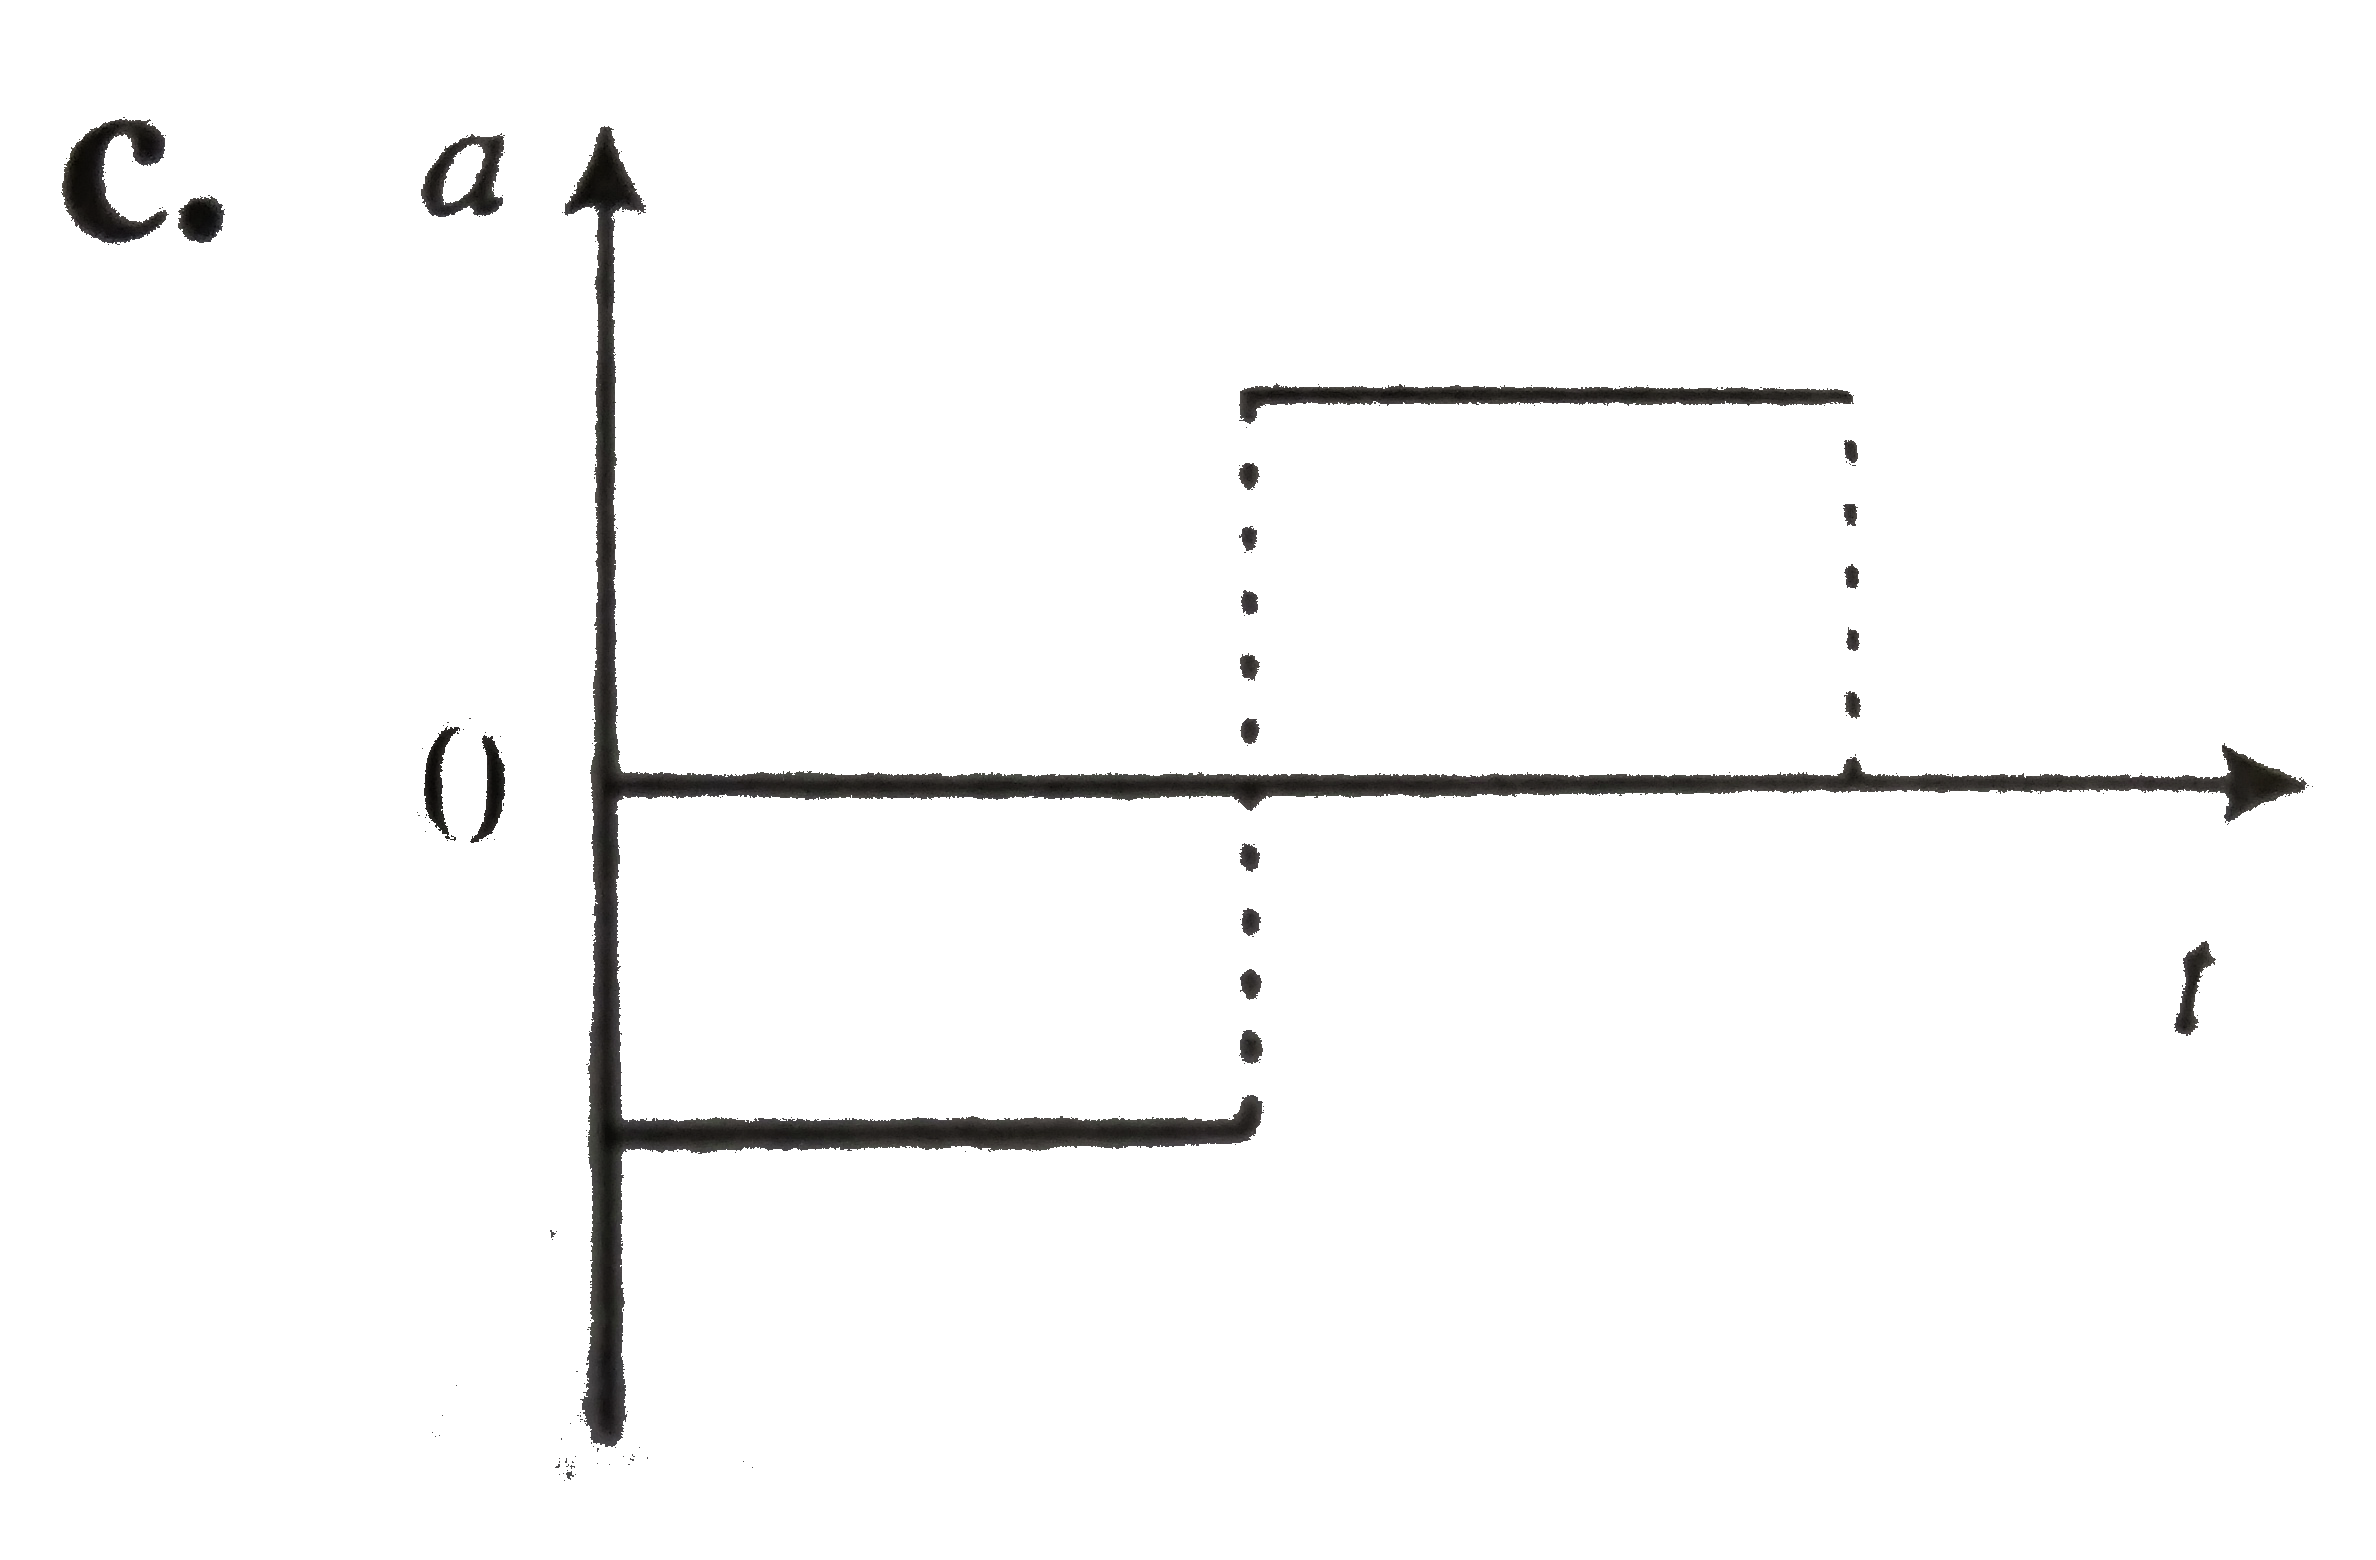 D
D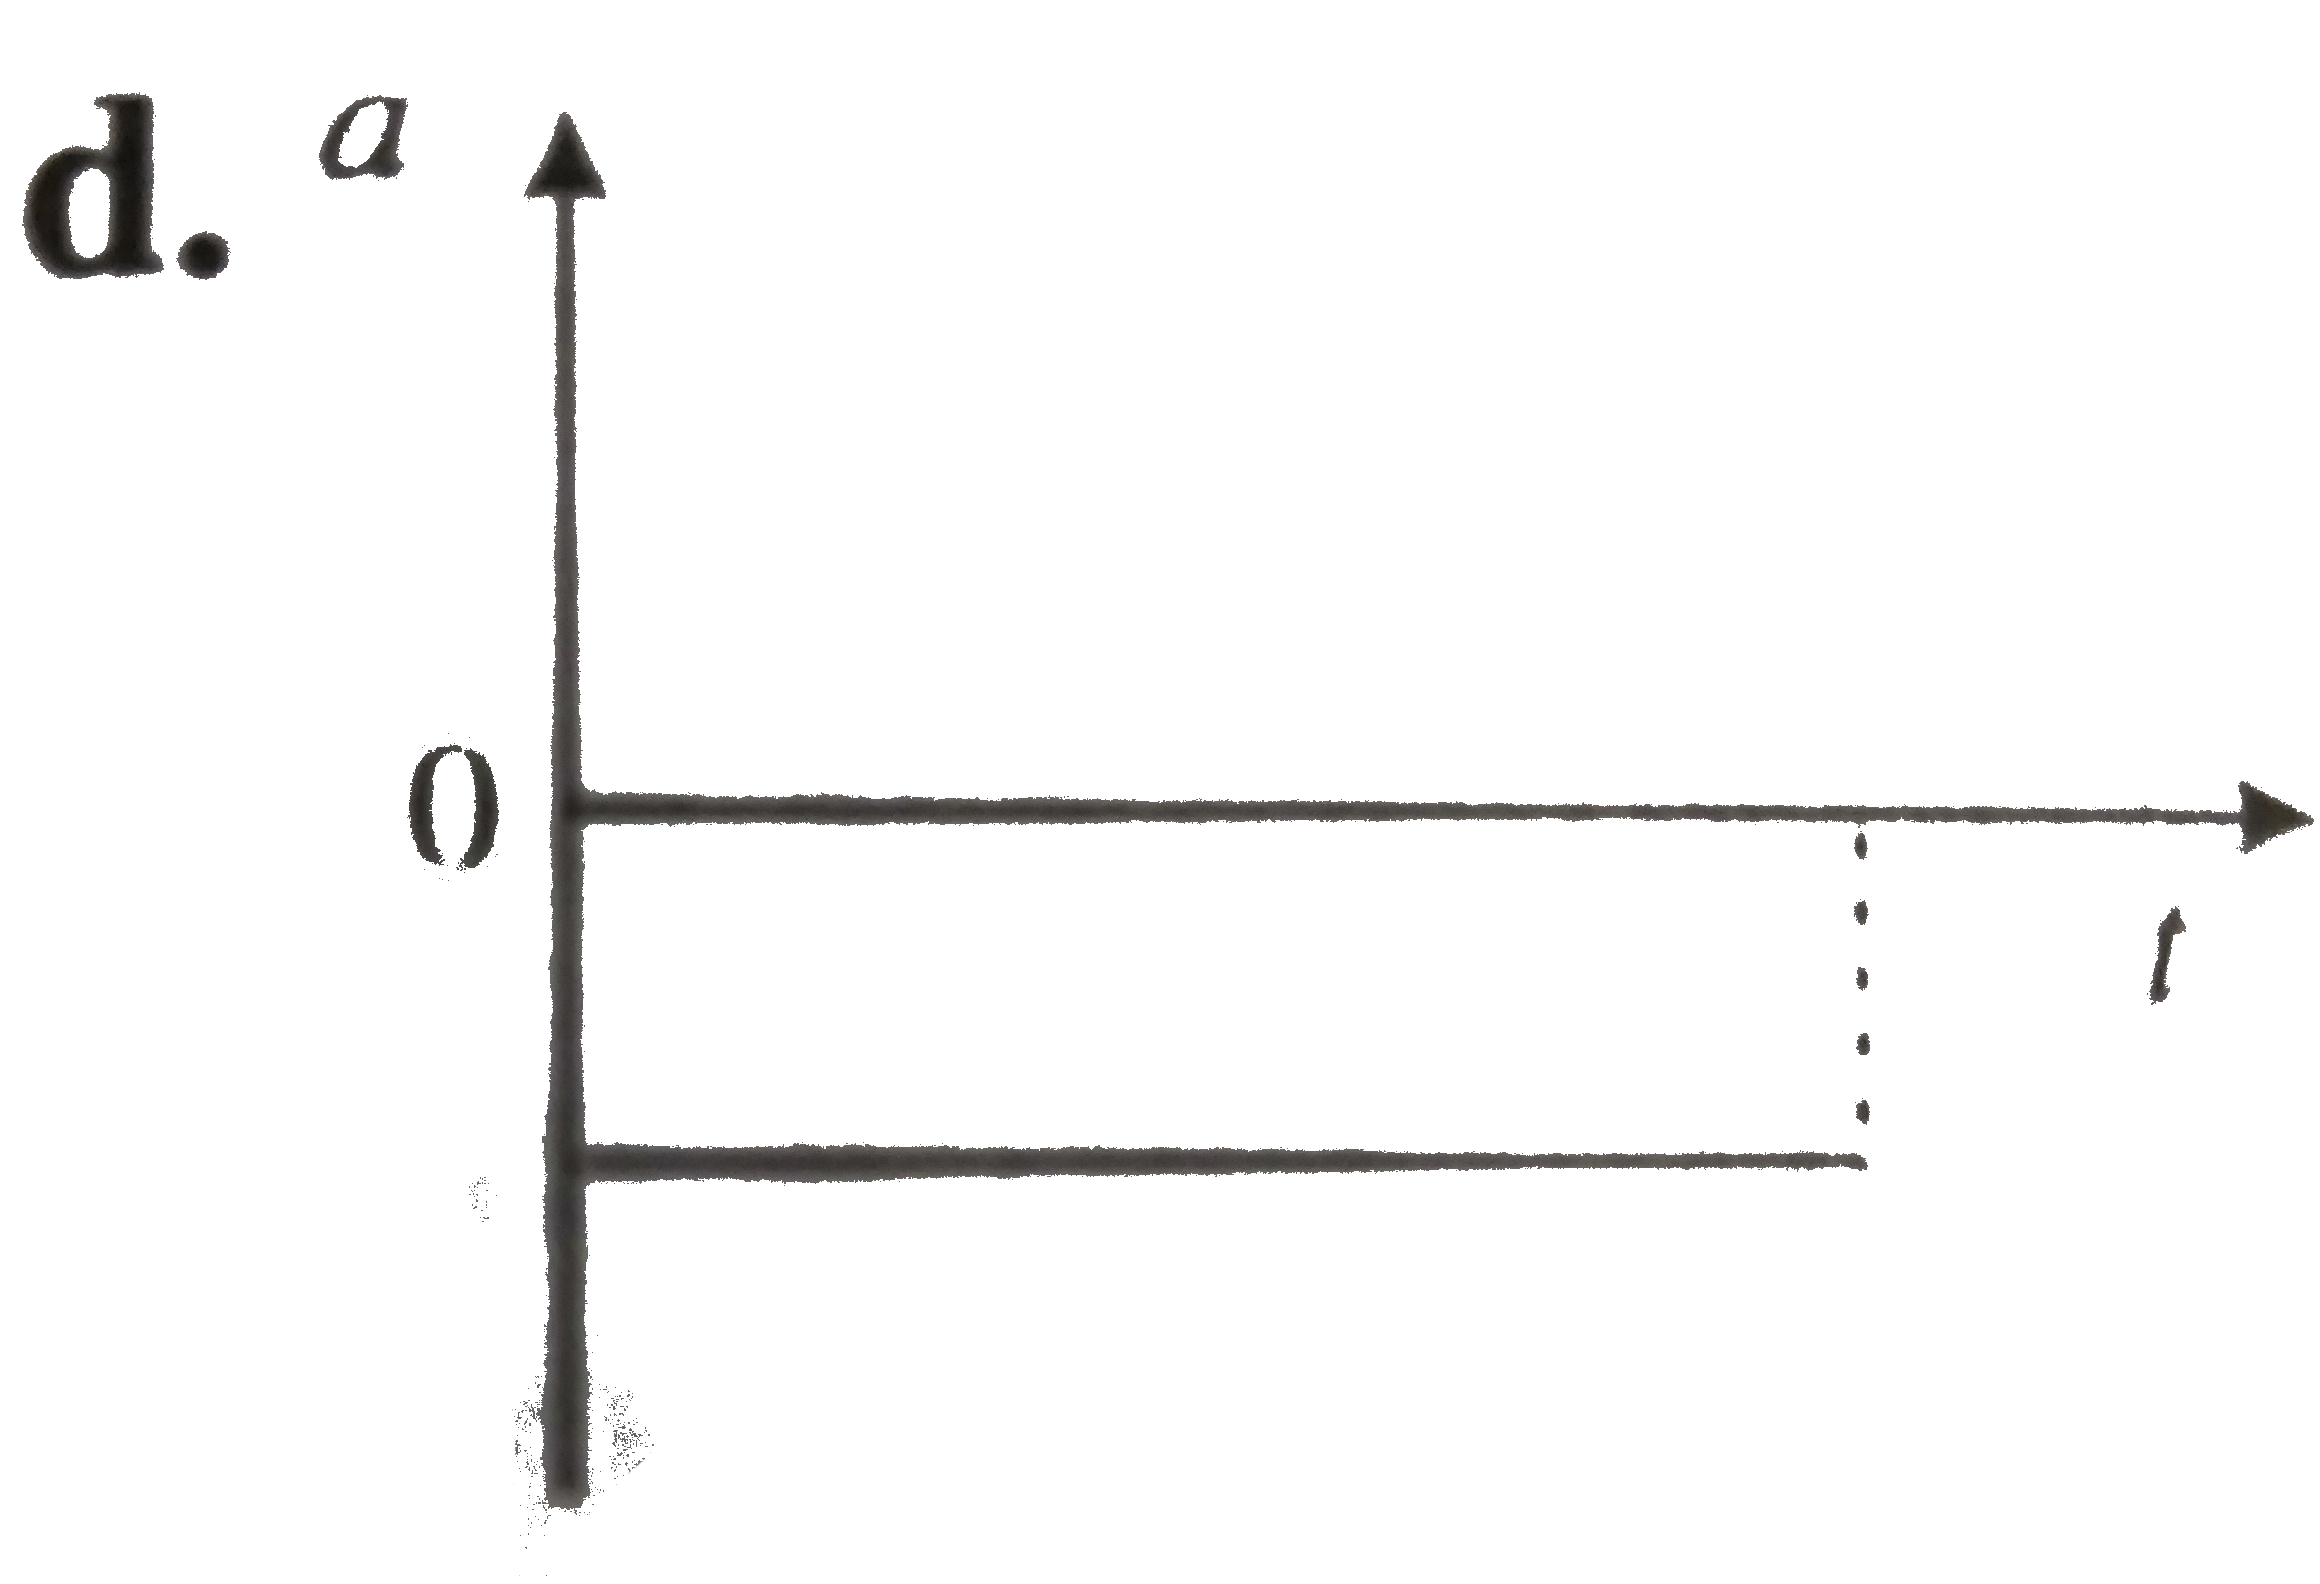
The x−t graph of particle moving along a straight line is shown in figure
The v−t graph of the particles is correctly shown byA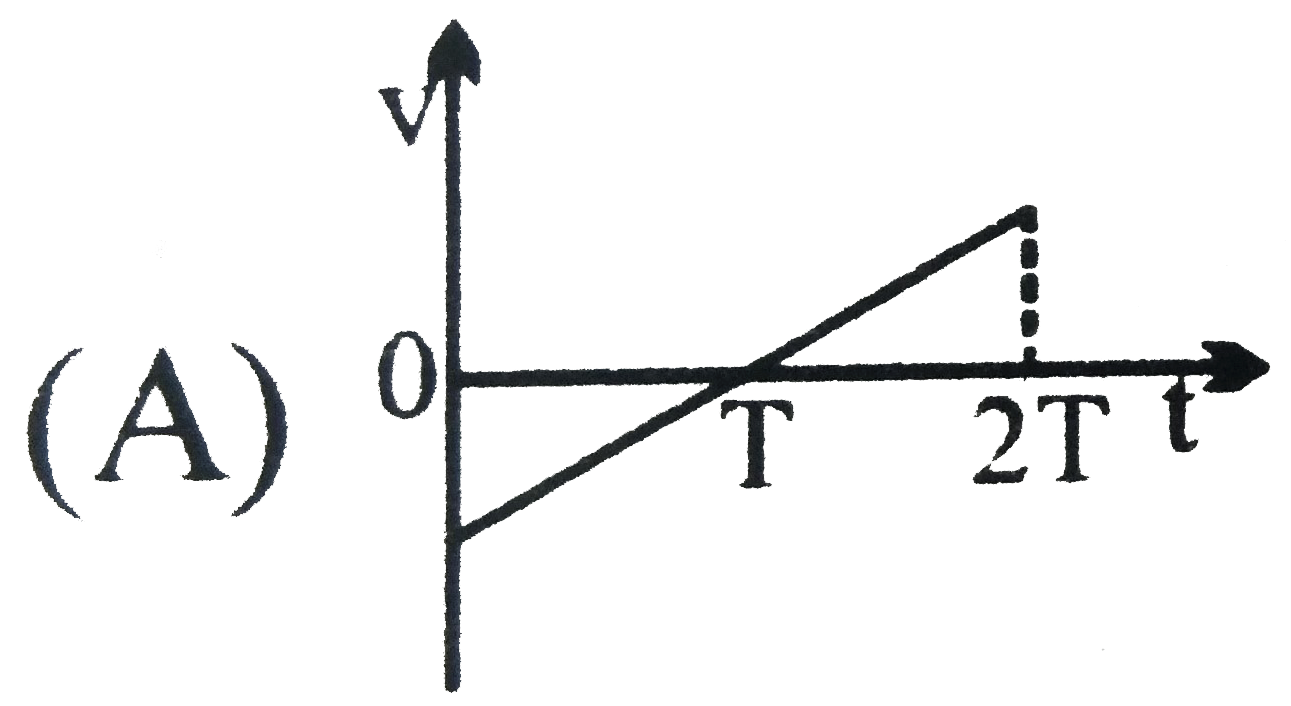 B
B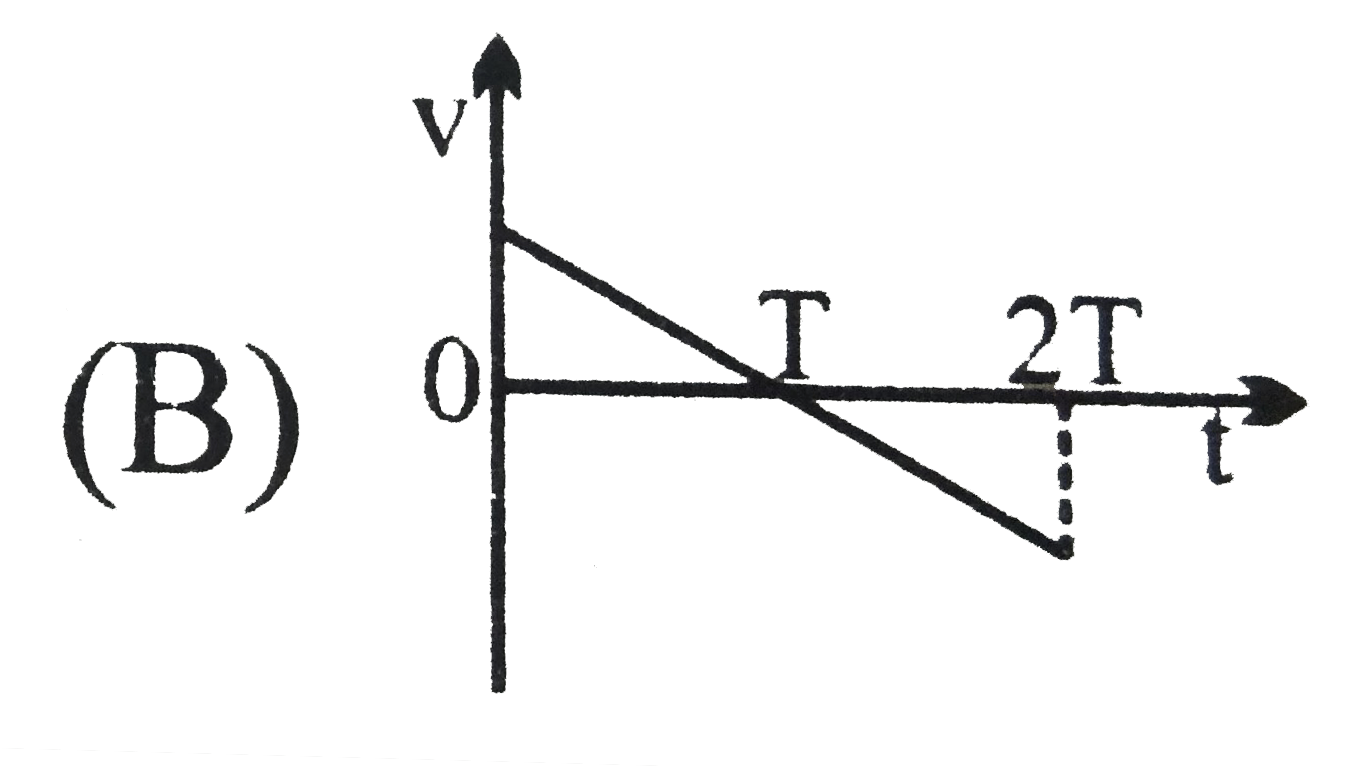 C
C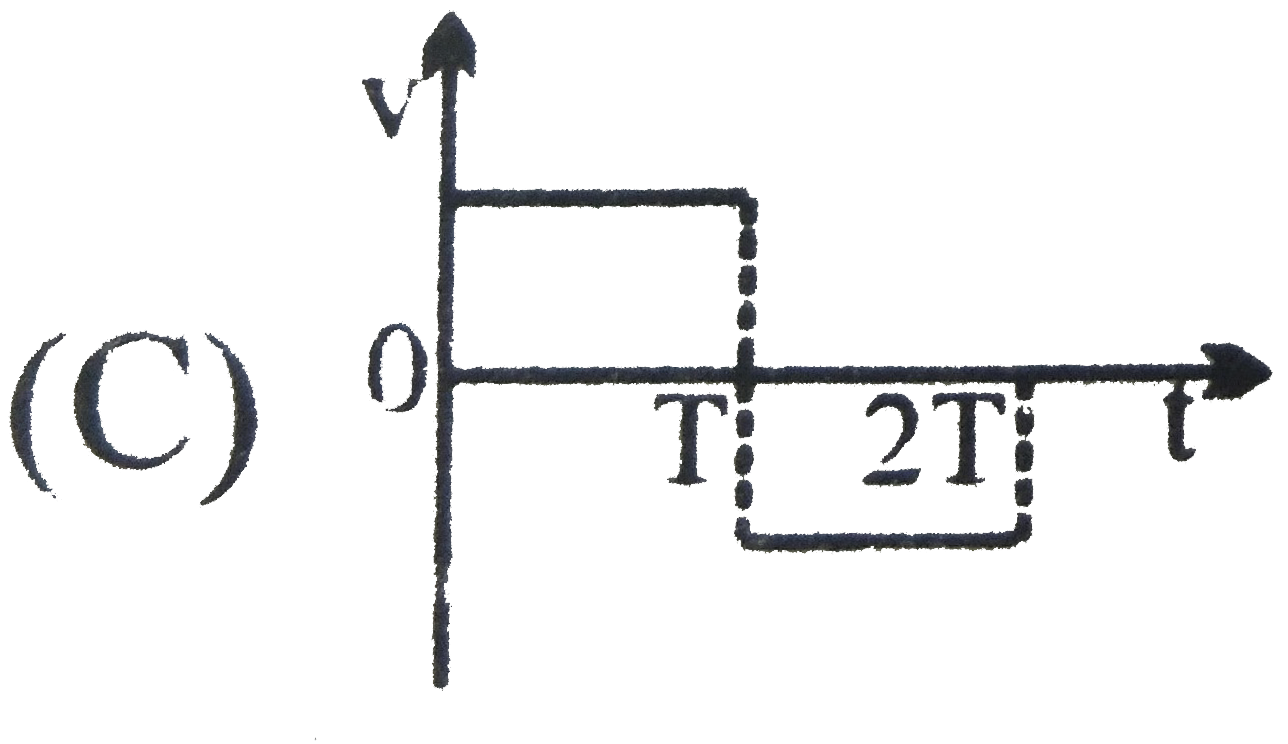 D
D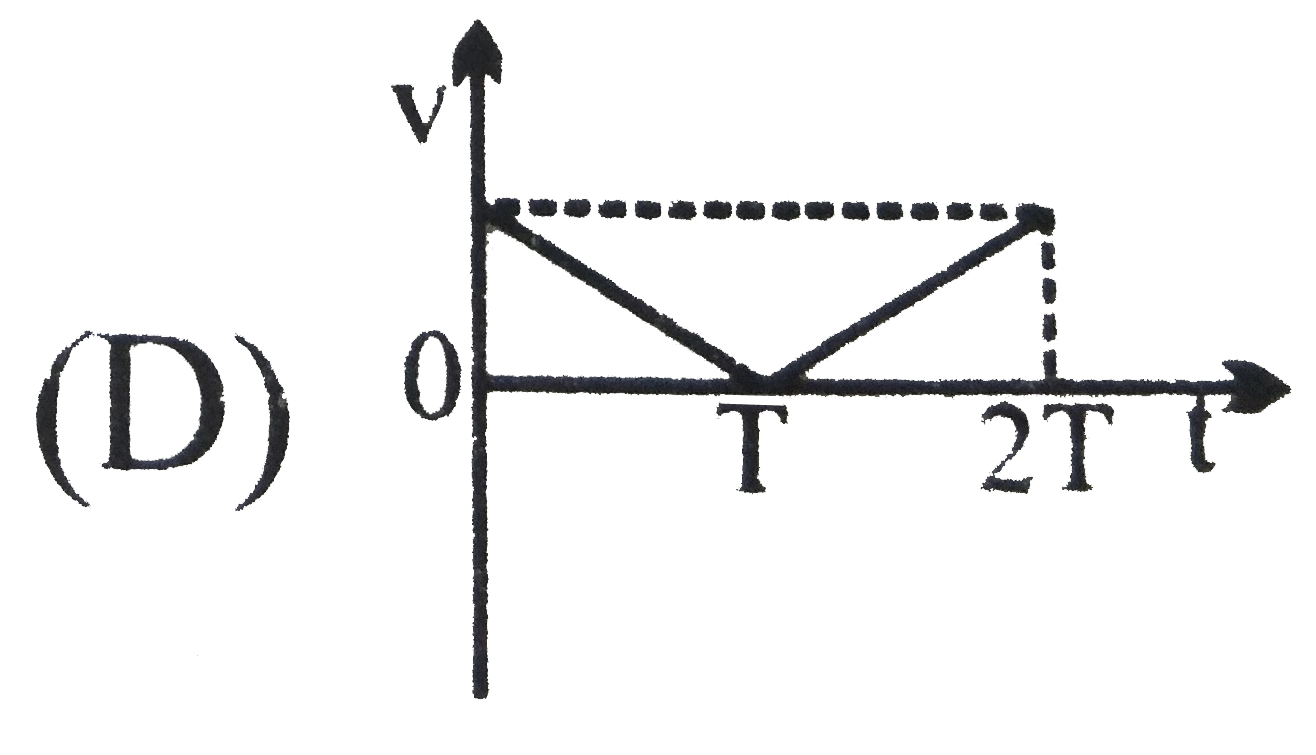
The x−t graph of particle moving along a straight line is shown in figure
The a−t graph of the particle is correctly shown byA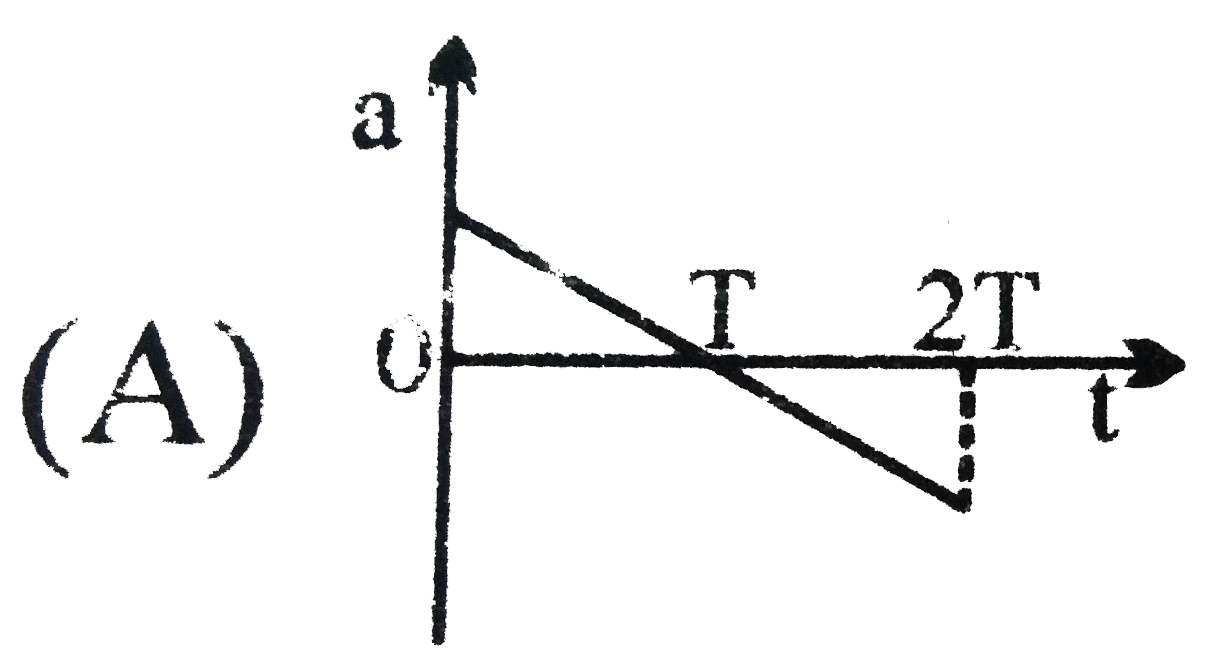 B
B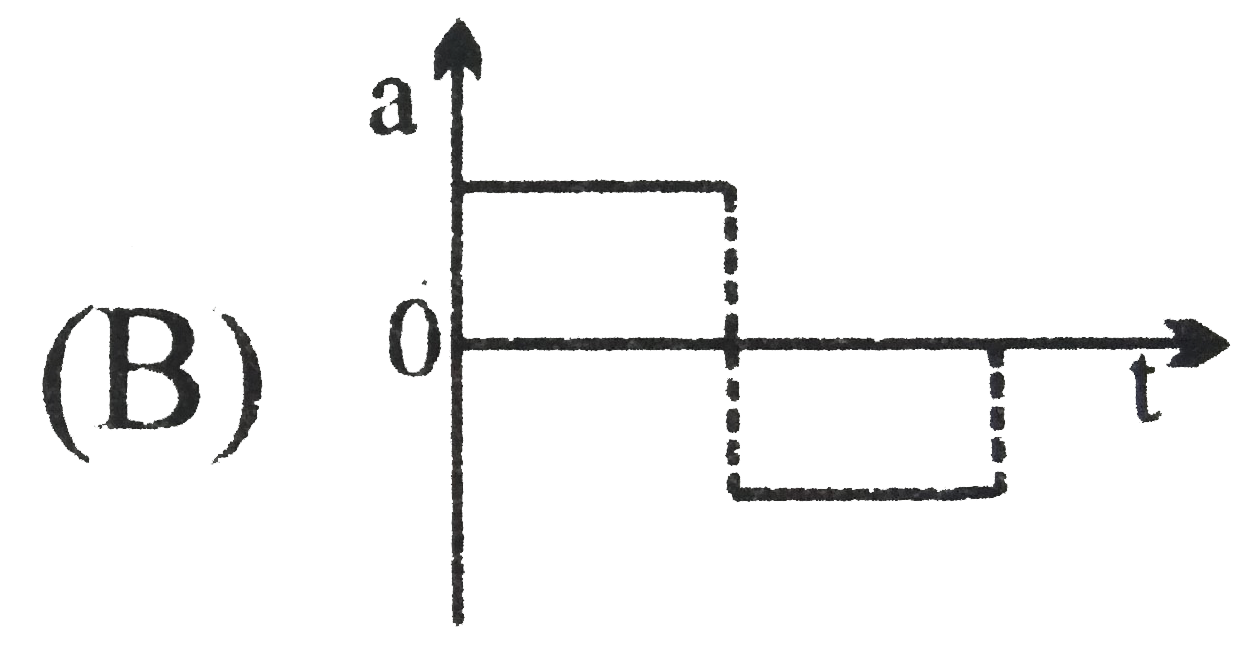 C
C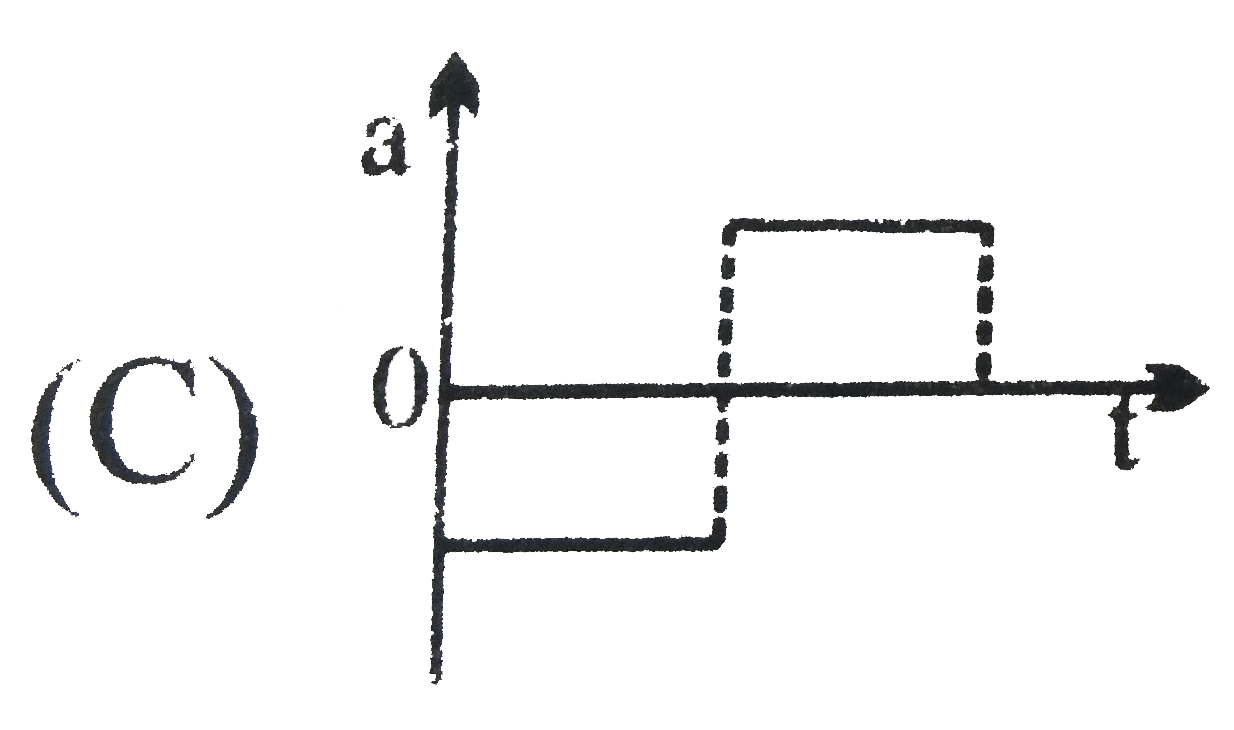 D
D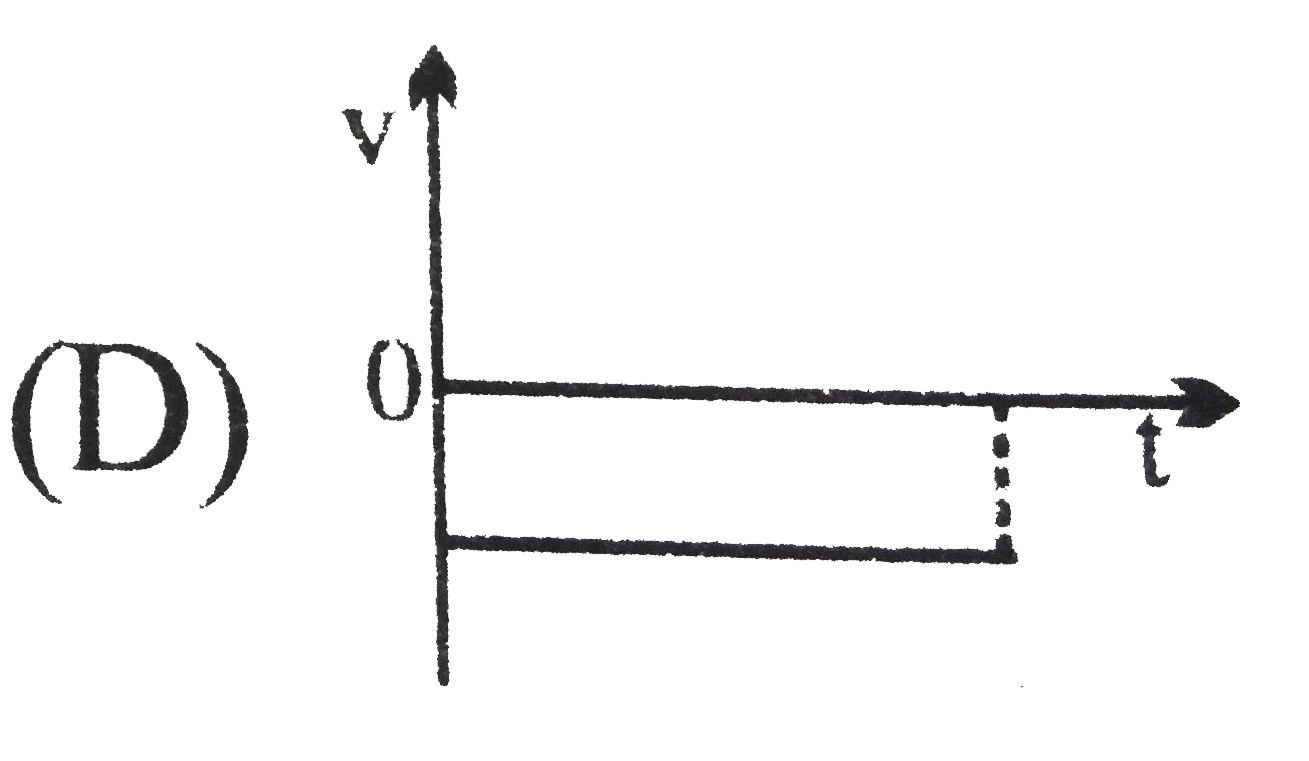
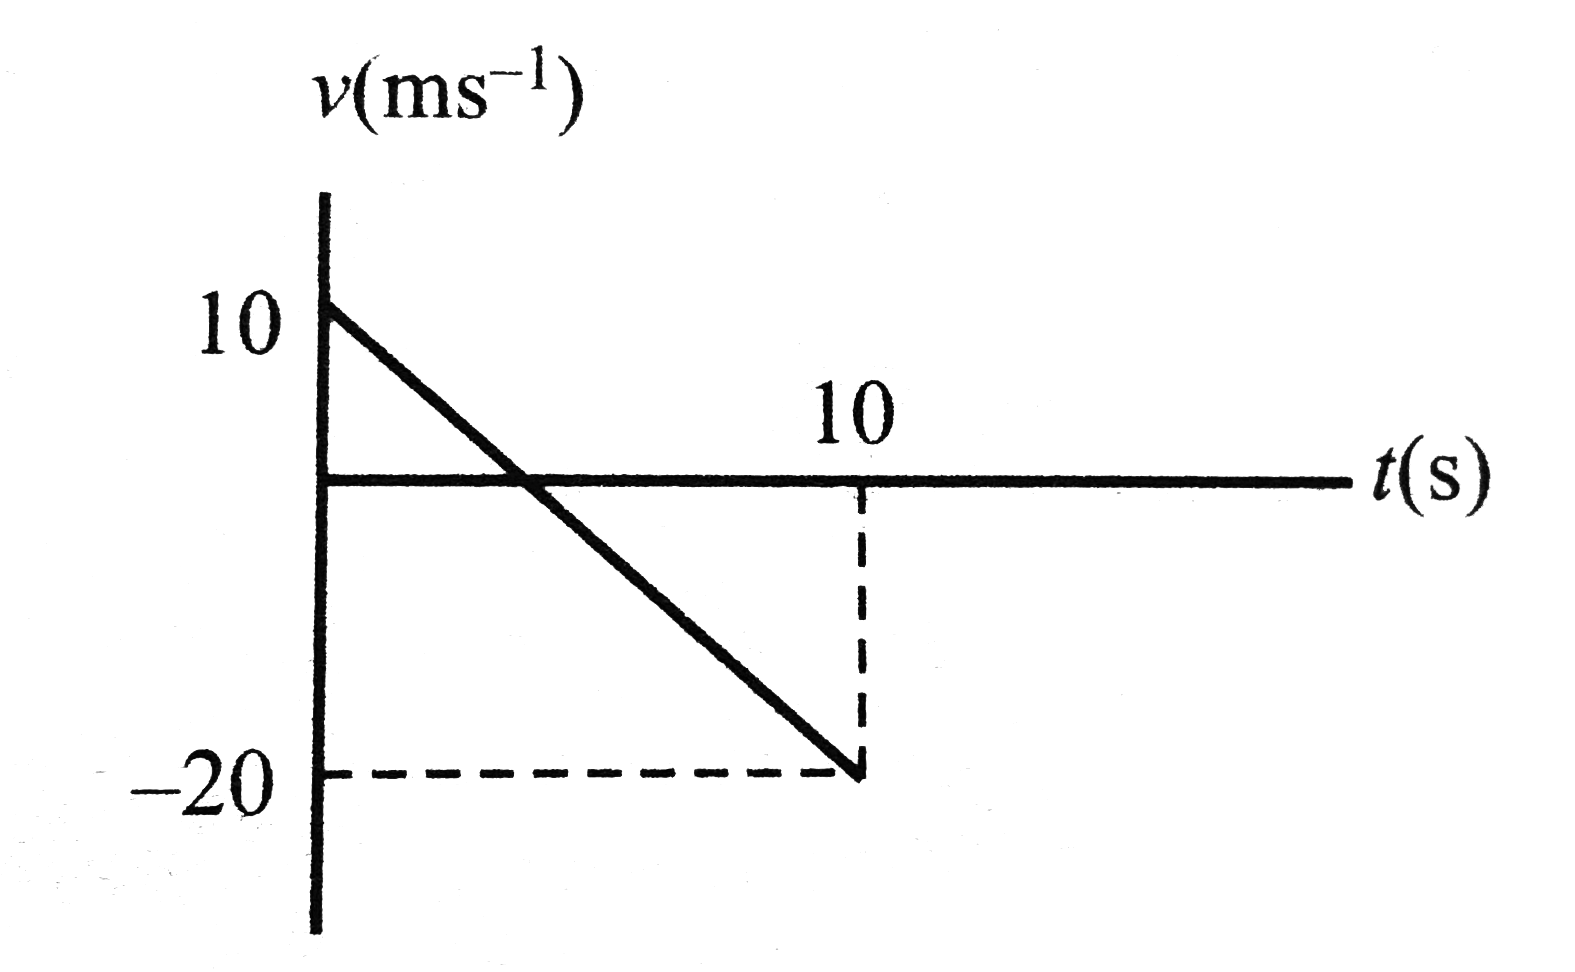
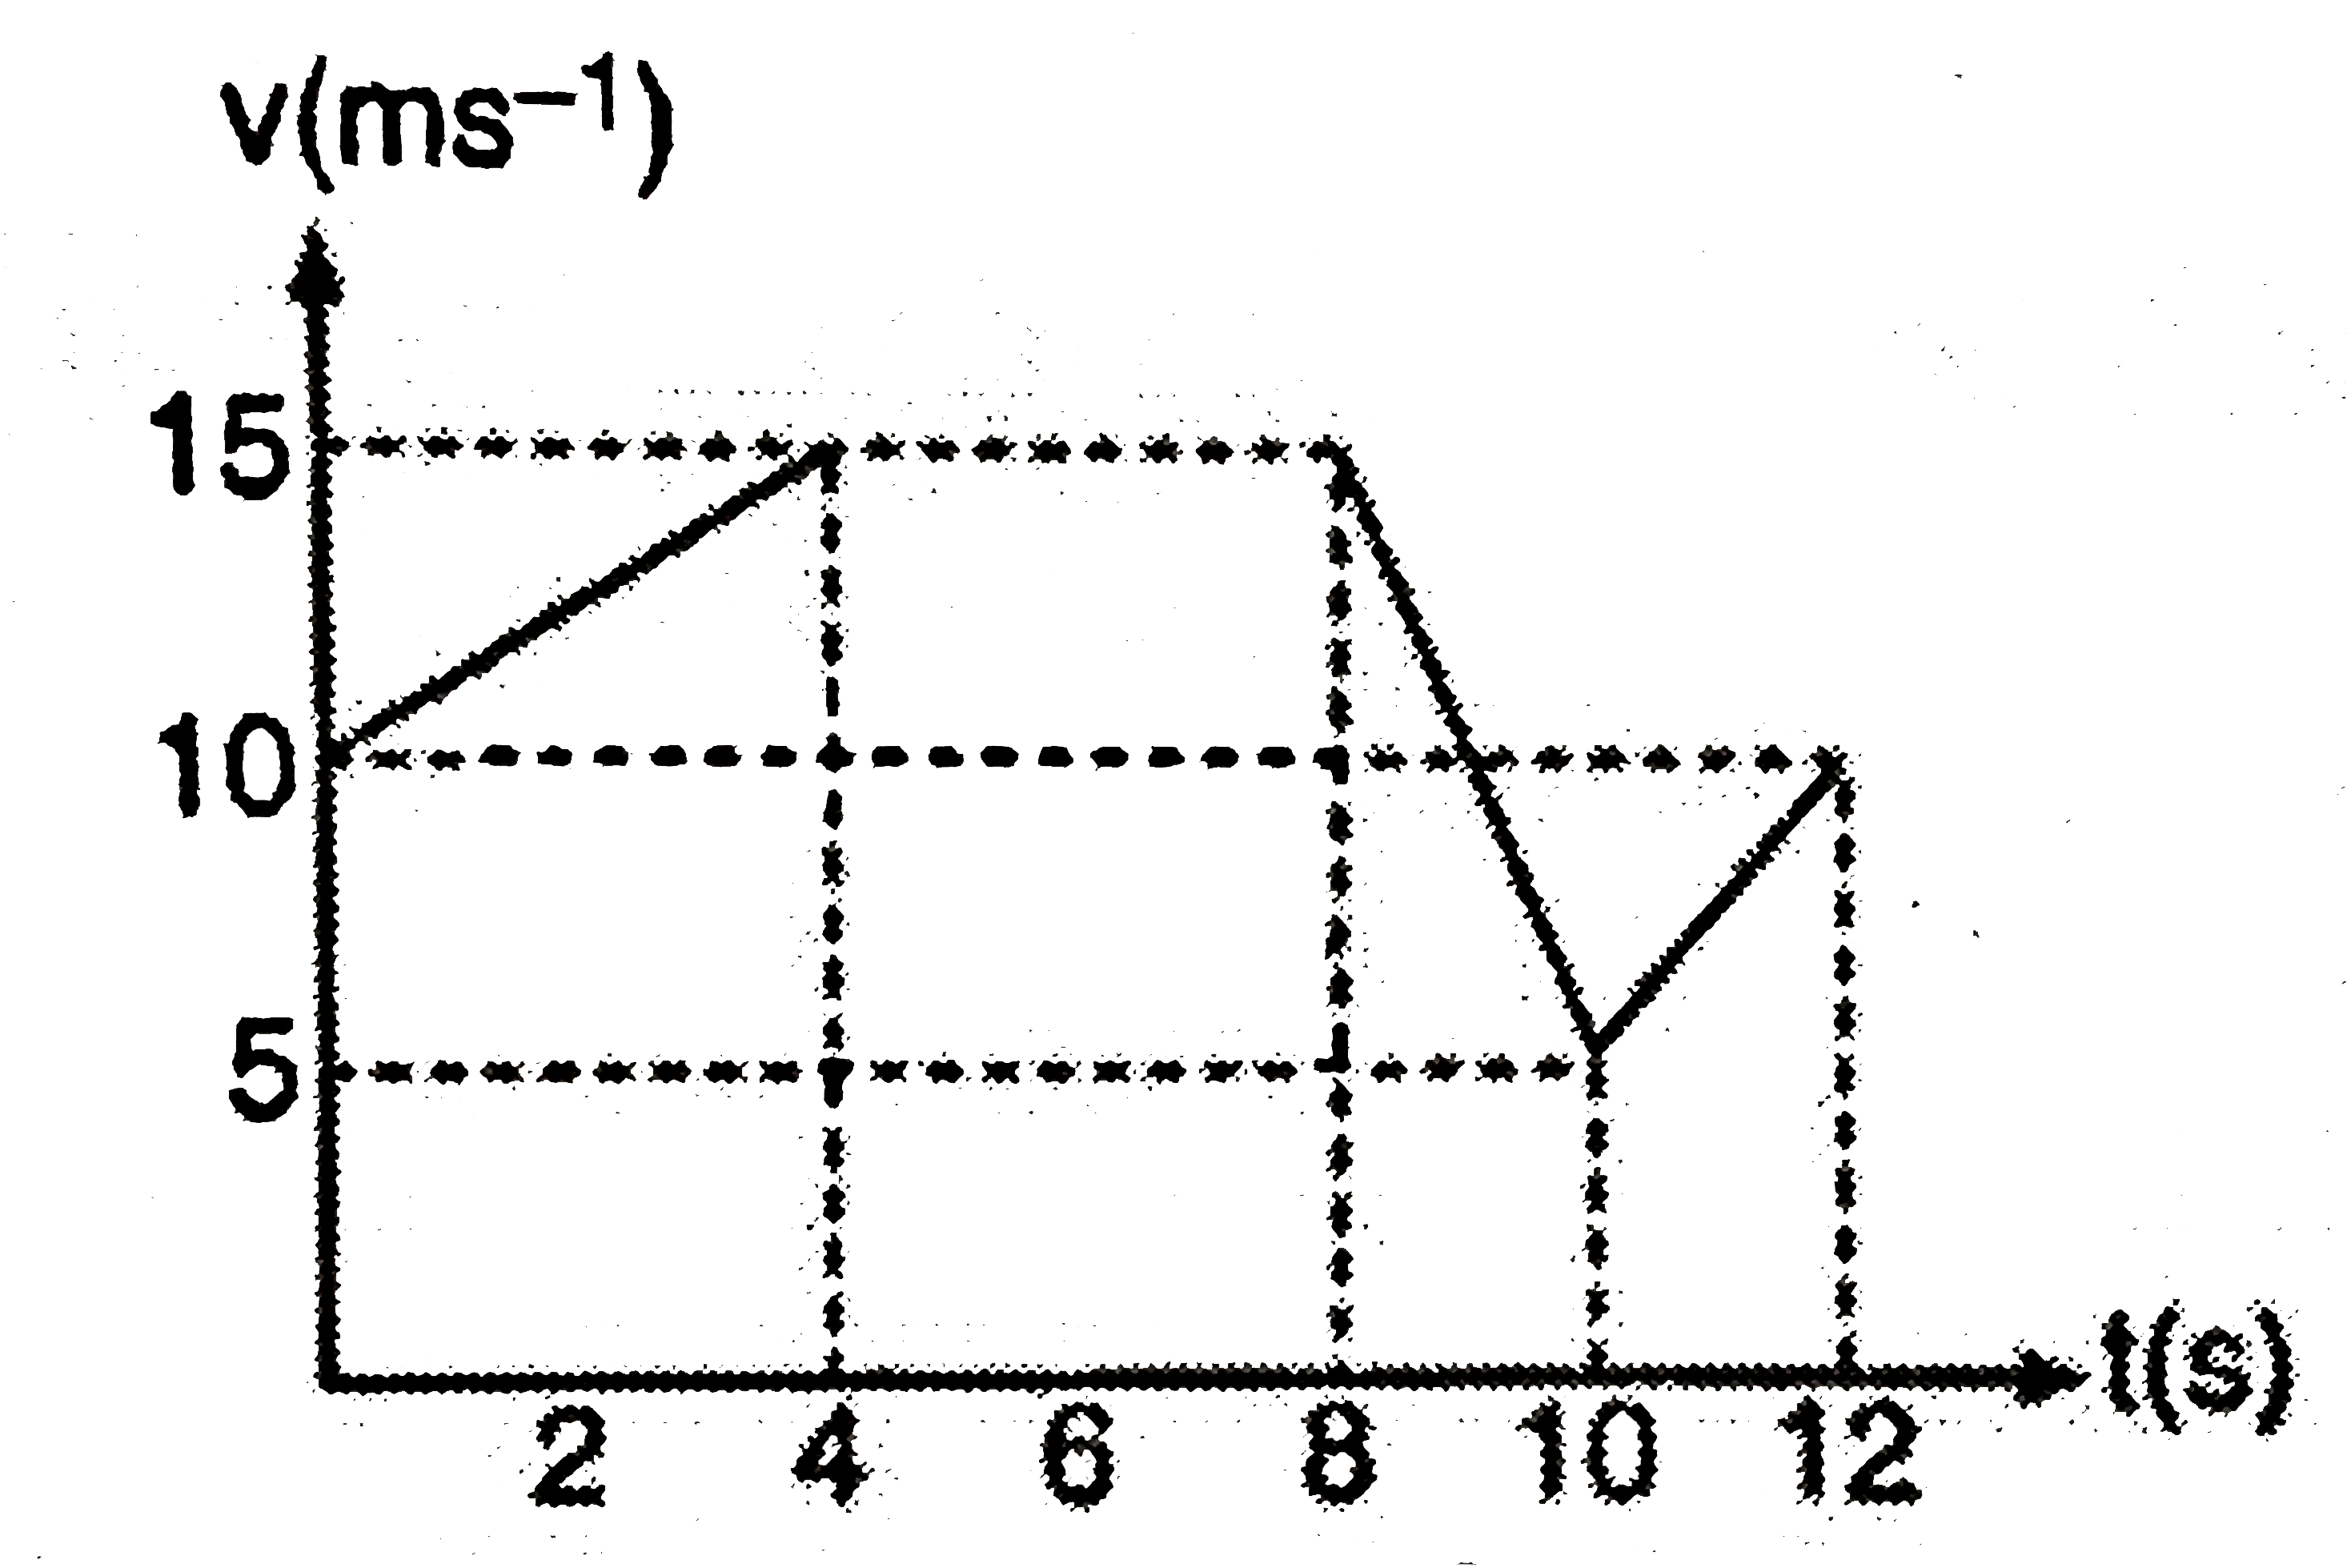
The velocity-time graph of a particle moving in a straight line is shown in figure. The mass of the particle is 2kg. Work done by all the forces acting on the particle in time interval between t=0 to t=10s is
View SolutionDisplacement time graph of a particle moving in a straight line is a shown in figure.

View SolutionThe velocity -time (v−t) graph of a particle moving in a straight line is shown in figure. The acceleration of the particle at t=9 is:
View SolutionThe kinetic energy (KE) versus time graph for a particle moving along a straight line is as shown in the figure. The force versus time graph for the particle may be

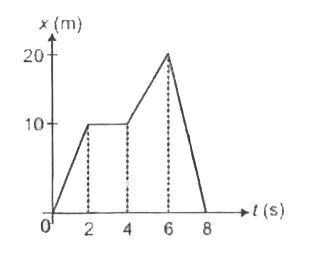
View SolutionThe position (x) - time (t) graph for a particle moving along a straight line is shown in figure. The average speed of particle in time interval t = 0 to t = 8 s is
View Solution

