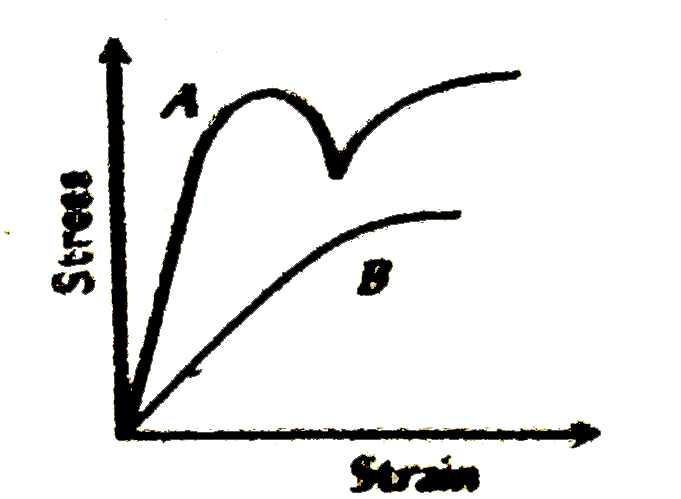
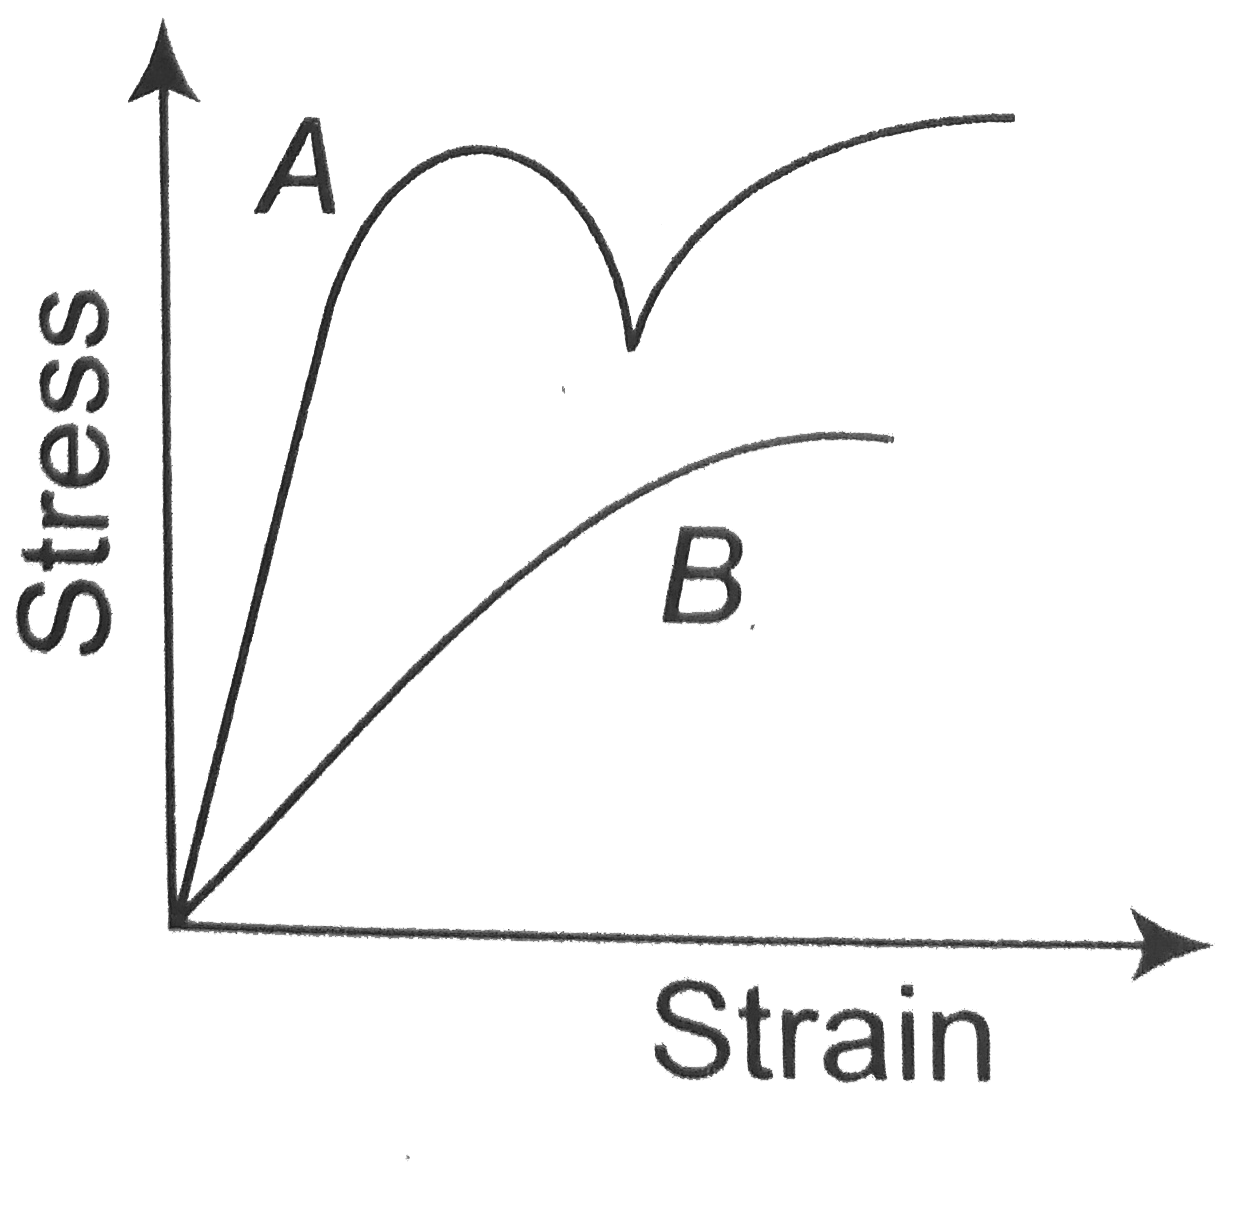
Figure shows the stress-strain graphs for materials .A and B. From the graph it follows that
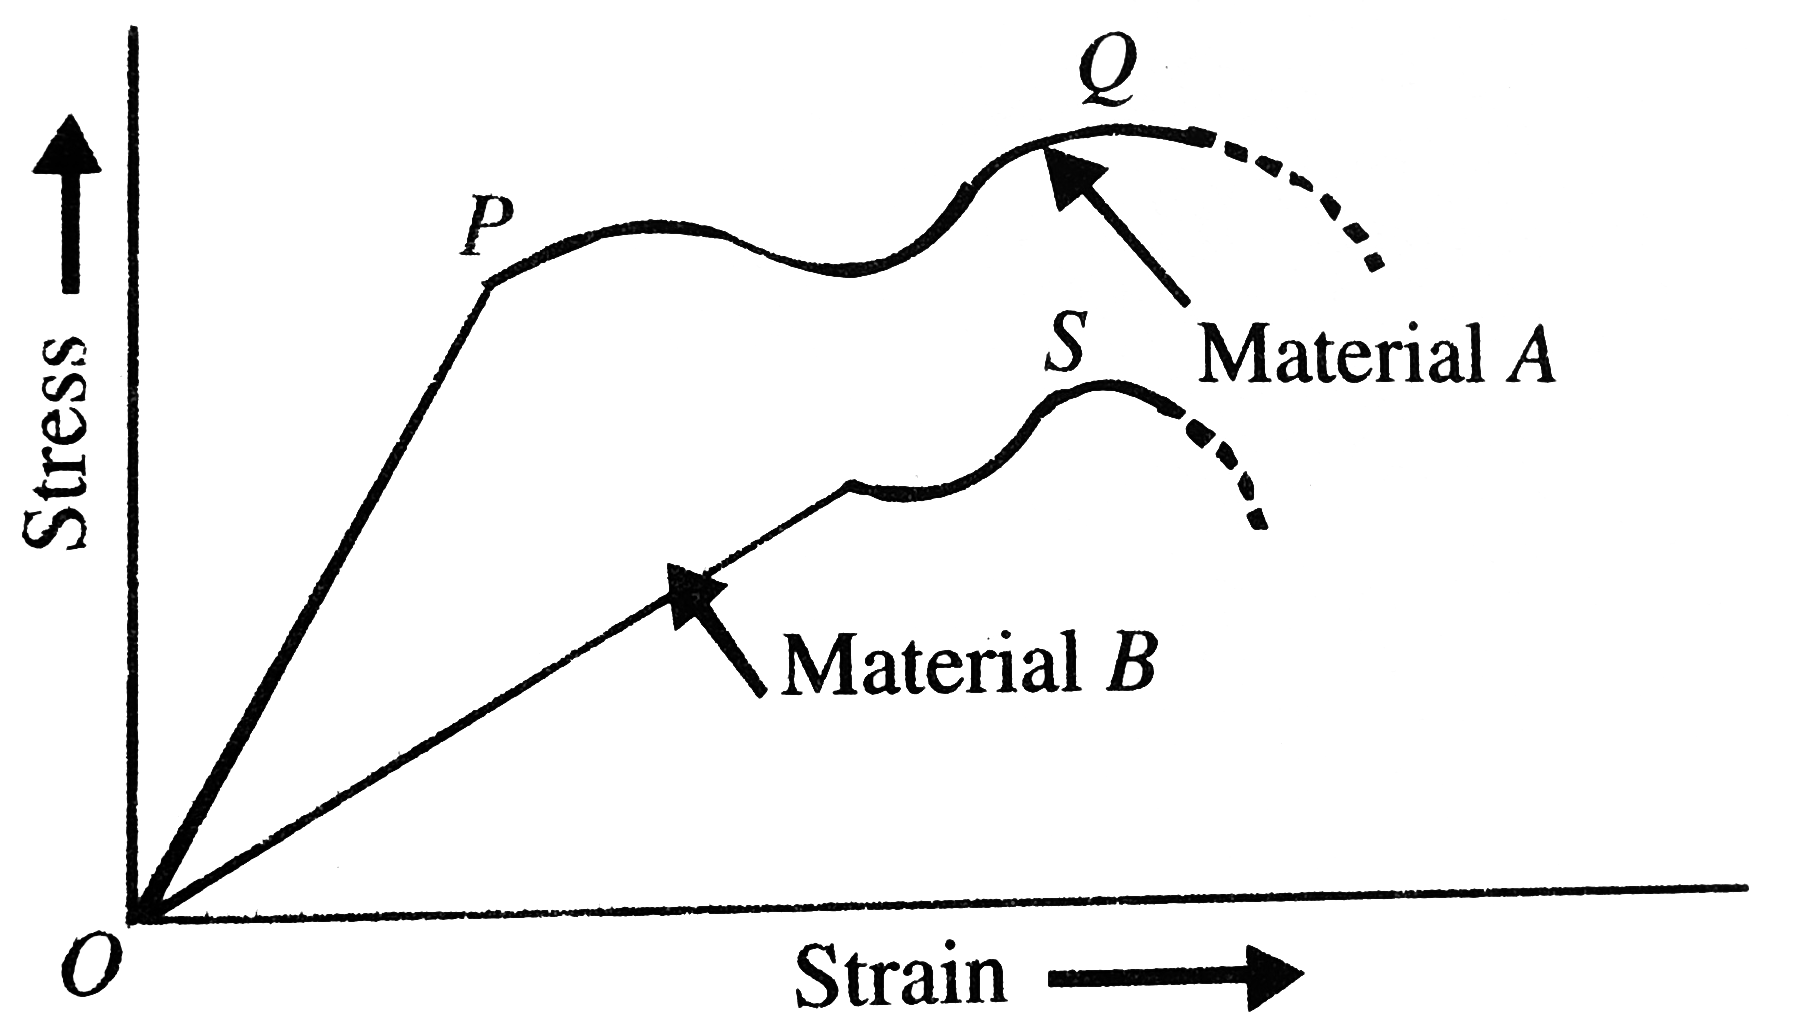
to material A has a higher Young's modulus
material B is more ductile
material A can withstand greater stress
material B can withstand greater stress
The correct Answer is:A, D
The slope of the linear portion of the curve gives the Young's modulus of the material. The slope of the linear portion OP, for material A is greater than that of the linear portion OR for material B. Hence, statement a is correct. The plastic region for material A (from P to Q) is greater than that (from R to S) for material B, which indicates that material A is more ductile. Hence statement b is correct. The breaking stres for material B i.e., stress corresponding to point S) is less than that for material A (i.e., sress corresponding to point Q), which implies that material B can break more easily than material A. Thus, material B is more brittle. Hence, choice c is also incorrect. Material A is stronger than material B becase it can with stand a greater stress before it breaks. The breaking stres is the stress corresponding to point for material A and to point S for material B. Hence, the correct choices are a and d.
Topper's Solved these Questions
- BOOK - CENGAGE PHYSICSCHAPTER - PROPERTIES OF SOLIDS AND FLUIDSEXERCISE - Assertion- Reasoning13videos
PROPERTIES OF SOLIDS AND FLUIDS
- BOOK - CENGAGE PHYSICSCHAPTER - PROPERTIES OF SOLIDS AND FLUIDSEXERCISE - Linked Comprehension30videos
PROPERTIES OF SOLIDS AND FLUIDS
- BOOK - CENGAGE PHYSICSCHAPTER - PROPERTIES OF SOLIDS AND FLUIDSEXERCISE - Single Correct112videos
PROPERTIES OF SOLIDS AND FLUIDS
- BOOK - CENGAGE PHYSICSCHAPTER - NEWTON'S LAWS OF MOTION 2EXERCISE - Integer type1videos
NEWTON'S LAWS OF MOTION 2
- BOOK - CENGAGE PHYSICSCHAPTER - RIGID BODY DYNAMICS 1EXERCISE - Integer11videos
RIGID BODY DYNAMICS 1
Similar Questions
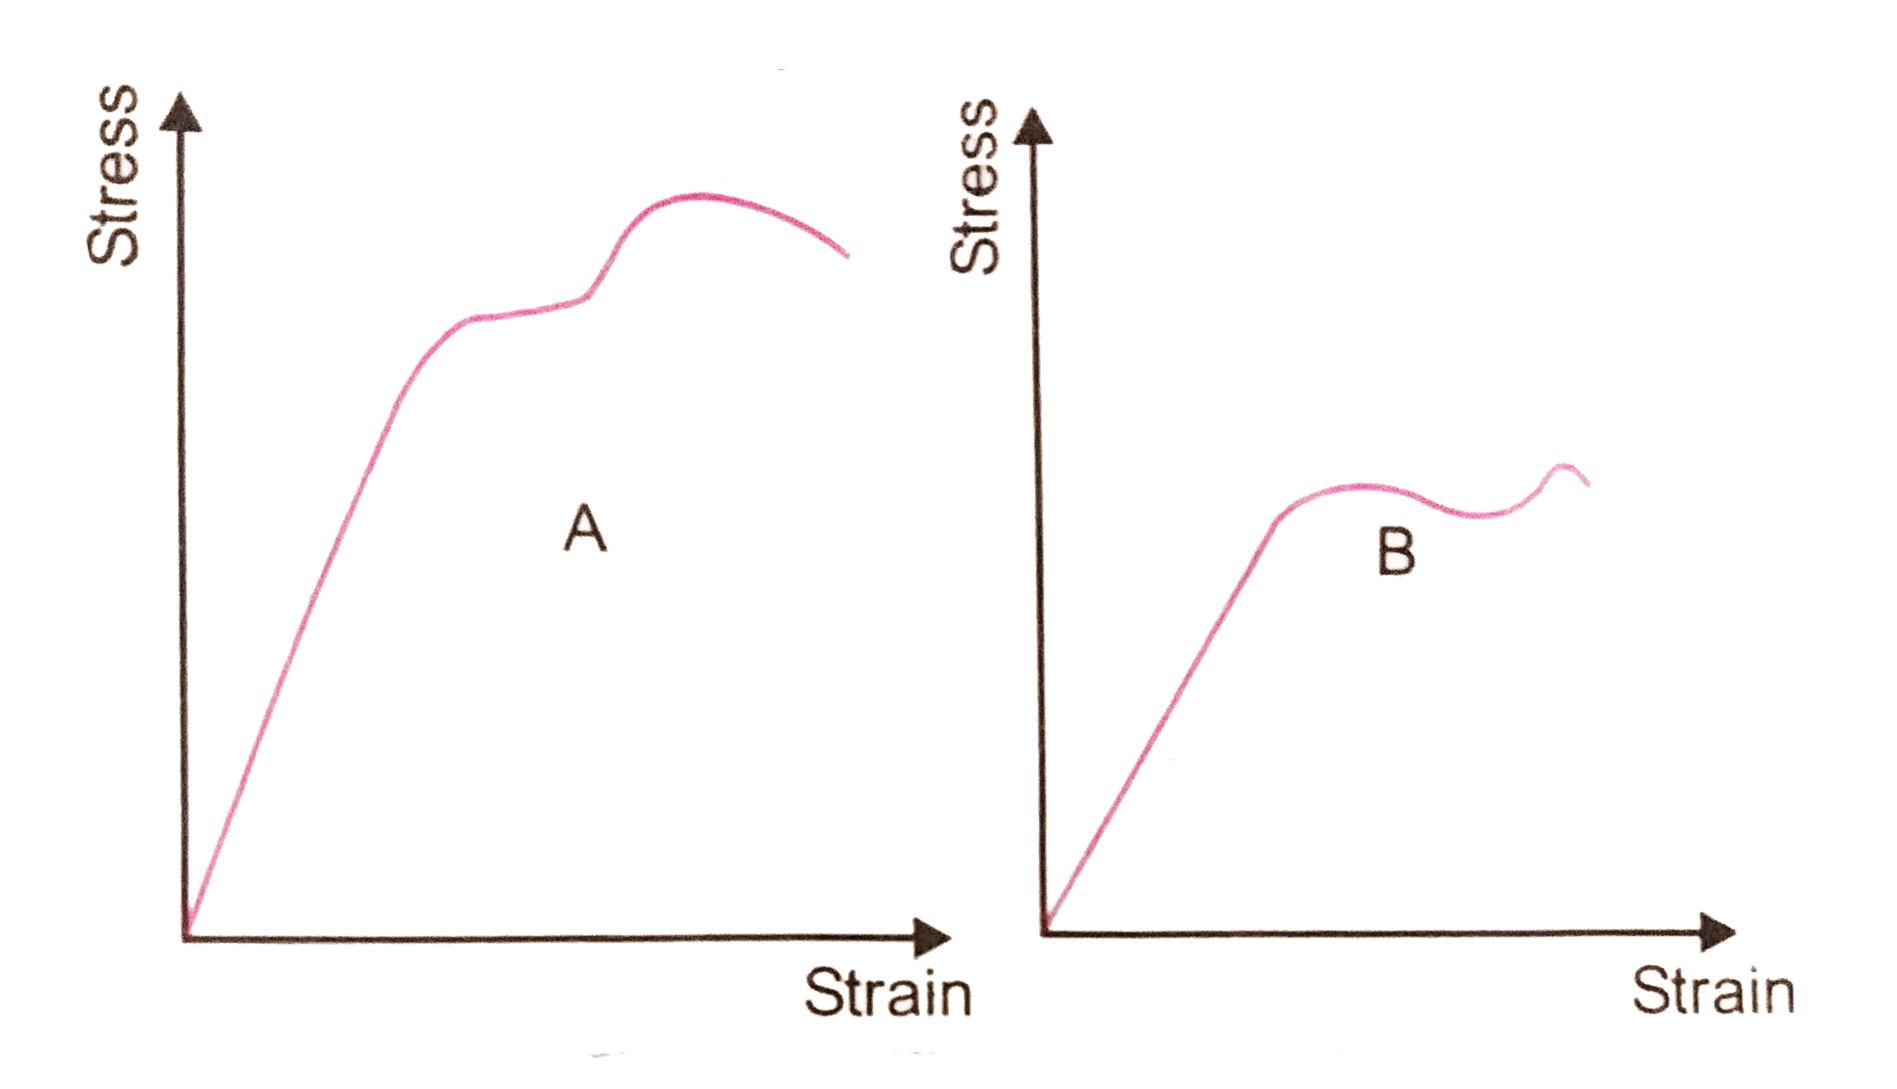
The stress versus strain graph for two materials A and B are shown in fig. the graph are on the same scale. ltbr> (a) Which materail has greater Young's modulus?
(b) which of the two is stronger materail?
 View Solution
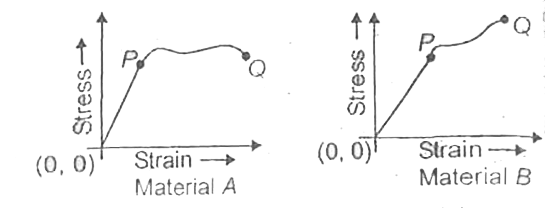
The stress-strain graphs for two materials A and are shown in figure. The graphs are drawn to the same scale. Select the correct statement
 View Solution
Knowledge Check
- Question 1 - Select One
Figure shows the stress-strain curve of two metals P and Q. From the graph, it can be concluded that
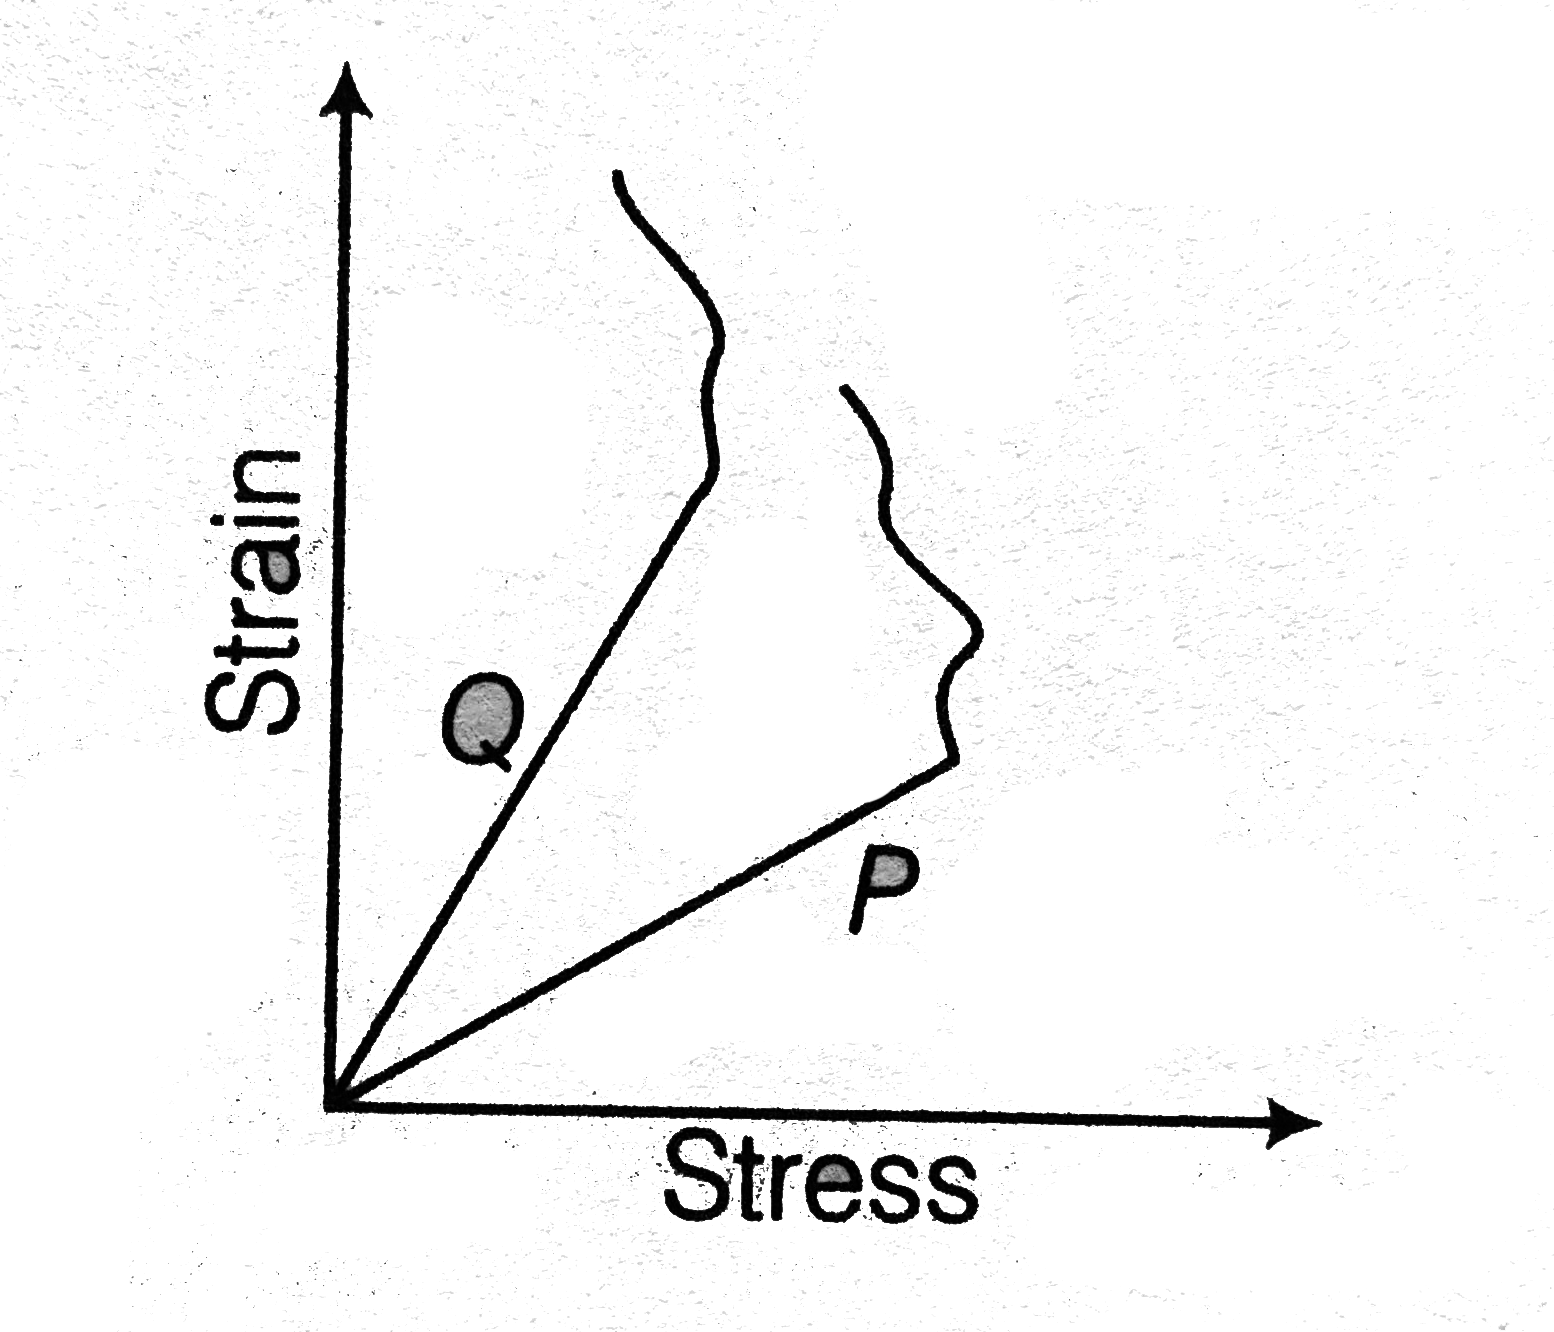 A(A) P has greater young's modulus and lesser ductilityB(B) Q has greater young's modulus and lesser ductilityC(C) P has greater young's modulus and greater ductilityD(D) Q has greater young's modulus and greater ductility
 - Question 2 - Select One
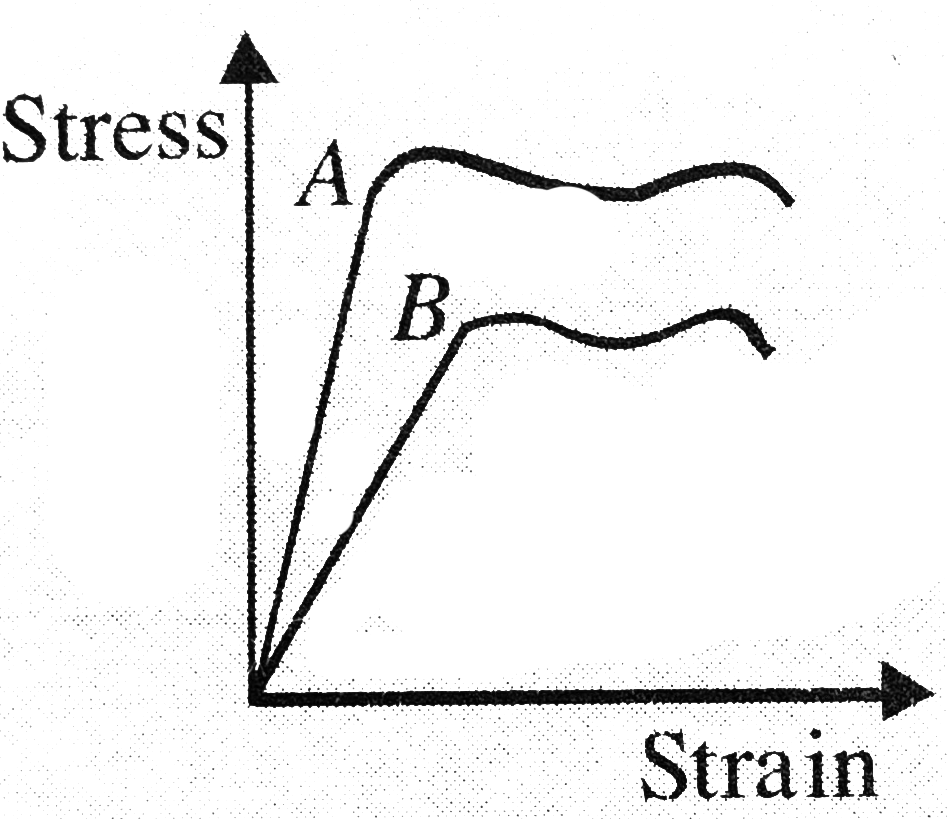
The diagram shows stress v/s strain curve for the materials A and B. From the curves we infer that
 AA is brittle but B is ductileBA is ductile and B is brittleCBoth A and B are ductileDBoth A and B are brittle
 - Question 3 - Select One or More
The stress- strain graphs for materials A and B are as shown. Choose the correct alternative
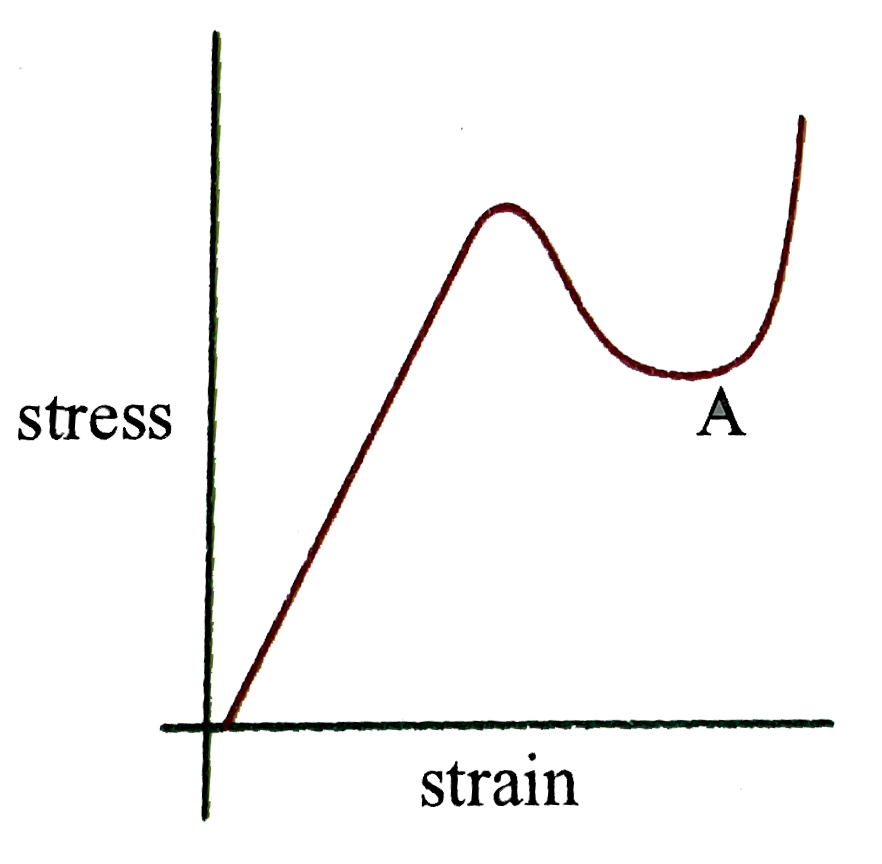
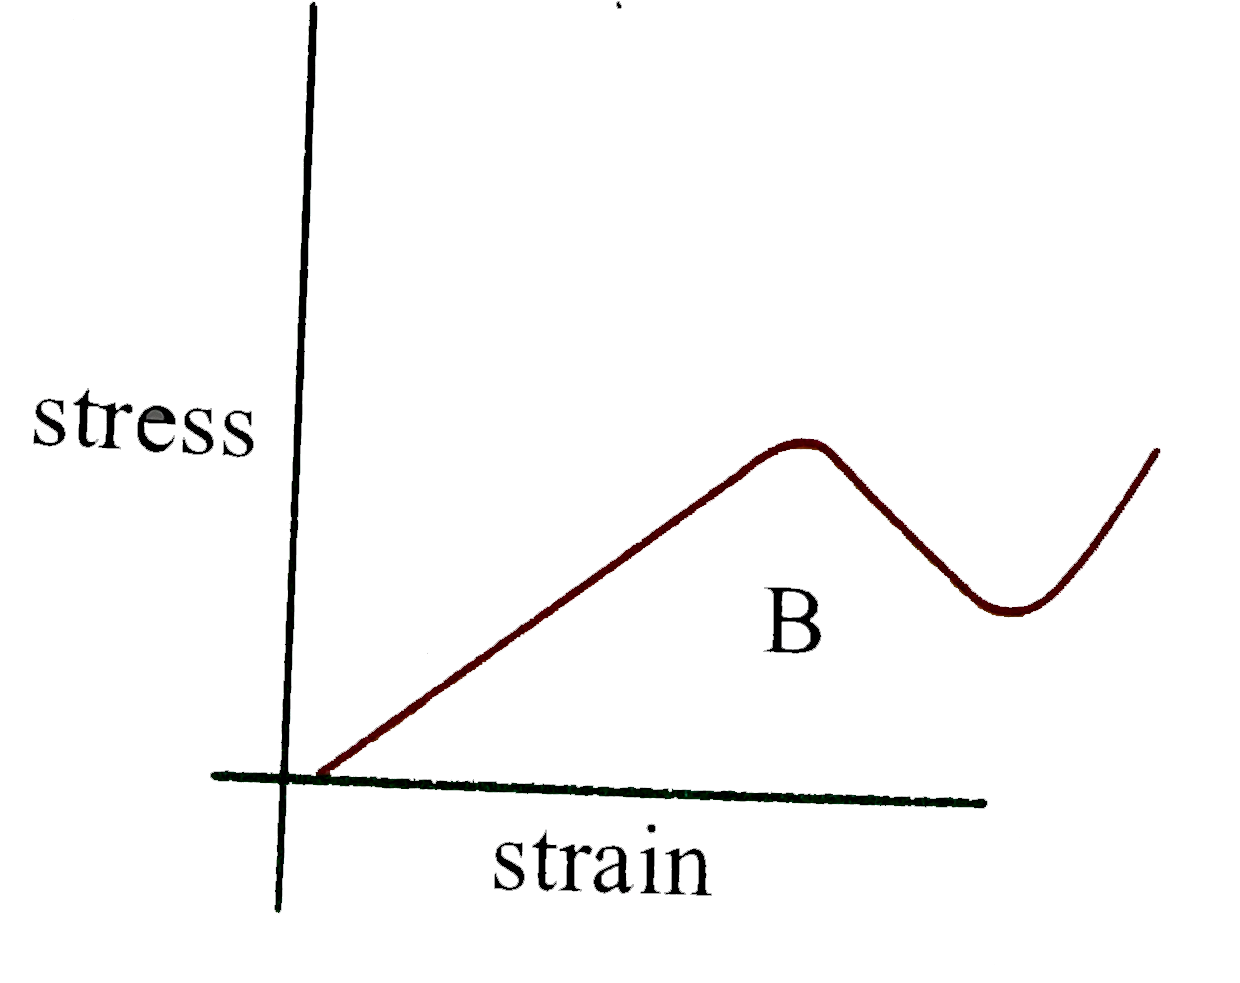 Amaterial A is stronger than material BBmaterial B is stronger than material ACYoung's modulus of A is greater than that of BDYoung's modulus of B is greater than that of A
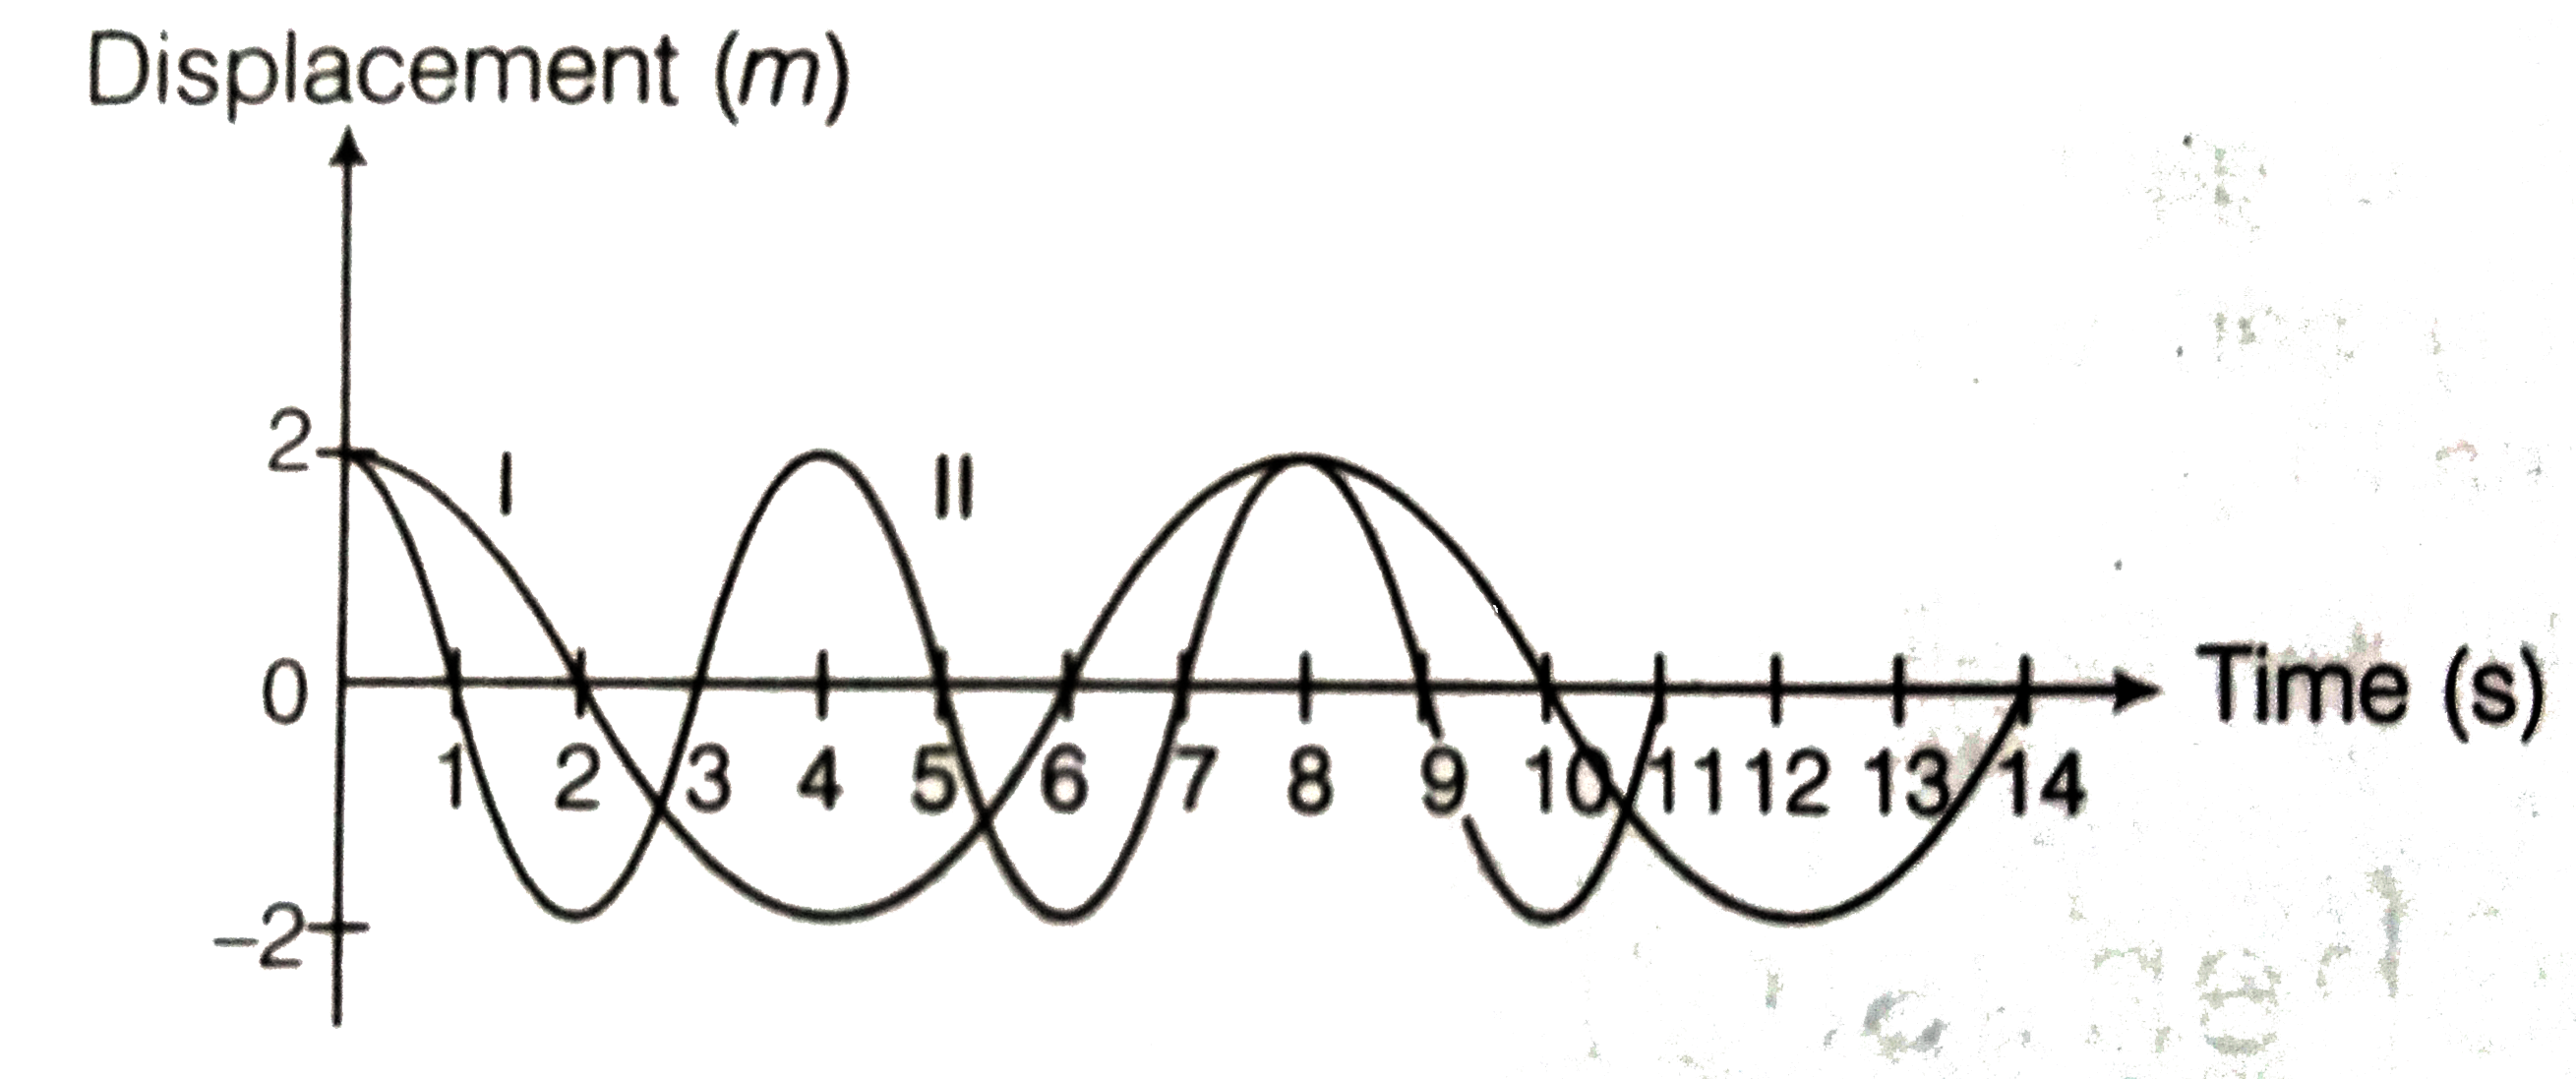
Figure shows the displacement time graphs of two simple harmonic motions I and II. From the graph it follows that
 View Solution
The diagram shoes stress v/s strain curve for the materials A and B. From the curves we infer thatView SolutionThe stress and strain graphs for two materials, A and B are shown here. Answer the following:
 give reasonsView Solution
Materials get deformed when force is applied. Some of them regain their status when the applied force is removed. They are termed as elastic. Those of which not regaining are called plastic. There may be delay in the regaining in some materials. They are said to have got elastic aftereffect, since they have gone beyond the elastic limit. Repeated application and removal of force leads to fatigueness in the material. Fatigued materials may break at any point time and so are avoided.
The stress strain graph for two materials A and B is shown in the following figure:
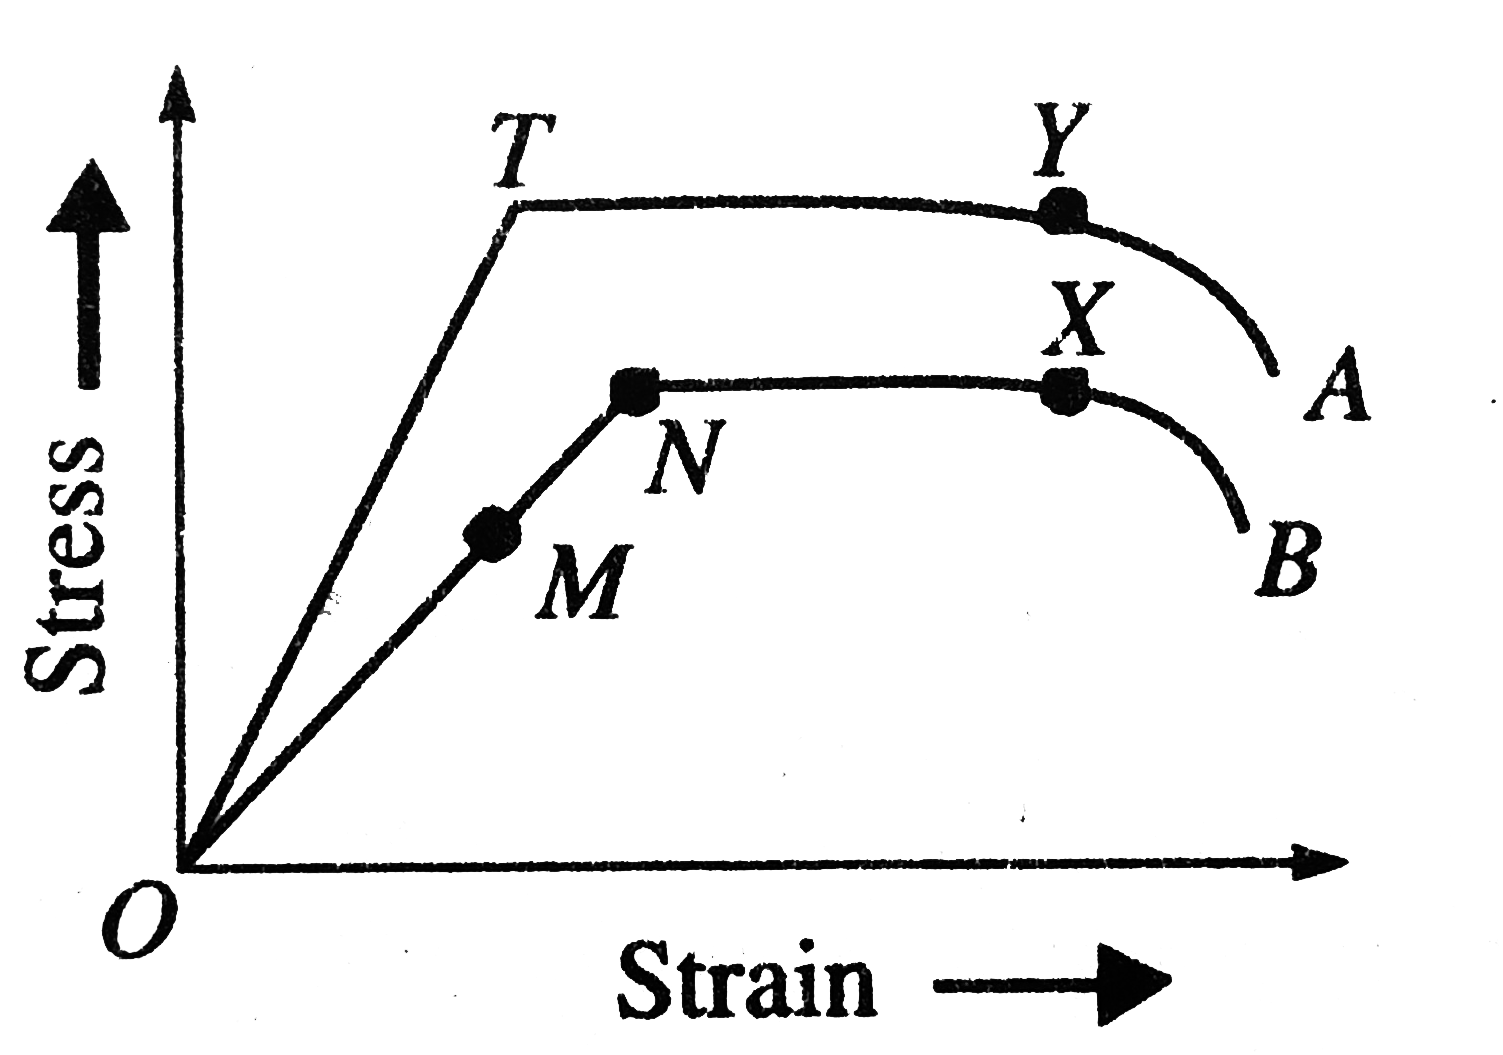
The time in which the two materials regain their original status is tA and tB related as tB=2tB. Then the material under elastic aftereffect (relatively) isView SolutionFigure shows position-time graph of two cars A and B.
 View Solution
