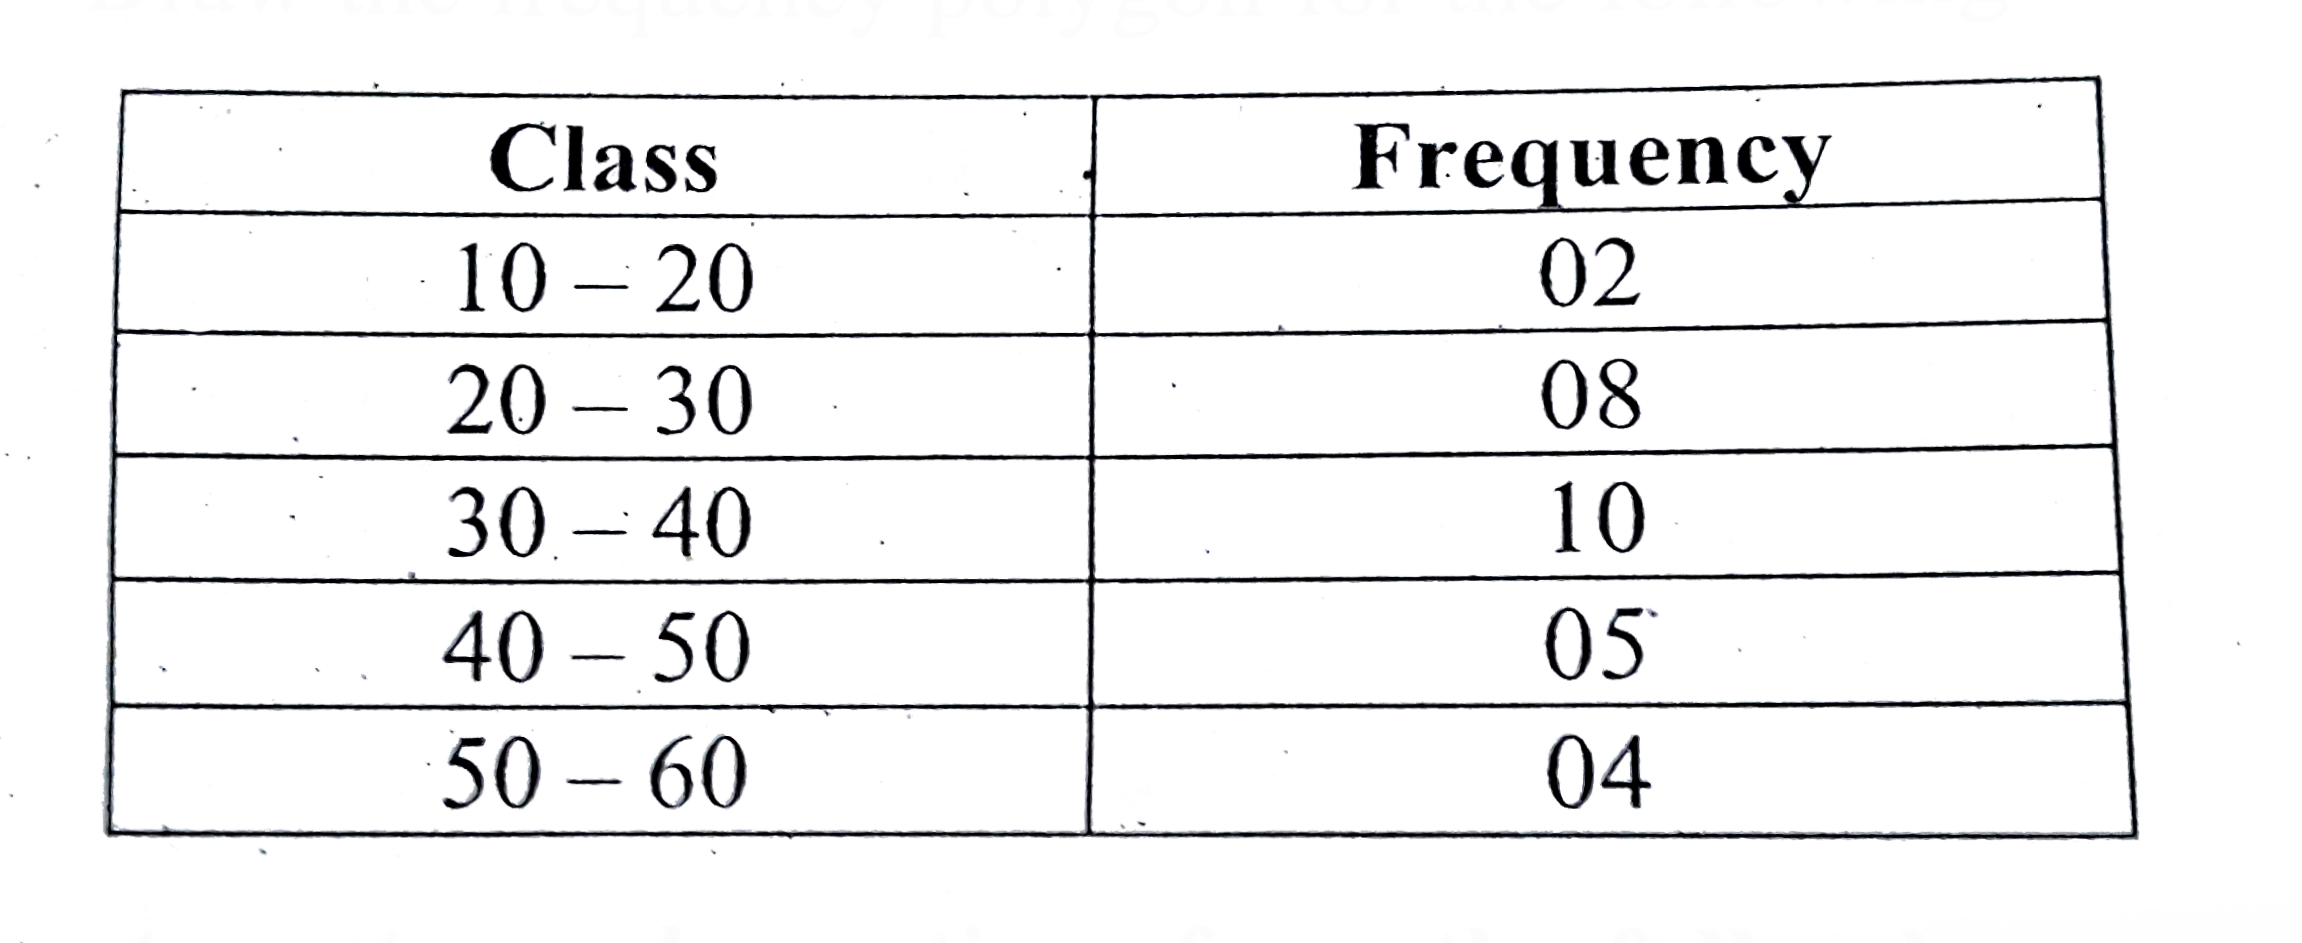
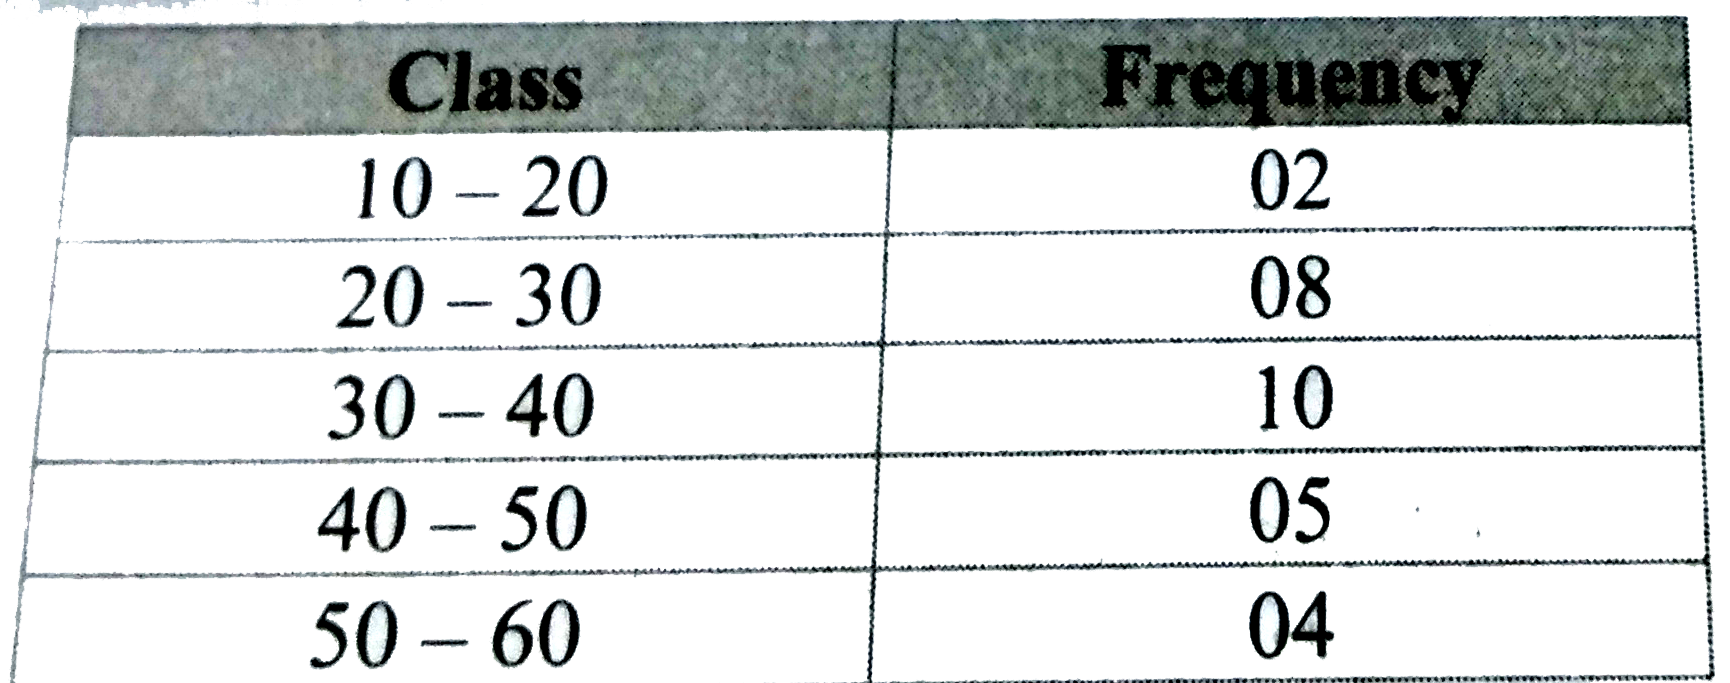
Draw a histogram and frequency polygen to represent the following frequency distribution :
Step by step video & image solution for Draw a histogram and frequency polygen to represent the following frequency distribution : by Maths experts to help you in doubts & scoring excellent marks in Class 12 exams.
Updated on:21/07/2023Similar Questions
Draw the frequency polygon representing the following frequency distribution

View SolutionConstruct a combined histogram and frequency polygon for the following frequency distribution :

View SolutionDraw the frequency polygon for the following frequency distribution:

View SolutionDraw a frequency polygon for the following frequency distribution:

View SolutionDraw a frequency polygon for the following frequency distribution.

View SolutionDraw a frequency polygon from the following frequency distribution

View SolutionDraw a histogram and frequency polygon from the following data:

View SolutionDraw frequency polygon for the following frequency distribution.

View SolutionDraw a histogrum and to represent the following frequency distribution :
View SolutionDraw a frequency polygon for the following grouped frequency distribution table :

View Solution
