A sonic source, located in a uniform medium, emits waves of frequency n. If intensity, energy density (energy per unit volume of the medium) and maximum speed of oscillations of medium particle are, respectively, I, E and u0 at a point, then which of the following graphs are correct?
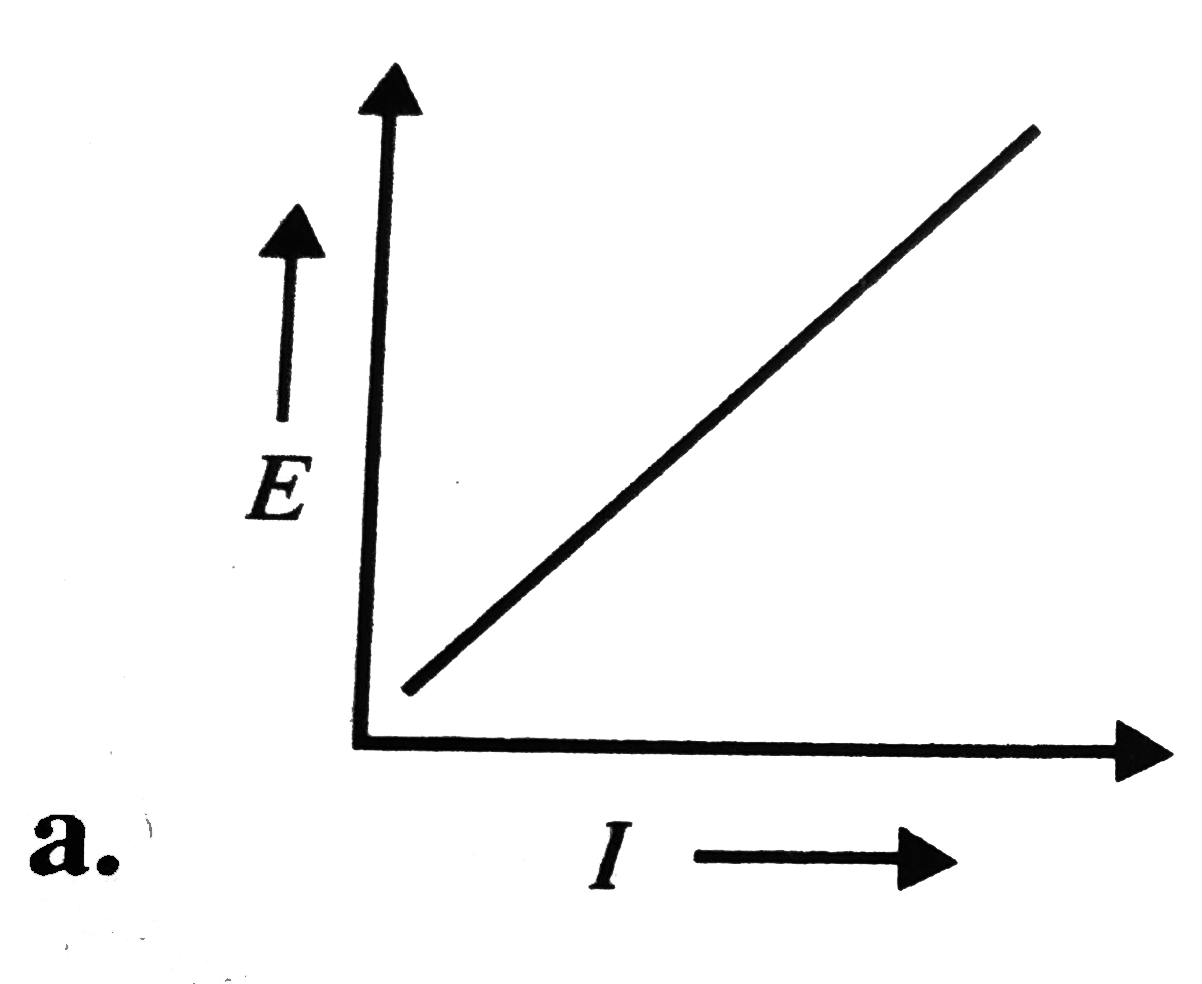


The correct Answer is:A, C, D
If intensity at a point is I. Then energy density at that point is E=Iv, where v is wave propagation velocity.
It means that E∝I. Hence, the graph between E and I will be a straight line passing through the origin. Therefore, (a) is correct and (b) is wrong. Intensity is given by
I=2π2n2a2ρv
Hence, E=2π2n2a2ρ
It means that E∝n2
Hence, the graph between E and n will be a parabola passing through origin, having increasing slope and symmetric about E-axis, Hence, option (d) is correct.
Particle maximum velocity is
u0=aω=2πna
⇒πna=u02
Hence, E=12ρu20
It means that graph between E and u0 will be a parabola, have increasing slope and will be symmetric about E-axis. Hence, option (c ) is also correct.
Topper's Solved these Questions
- BOOK - CENGAGE PHYSICSCHAPTER - SOUND WAVES AND DOPPLER EFFECTEXERCISE - Assertion-Reasoning24videos
SOUND WAVES AND DOPPLER EFFECT
- BOOK - CENGAGE PHYSICSCHAPTER - SOUND WAVES AND DOPPLER EFFECTEXERCISE - Comprehension144videos
SOUND WAVES AND DOPPLER EFFECT
- BOOK - CENGAGE PHYSICSCHAPTER - SOUND WAVES AND DOPPLER EFFECTEXERCISE - Single Correct252videos
SOUND WAVES AND DOPPLER EFFECT
- BOOK - CENGAGE PHYSICSCHAPTER - RIGID BODY DYNAMICS 2EXERCISE - Interger2videos
RIGID BODY DYNAMICS 2
- BOOK - CENGAGE PHYSICSCHAPTER - SUPERPOSITION AND STANDING WAVESEXERCISE - Comprehension Type5videos
SUPERPOSITION AND STANDING WAVES
Similar Questions
If V and u are electric potential and energy density, respectively, at a distance r from a positive point charge, then which of the following graph is correct ?
View SolutionA sonic source, located in a uniform medium, emits waves of frequency n. If intensity, energy density (energy per unit volume of the medium) and maximum speed of oscillations of medium particle are, respectively, I, E and u0 at a point, then which of the following graphs are correct?
View Solution
Knowledge Check
- Question 1 - Select One
If induction of magnetic field at a point is B and energy density is U then which of the following graphs is correct
A B
B C
C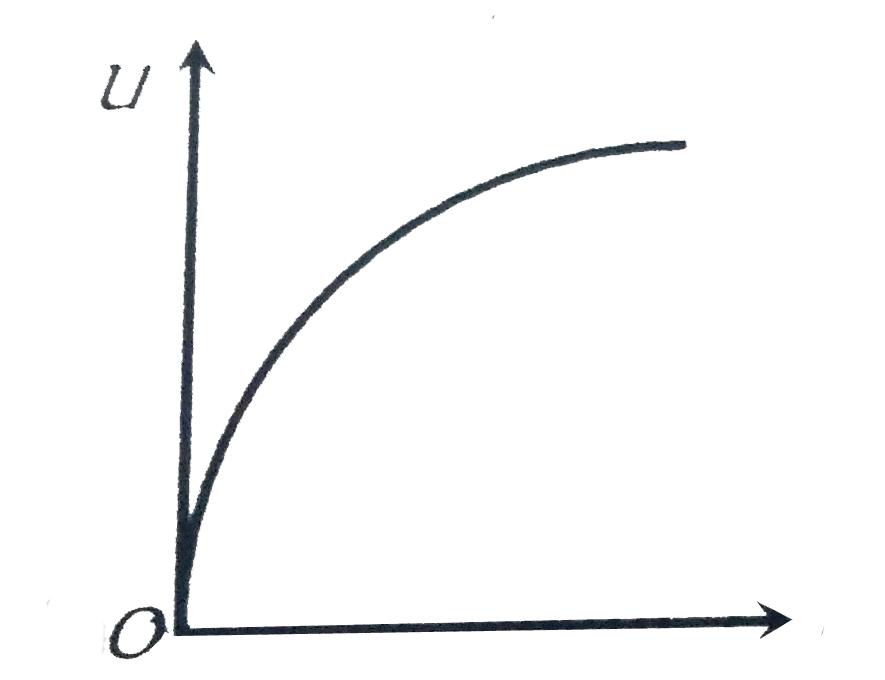 D
D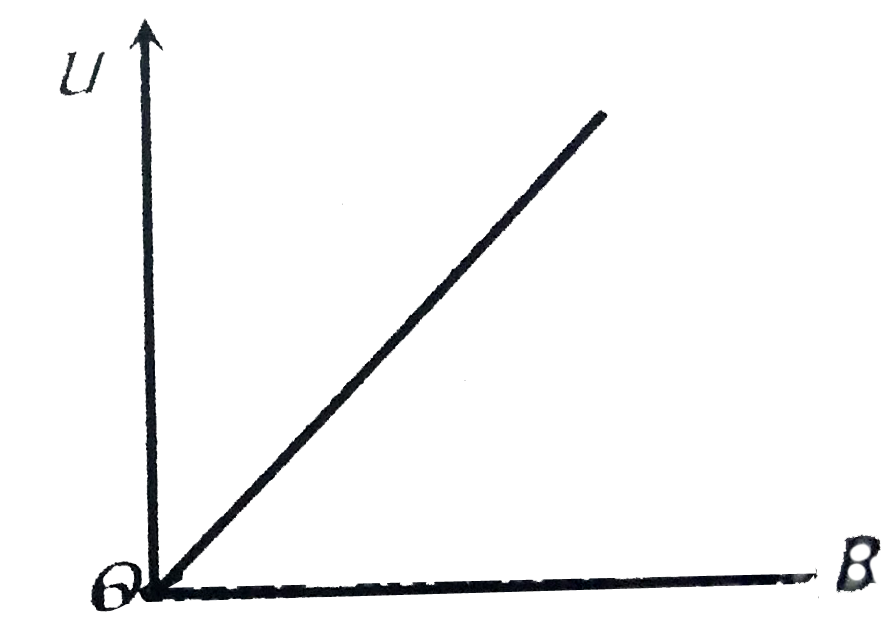
- Question 2 - Select One
Energy density E (energy per unit volume ) of the medium ar a distance r from a sound source varies acording to the curve shown in figure. Which of the following are possible?
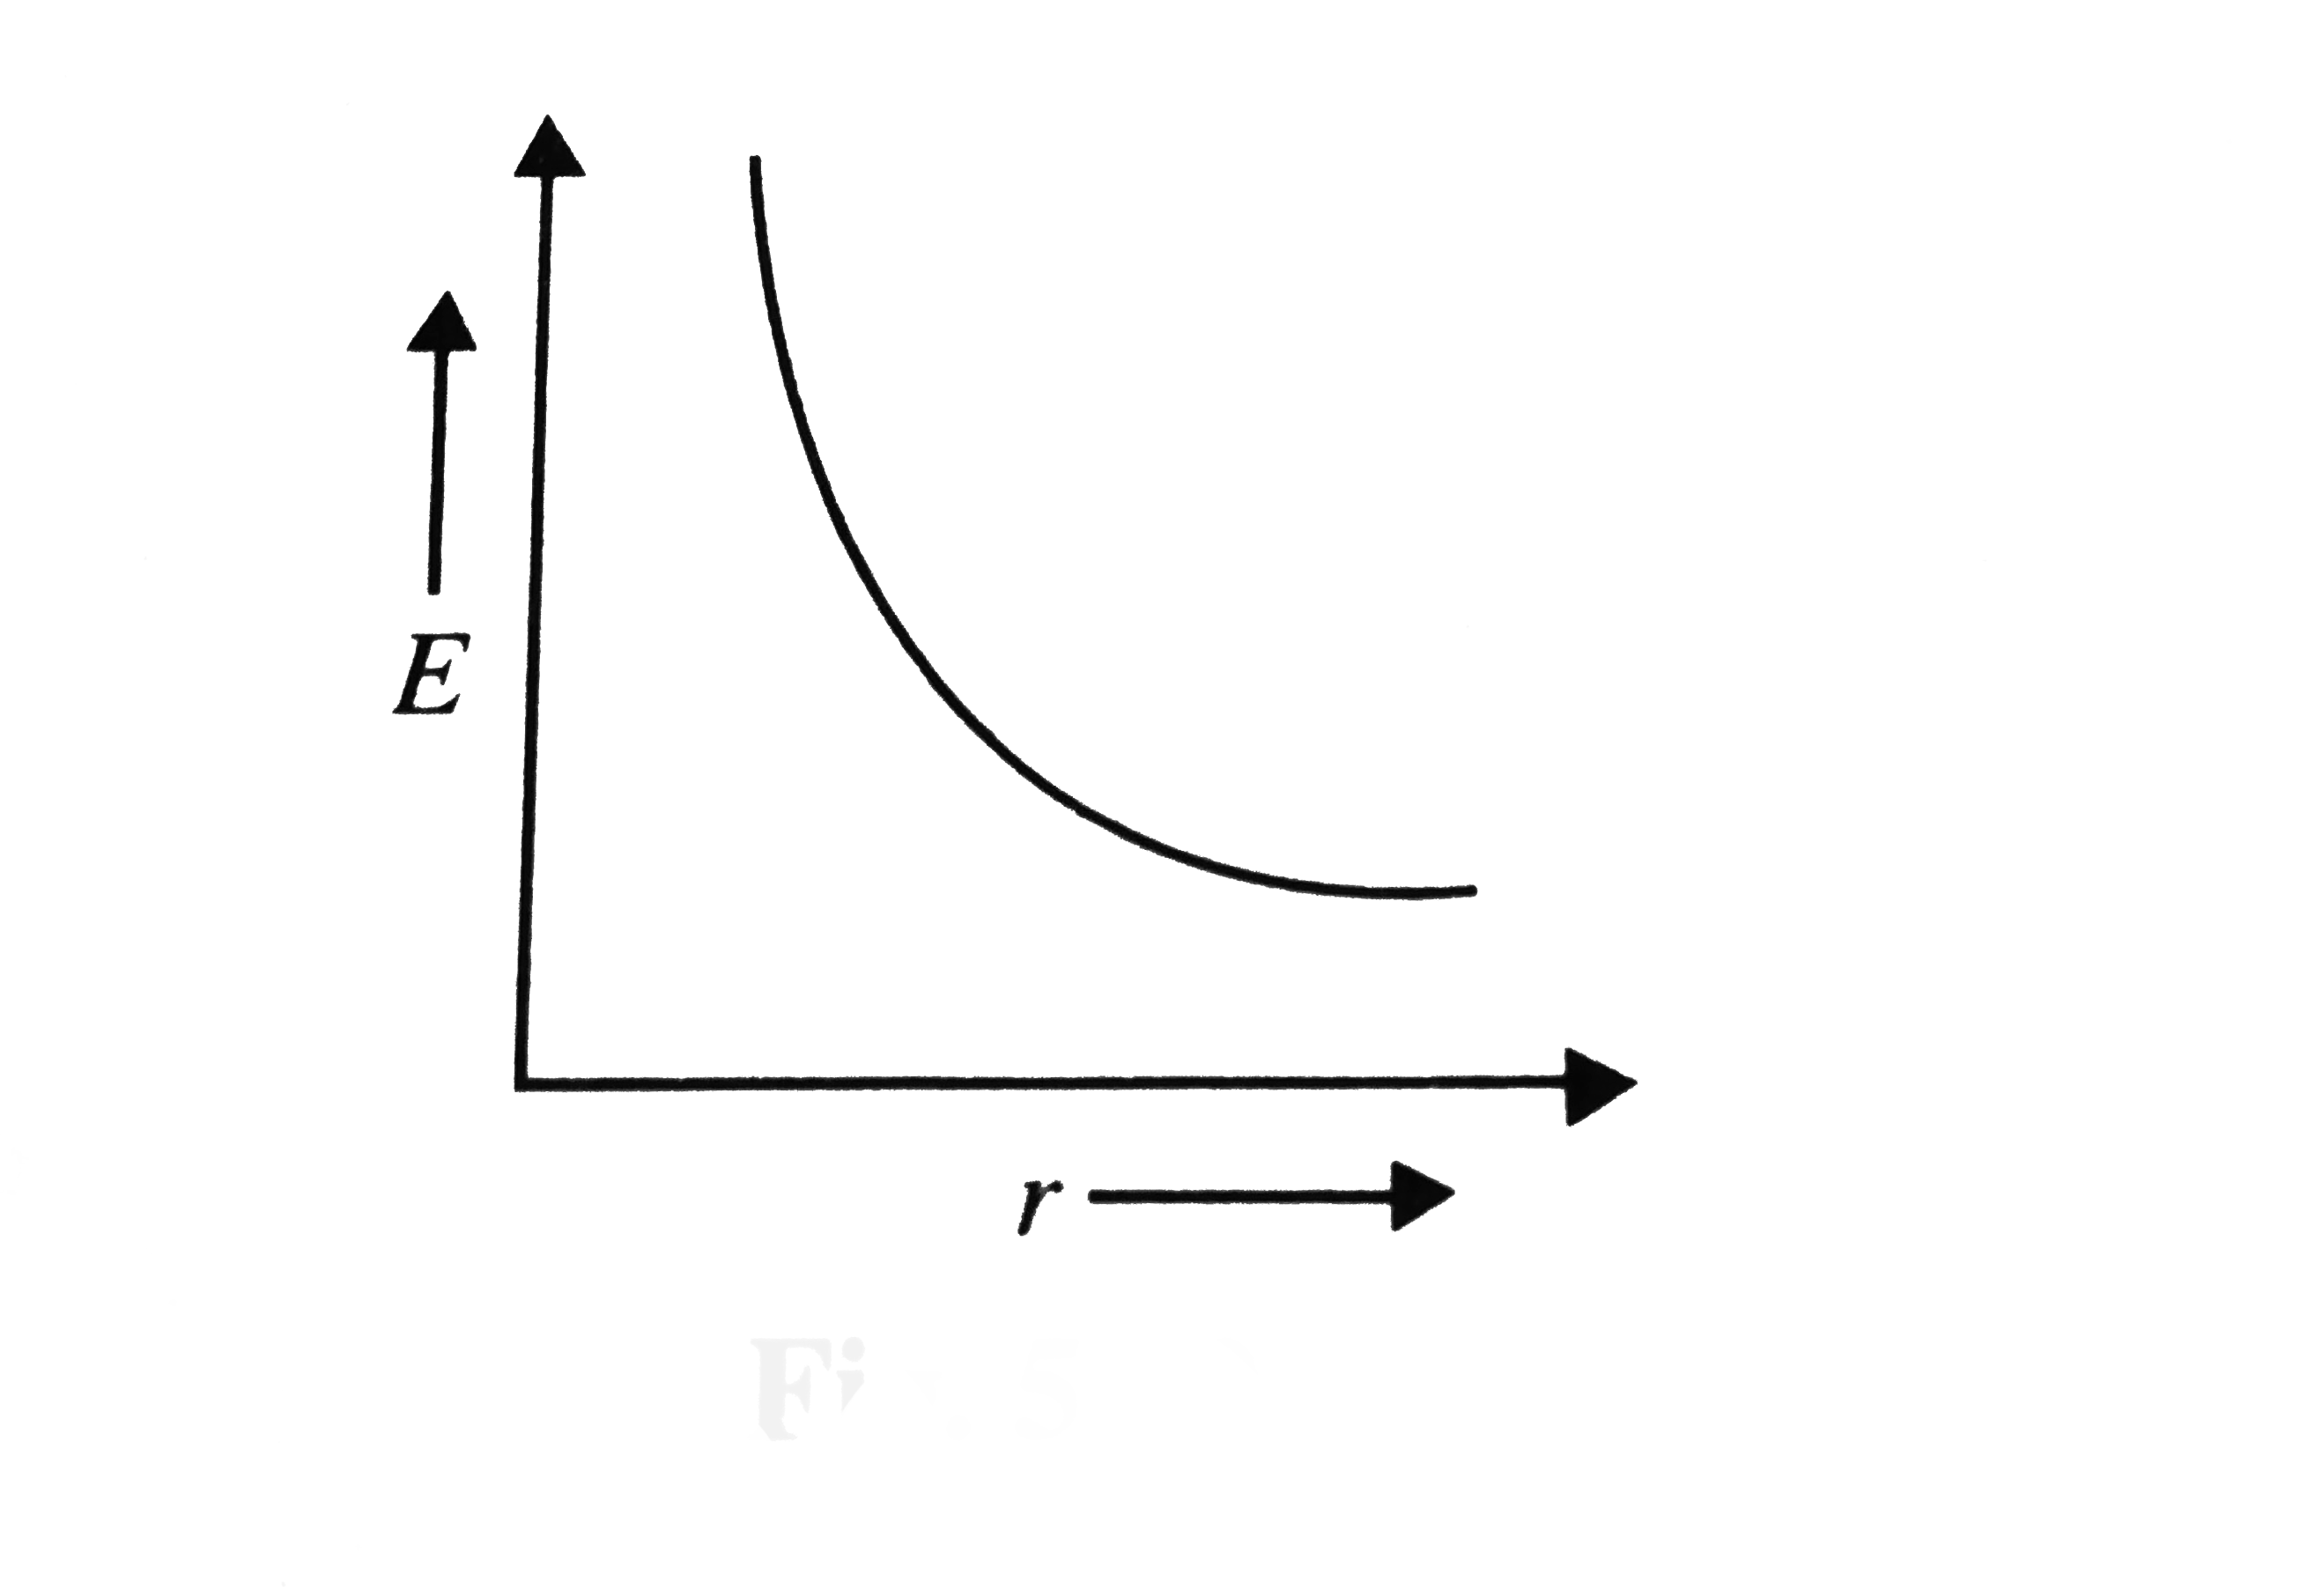 AThe source may be a point isotropic sourceBif the source is a plane source then the medium particle have damped oscillationsCif the source is a plane source then power of the sourcee is decresing with timeDdensity of the medium decrease with distance r from the source
 - Question 3 - Select One
A particle is projected from a point of an angle with the horizontal. At any instant t, if p is the linear momentum and E the kinetic energy, then which of the following graph is/are correct?
A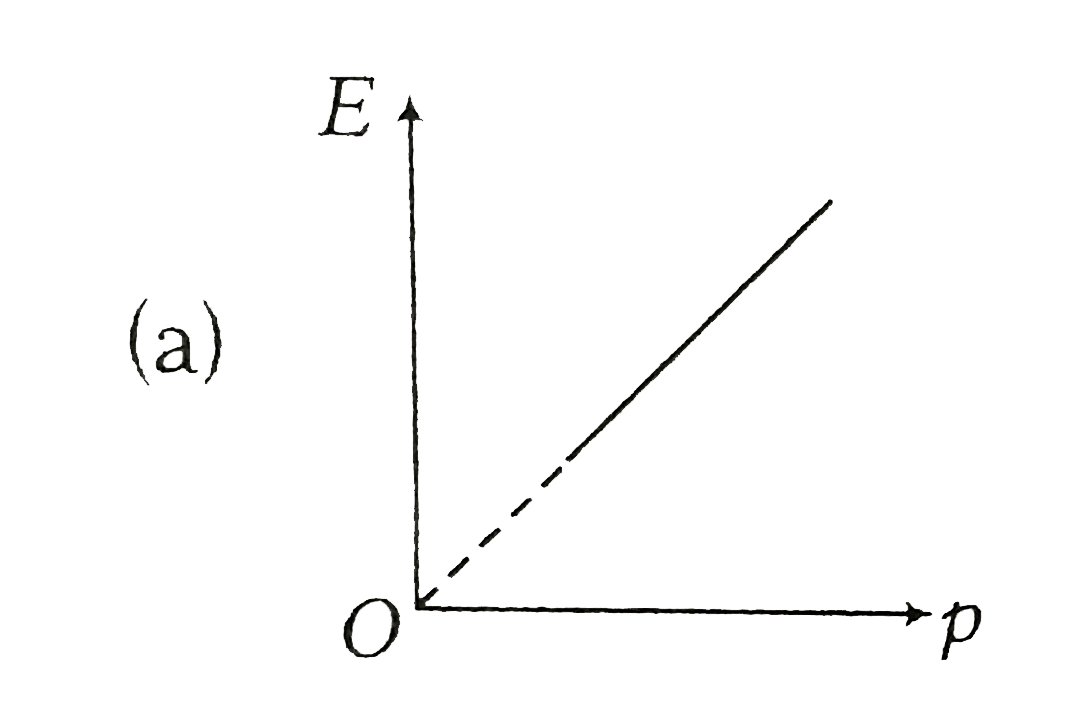 B
B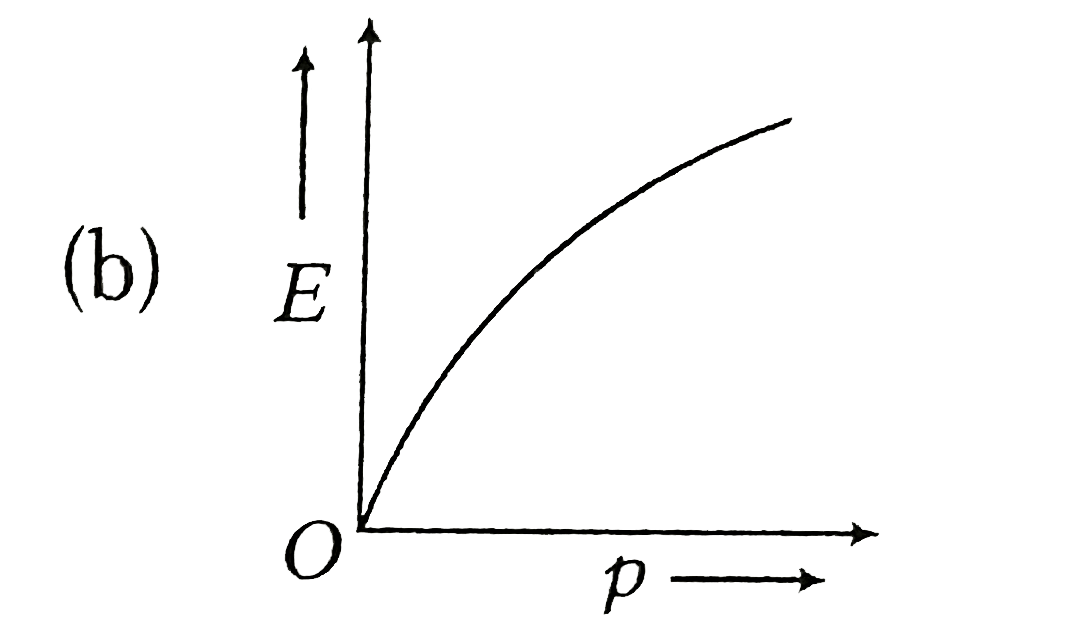 C
C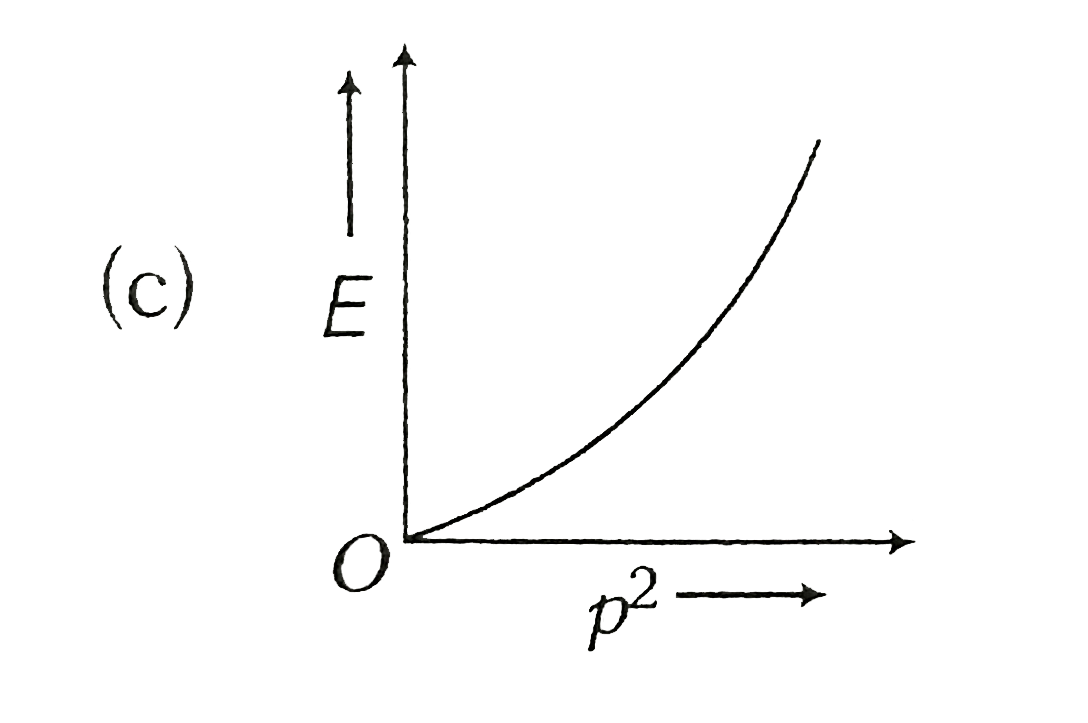 D
D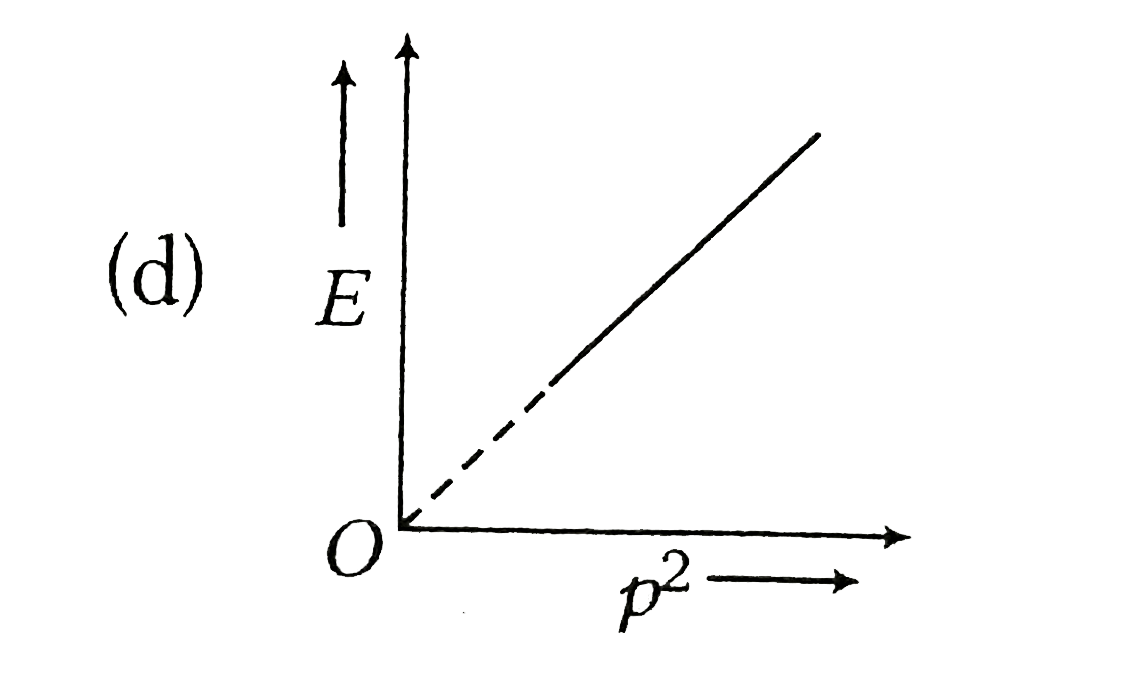
Calculate the energy per unit volume of a medium of dielectric constant 3, if the intensity of the electric field is 100V/m.
View SolutionThe energy density per unit volume of medium in an electric field of intensity 400V/m is (dielectric constant of material is 2 and ε0=8.85×10⁻¹²units)
View SolutionA current is flowing through a thin cylindrical shell of radius R. If energy density in the medium, due to magnetic field, at a distance r from axis of the shell is equal to U then which of the following graphs is correct
View SolutionA sound wave y=Asin(ωt−kx) is propagating through a medium of density 'ρ'. Then the sound energy per unit volume is
View SolutionAn EM wave from air enters a medium. The electric fields are
→E1=E01ˆxcos[2πv(zc−t)] in air and
→E=E02ˆxcos[k(2z−ct)] in medium, where the wave number k and frequency v refer to their values in air. The medium is non-magnetic. If ∈r1 and ∈r2 refer to relative permittivities of air and medium respectively, which of the following options is correct ?View Solution

