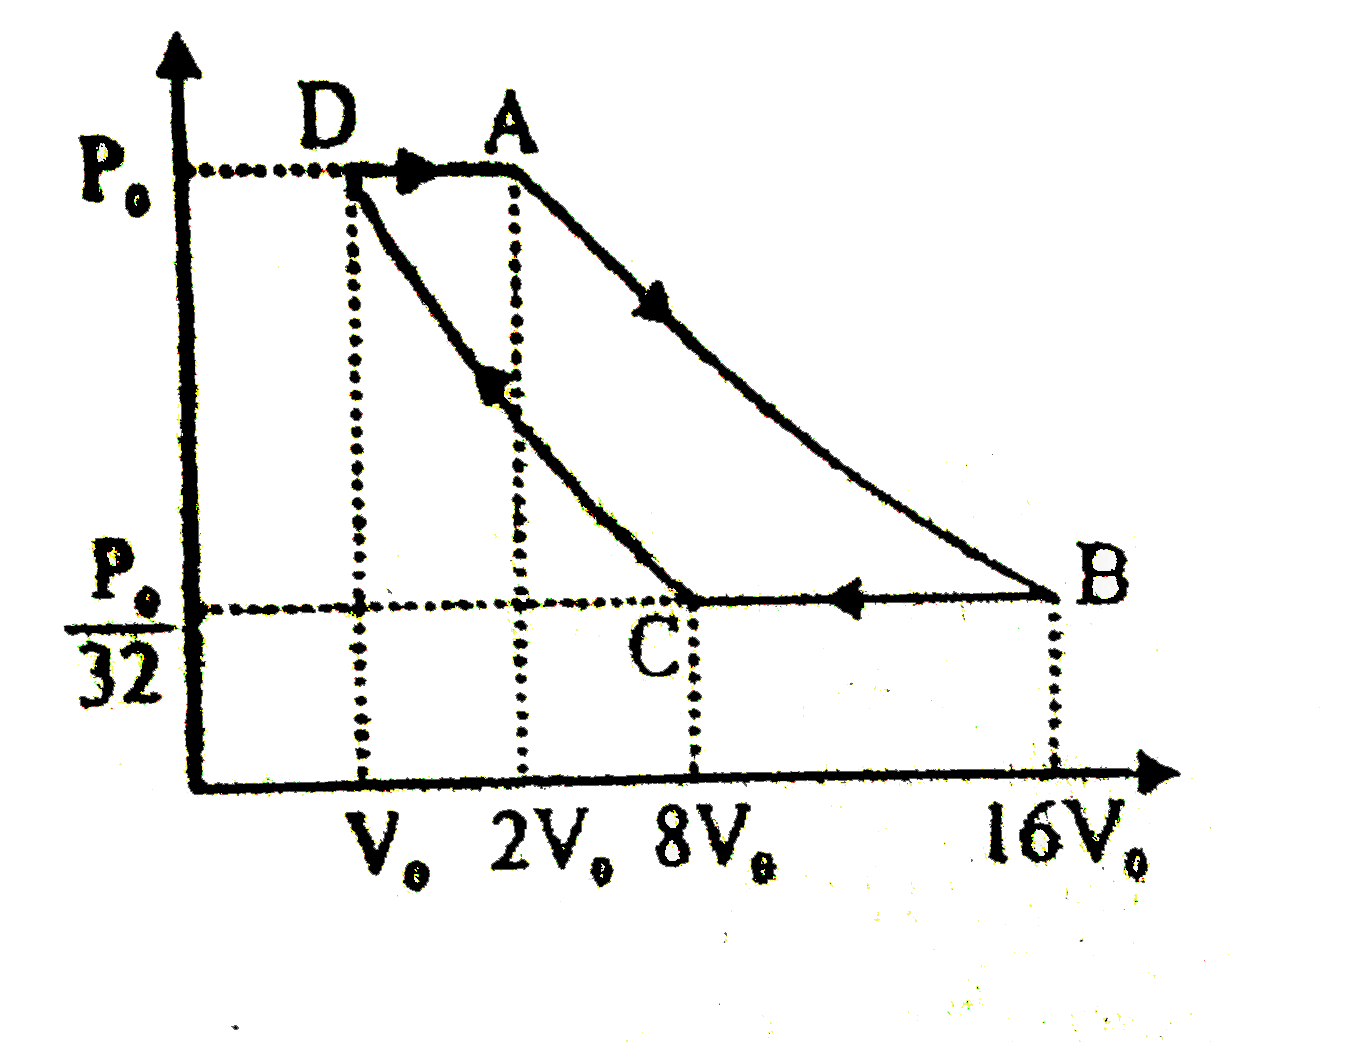
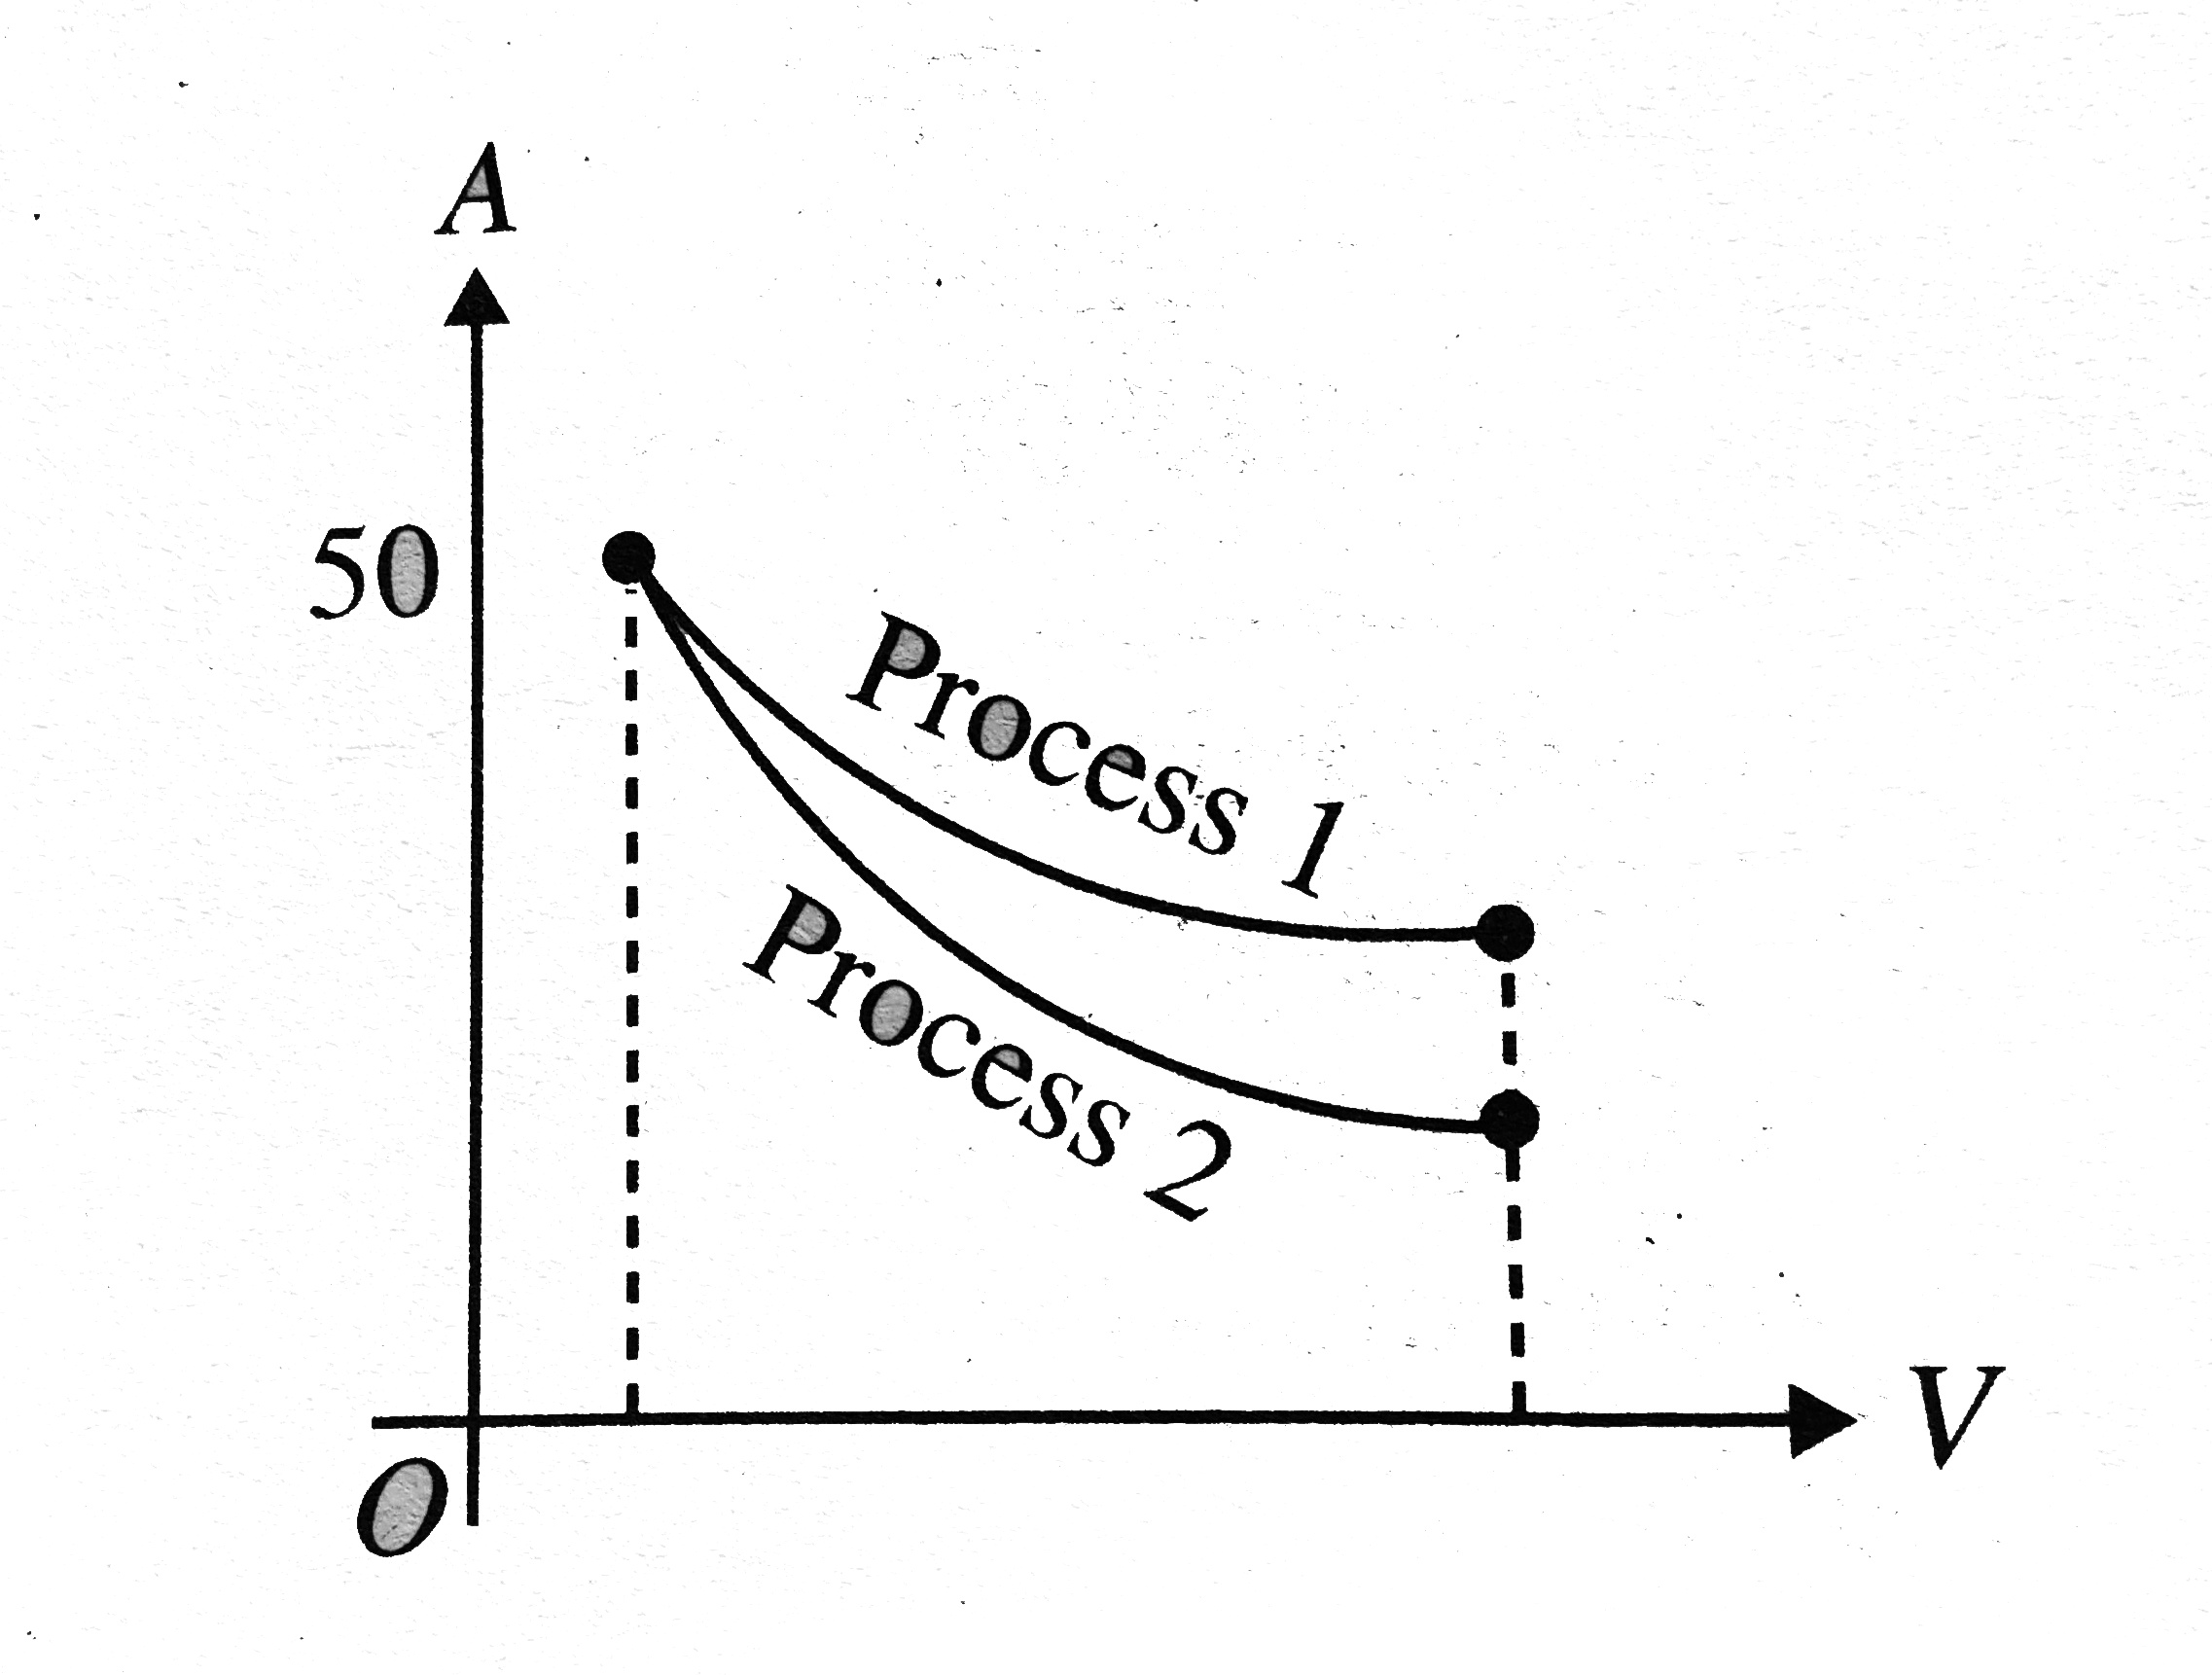
The indicator diagram for two processes 1 and 2 carrying on an ideal gas is shown in Fig. If m1 and m2 be the slopes (dP/dV) for process 1 and process 2, respectively, then
m1=m2
m1>m2
m1<m2
m2CV=m1CP
The correct Answer is:C, D
During expansion, an isotherm lies above an adiabat
Also ( Slope of an adiabat ) γ( Slope of an isotherm )
⇒m2=CpCv(m1)
⇒m2Cv=m1Cp
Since γ−1,
⇒m2>m1
Topper's Solved these Questions
- KINETIC THEORY OF GASES AND FIRST LAW OF THERMODYNAMICSBOOK - CENGAGE PHYSICSCHAPTER - KINETIC THEORY OF GASES AND FIRST LAW OF THERMODYNAMICSEXERCISE - Assertion-Reasoning
6 Videos
- KINETIC THEORY OF GASES AND FIRST LAW OF THERMODYNAMICSBOOK - CENGAGE PHYSICSCHAPTER - KINETIC THEORY OF GASES AND FIRST LAW OF THERMODYNAMICSEXERCISE - Comprehension
56 Videos
- KINETIC THEORY OF GASES AND FIRST LAW OF THERMODYNAMICSBOOK - CENGAGE PHYSICSCHAPTER - KINETIC THEORY OF GASES AND FIRST LAW OF THERMODYNAMICSEXERCISE - Single Correct
140 Videos
- KINETIC THEORY OF GASESBOOK - CENGAGE PHYSICSCHAPTER - KINETIC THEORY OF GASESEXERCISE - Compression
2 Videos
- LINEAR AND ANGULAR SIMPLE HARMONIC MOTIONBOOK - CENGAGE PHYSICSCHAPTER - LINEAR AND ANGULAR SIMPLE HARMONIC MOTIONEXERCISE - Multiple Correct Answer Type
9 Videos
Similar Questions
Knowledge Check
The process on an ideal gas, shown in figure,is <br><imga≤ocr_imageload∈g=lazysrc=https://d10lpgp6xz60nq.cloudfront.net/physics_imagesHCV_VOL2_C24_E01_027_Q01.pngwh=80%mx-autosty≤=background:white;>
A(a)isothermalB(b)isobaricC(c)isochoricD(d)none of these.V−T diagram for a process of given mass of ideal gas is as shown in fig. During the process pressure of the gas
_E01_072_Q01.png) AFirst increases then decreasesBFirst decreases then increasesCcontinously decreasesDcontinously increases
AFirst increases then decreasesBFirst decreases then increasesCcontinously decreasesDcontinously increasesFor an ideal gas four processes are marked as 1,2,3 and 4 on P-V diagram as shown in figure. The amount of heat supplied to the gas in the process 1,2,3 and 4 are Q1,Q2,Q3 and Q4 respectively, then correct order of heat supplied to the gas is : [AB is process-1, AC is process-2, AD is adiabatic process-3 and AE is process-4]
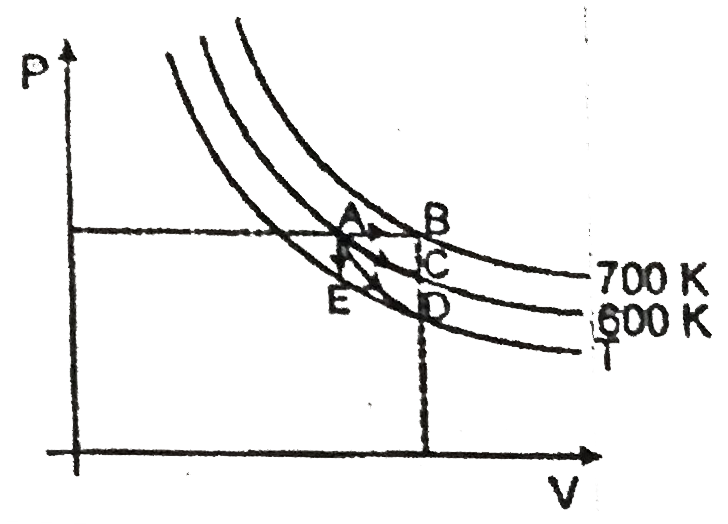 AQ1>Q2>Q3>Q4BQ1<Q2<Q3<Q4CQ1>Q2>Q4>Q3DQ1>Q4>Q2>Q3
consider two processes on a system on a system as shown in
the volumes in the initial states are the same in the two processes and the volume in the final states are also the same.Let ΔW1andΔW2 be the work done by the sustem in the processes A and B respectively.
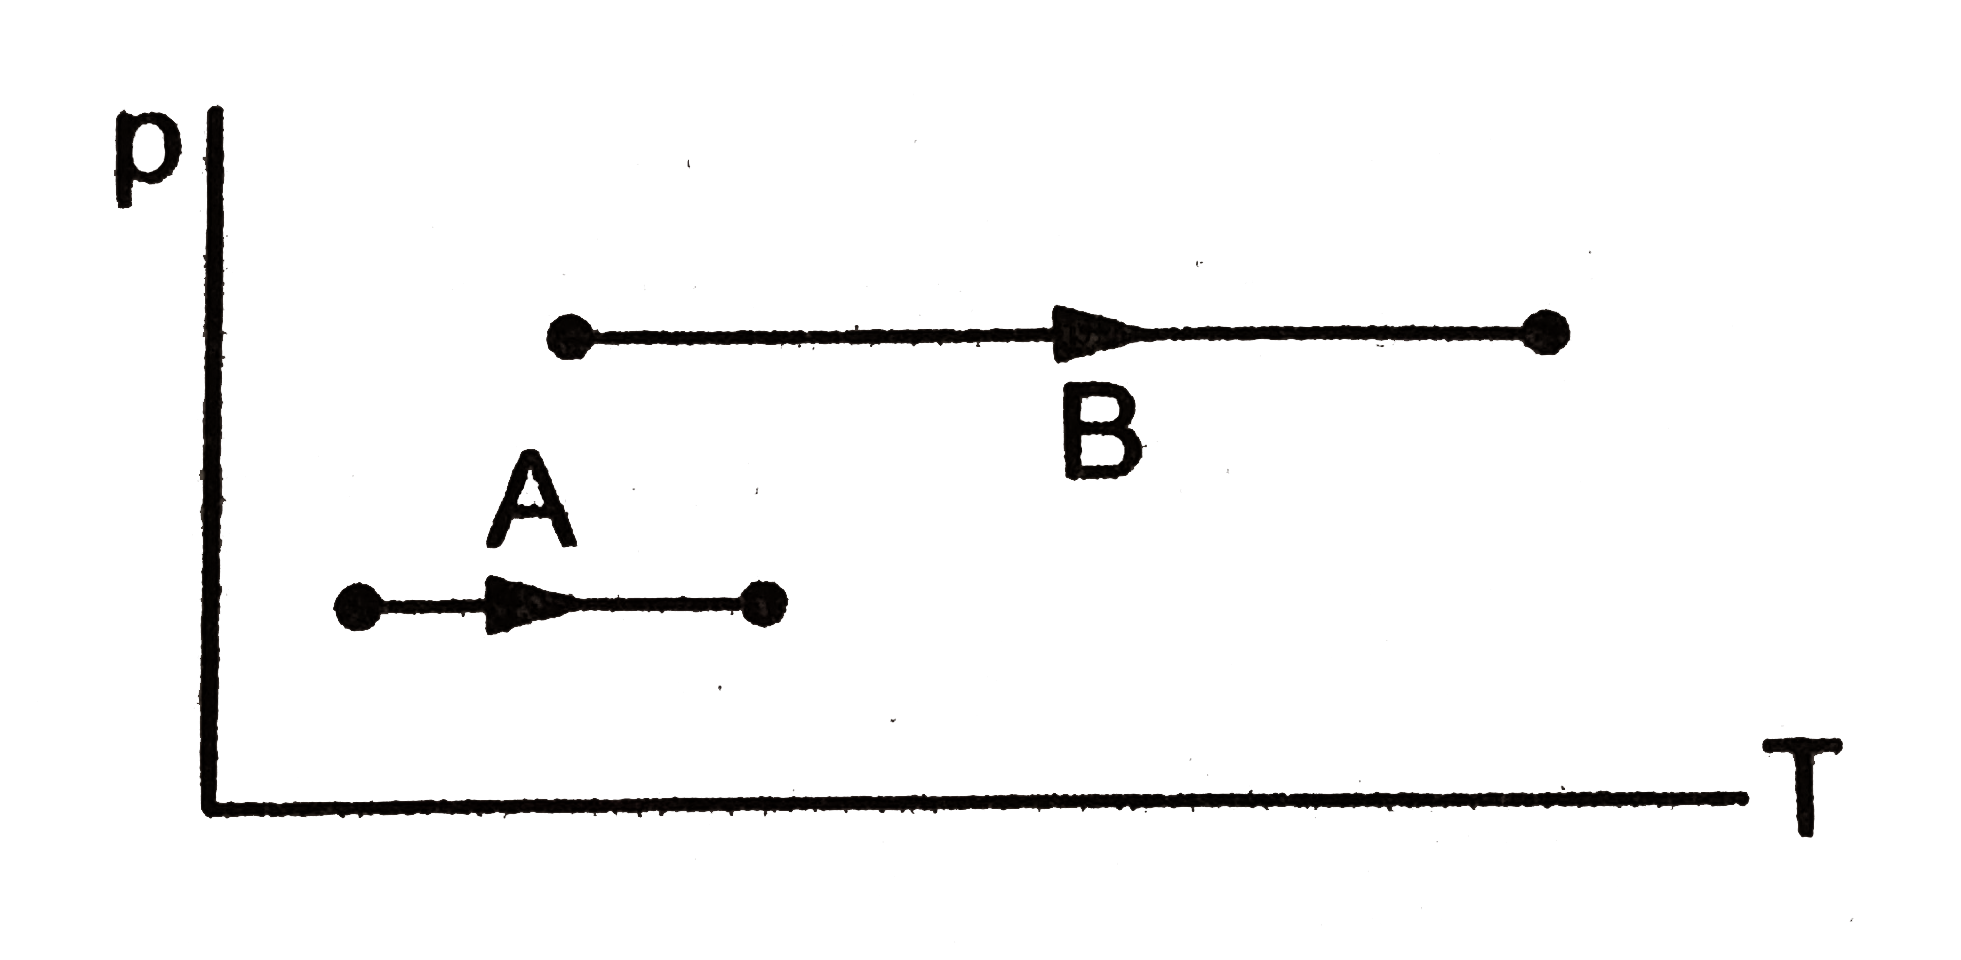
View SolutionConsider the two process on a system as shown in figure. The volumes in the initial state and in the final state are the same in the two process A and B. If W1 and W2 be the work done by the system in the processes A and B respectively then-
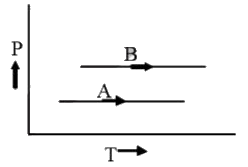
View SolutionConsider two processes on a system as shown in figure.
The volumes in the initial states are the same in the two processes and the volume in the final states are also the same.Let ΔW1 and ΔW2 be the work done by the system in the processes A and B respectively.

View Solution
Two moles of an ideal monoatomic gas is taken through a cyclic process as shown in the P-T diagram. In the process BC, PT−2= constant. Then the ratio of heat absorbed and heat released by the gas during the process AB and process BC respectively as.
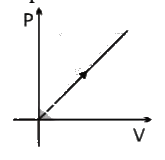
View SolutionDuring the thermodynamic process shown in figure for an ideal gas
View Solution

