Interpret the following Ellingham diagram.
 .
.
Video Solution
Text Solution
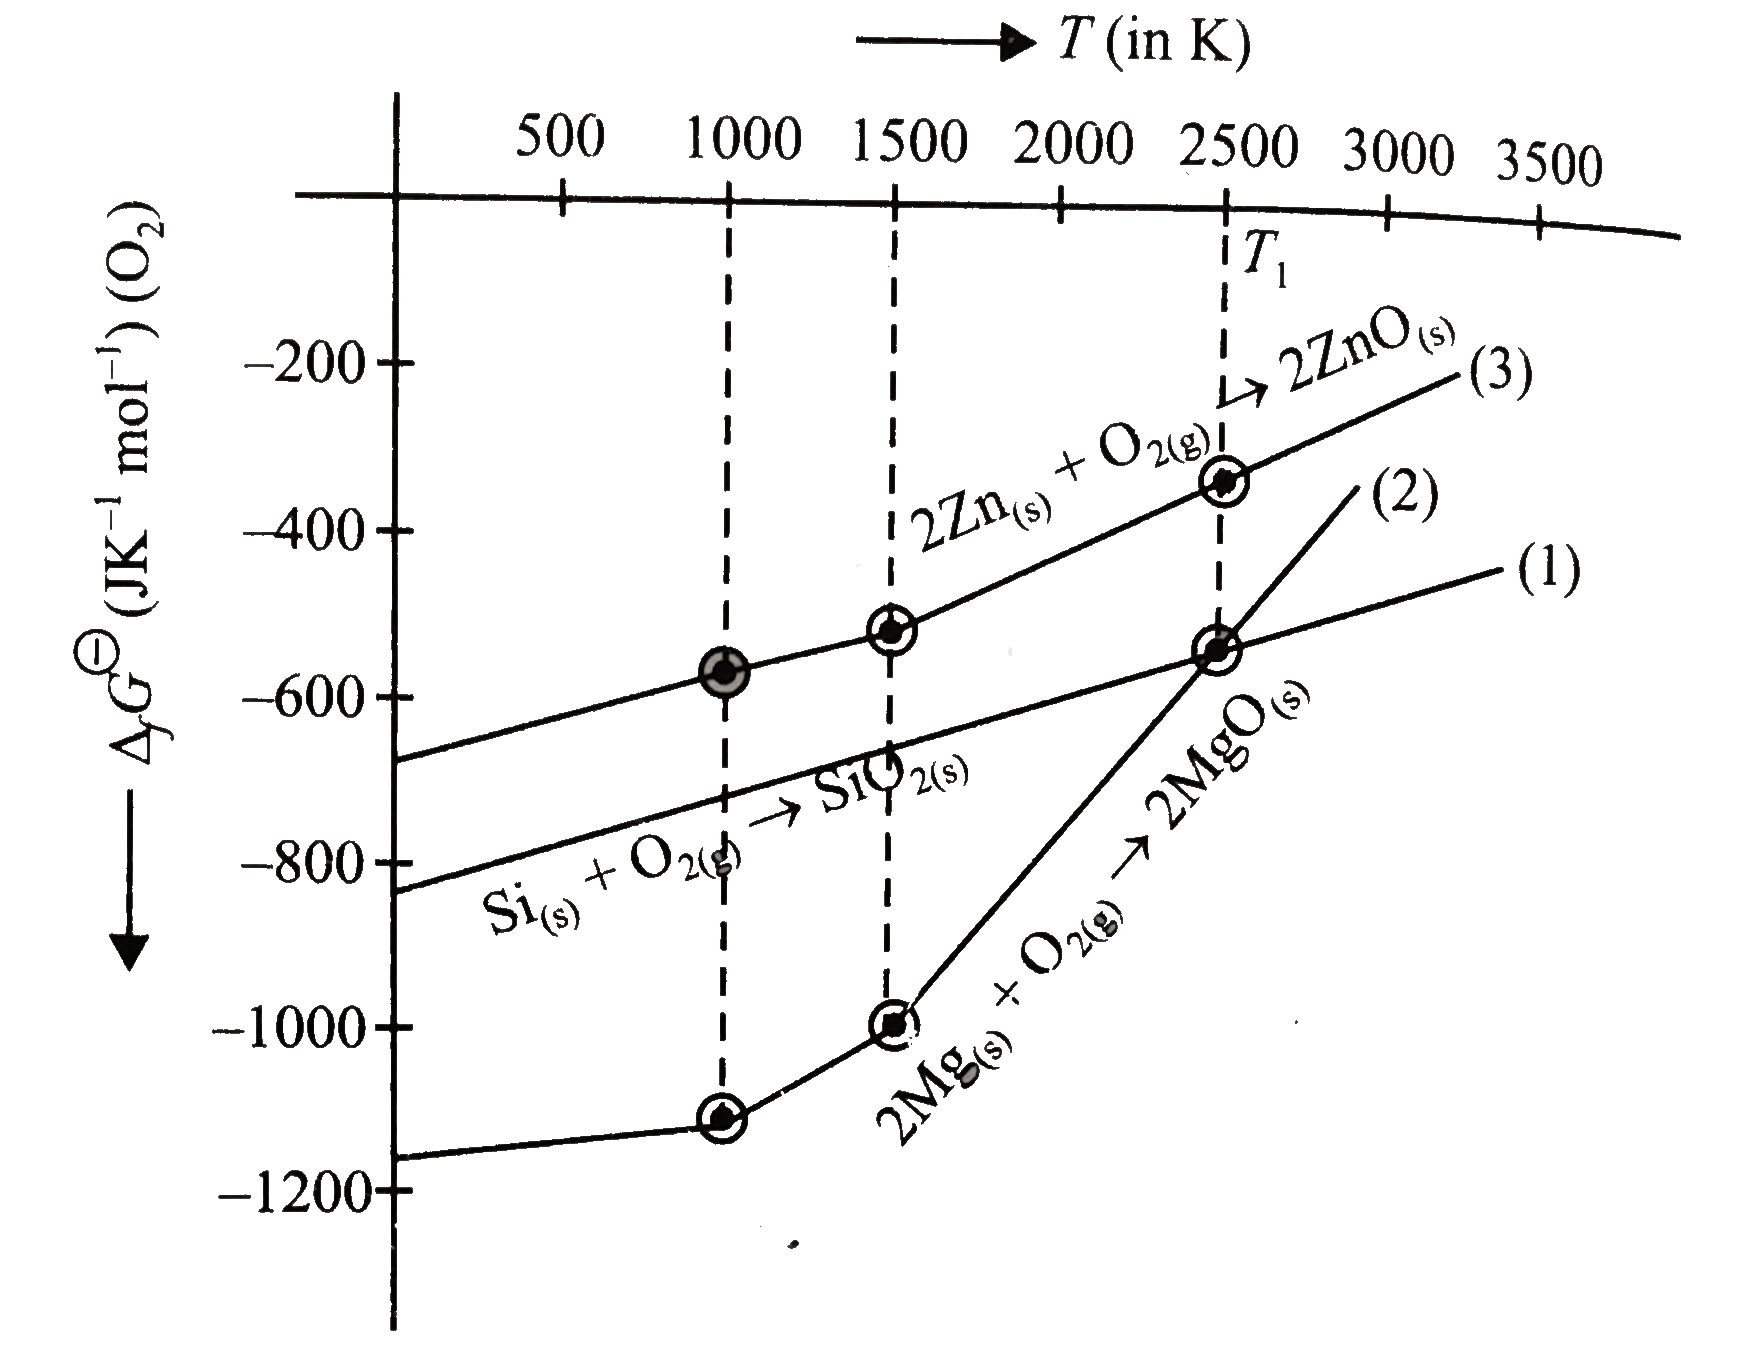
(1) Si(s)+O2(g)→2SiO2(s)
As temperature increases, ΔfGӨ becomes less negative , hence SiO2(s) becomes less stable, i.e., at 500K,SiO2 is more stable than 2500K.
(2) 2Mg(s)+O2(g)→2MgO(s)
Abrupt changes in the plot at ~800K and ~1400K denote phase change//transition from s→1 and 1→g, respectively and represent melting point (~800K) and boiling point (~1400K). MgO(s) becomes less stable with increase in temperature.
At T1, lines of (1) and (2) intersect. One can conclude the following :
(a) At T1, both MgO and SiO2 are equally stable.
(b) At temperature >T1,MgO is less stable than SiO2 Hence, Si will reduce MgO to Mg.
2MgO+Si→SiO2+2Mg
( c) At temperature <T1,SiO2 is less stable than MgO.
Hence, Mg will reduce SiO2 to Si
SiO2+2Mg→2MgO+Si
Relative stability of MgO and SiO2 at given temperature can be predicted with the help of Ellingham diagram.
(3) 2Zn(s)+O2(g)→2ZnO(s)
ΔfGӨ(ZnO)>ΔfGӨ(MgO)
ΔfGӨ(ZnO)>ΔӨf(SiO2)
Hence, both Mg(s) and Si(s) can be used as reducing agent for reducing ZnO(s) to Zn(s).
|
Updated on:21/07/2023
Topper's Solved these Questions
- BOOK - CENGAGE CHEMISTRYCHAPTER - GENERAL PRINCIPLES AND PROCESS OF ISOLATION OF ELEMENTSEXERCISE - Solved Example25videos
GENERAL PRINCIPLES AND PROCESS OF ISOLATION OF ELEMENTS
- BOOK - CENGAGE CHEMISTRYCHAPTER - GENERAL PRINCIPLES AND PROCESS OF ISOLATION OF ELEMENTSEXERCISE - Exs 1.1 (Subjective)25videos
GENERAL PRINCIPLES AND PROCESS OF ISOLATION OF ELEMENTS
- BOOK - CENGAGE CHEMISTRYCHAPTER - ELECTROCHEMISTRYEXERCISE - Archieves Subjective35videos
ELECTROCHEMISTRY
- BOOK - CENGAGE CHEMISTRYCHAPTER - GRIGNARD REAGENTS AND ORGANOMETALLIC REAGENTSEXERCISE - Exercises Archives (Linked Comprehension)1videos
GRIGNARD REAGENTS AND ORGANOMETALLIC REAGENTS
Similar Questions
Knowledge Check
- Question 1 - Select One
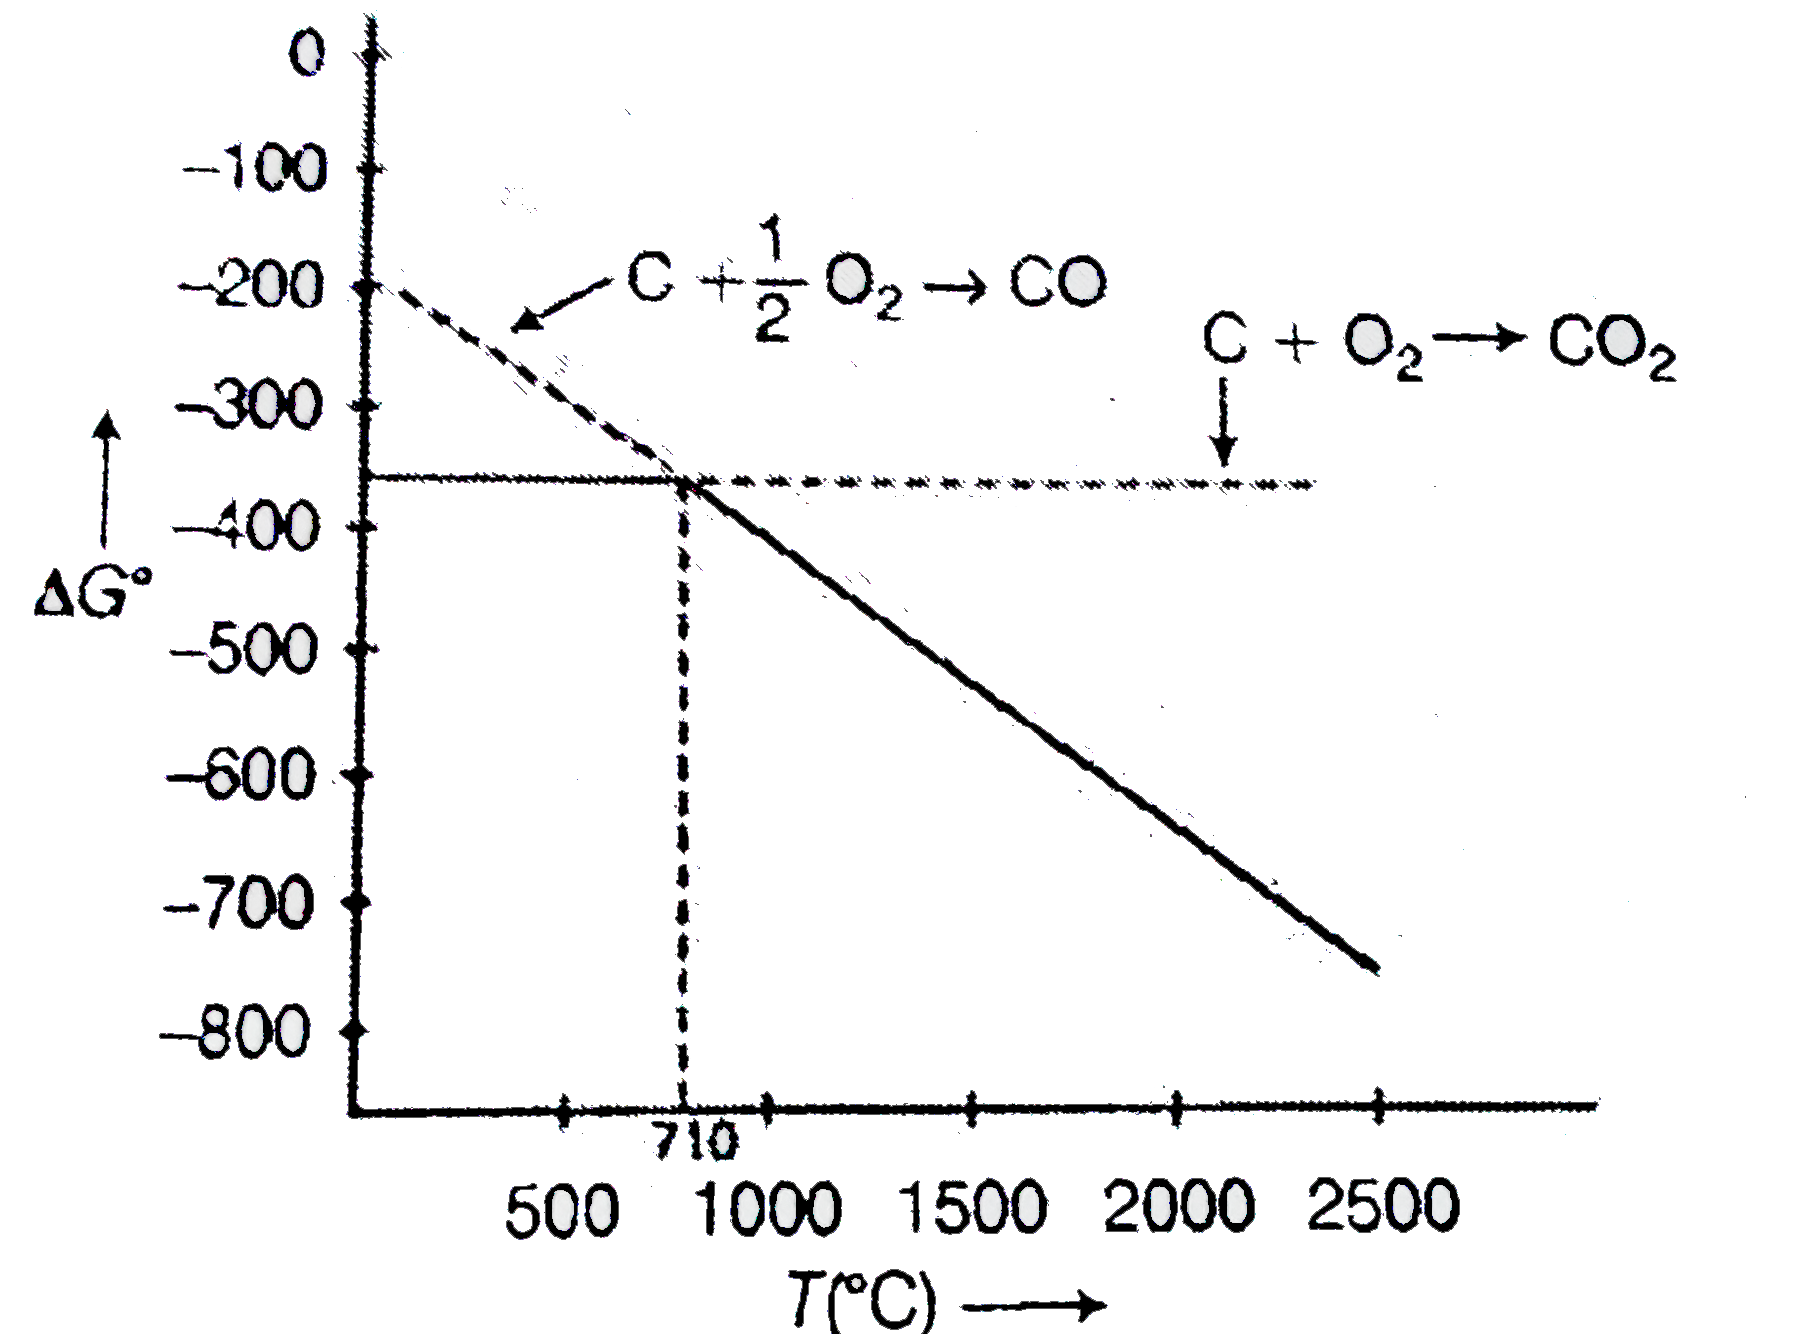
Consider the following Ellingham diagram for carbon

Which of the following statements is incorrect for the above Ellingham diagramAUpto 710∘C, the reaction of formation of CO2 is energetically more favourable but above 710∘C, the formation of CO is preferredBCarbon can be used to reduce any metal oxide at a sufficiently high temperatureCCarbon reduces many oxides at elevated temperature because ΔG∘ vs temperature line has a negative slopeDΔS∘[C(s)+12O2(g)→CO(g)]
<ΔS∘[C(s)+O2(g)→CO(g)] - Question 2 - Select One
Ellingham Diagram is useful
ATo know thetempreature where phase transformation ocuursBTo know the temperature where metal oxide decompose on its ownCTo select suitable reducing agent for reduction of metal oxideDAll of the above - Question 3 - Select One
Ellingham Diagram is useful
ATo know thetempreature where phase transformation ocuursBTo know the temperature where metal oxide decompose on its ownCTo select suitable reducing agent for reduction of metal oxideDAll of the above


