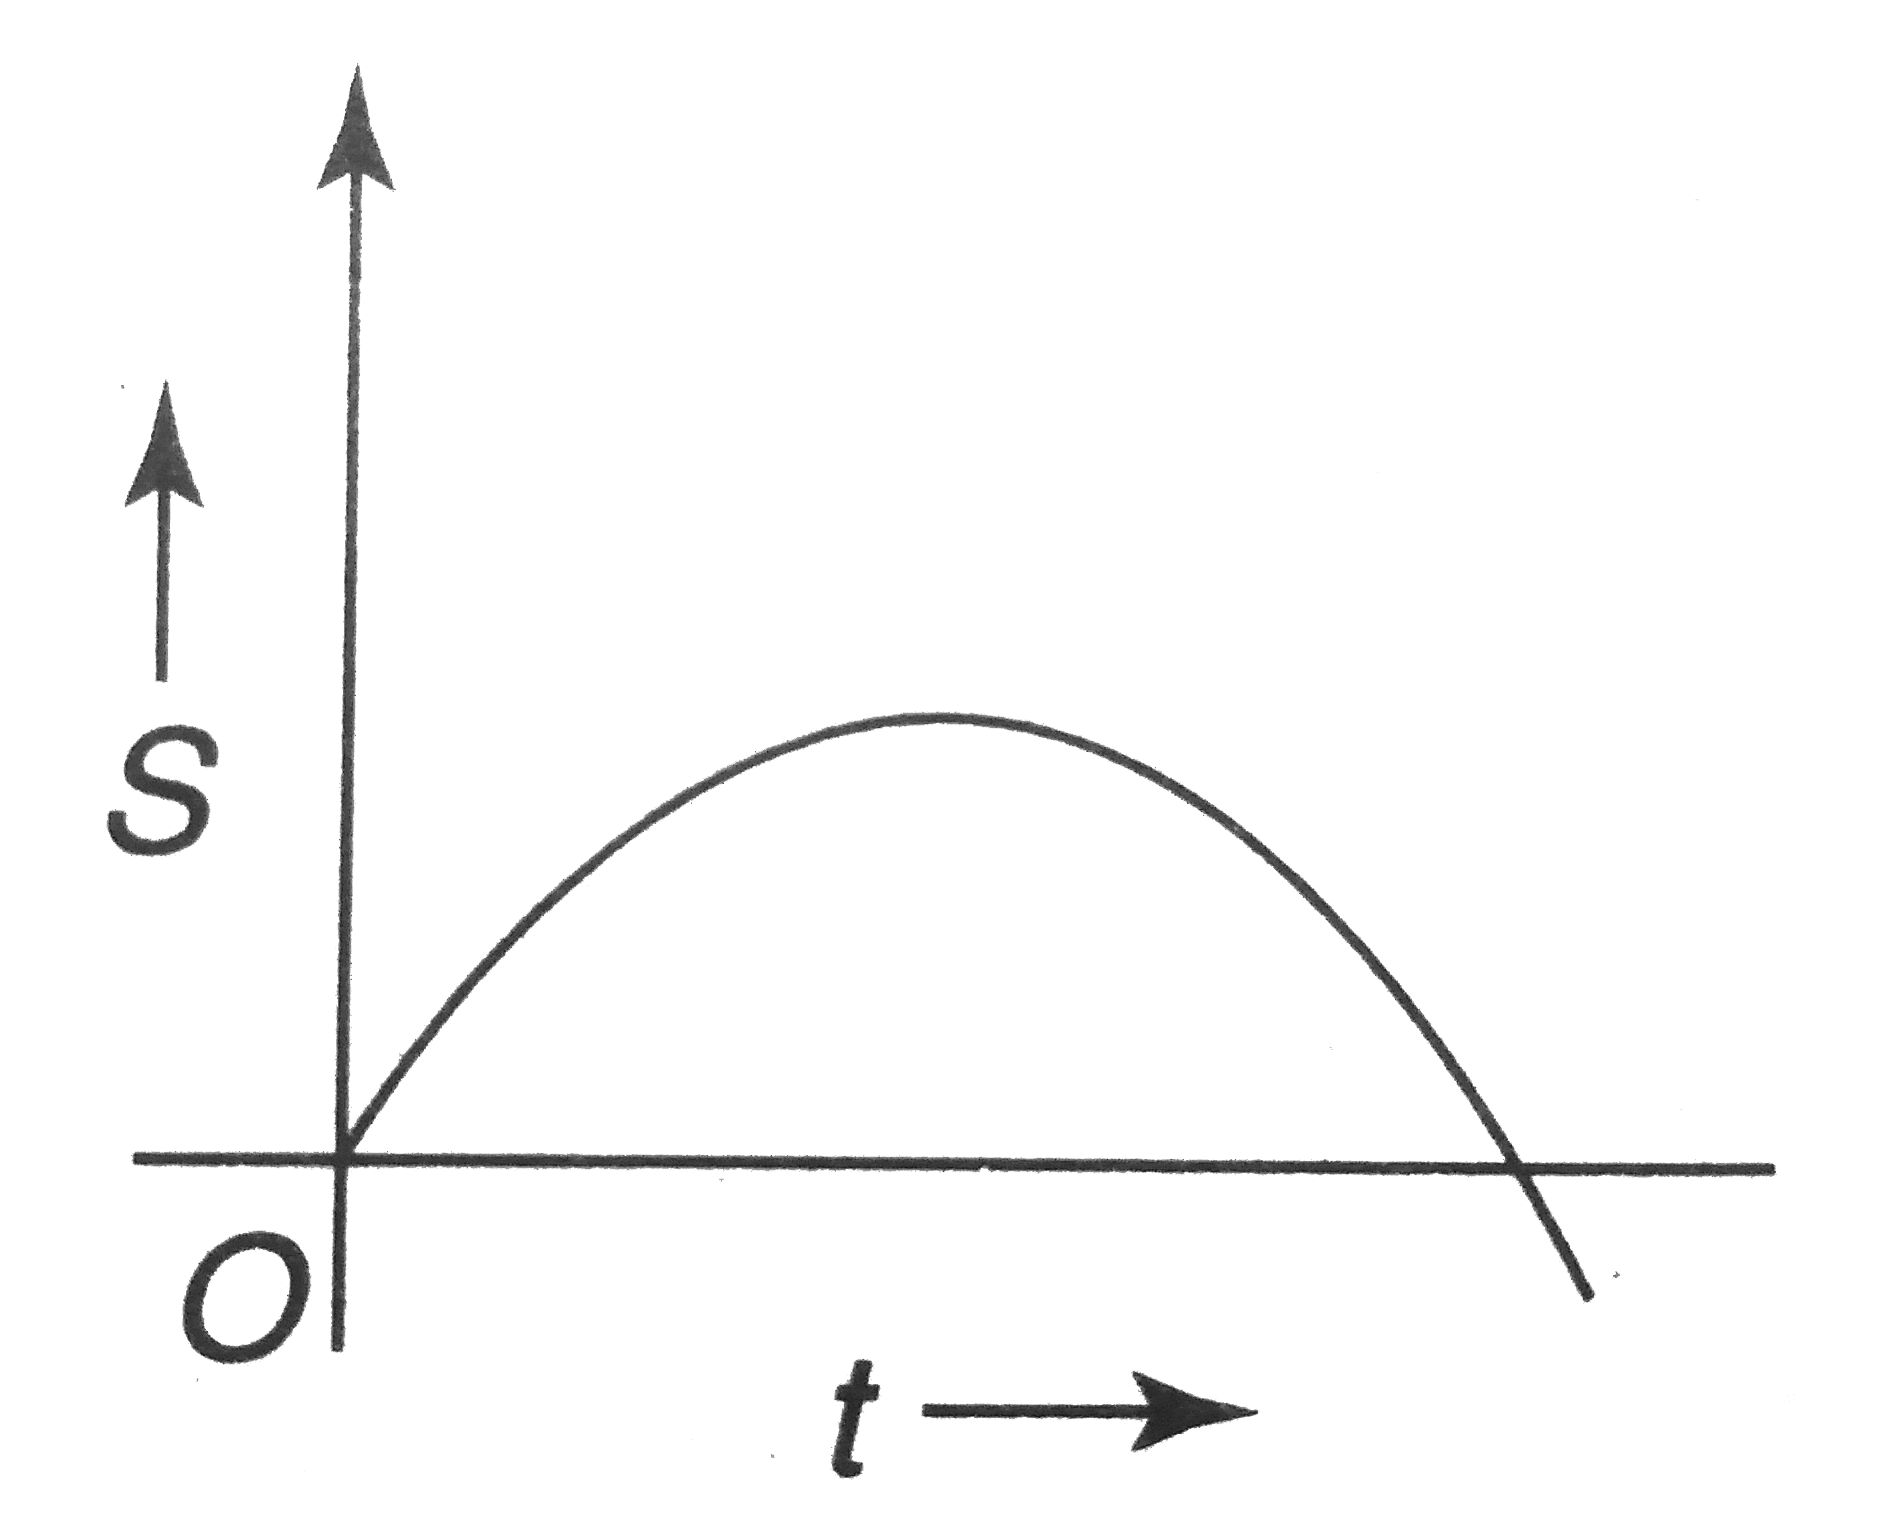
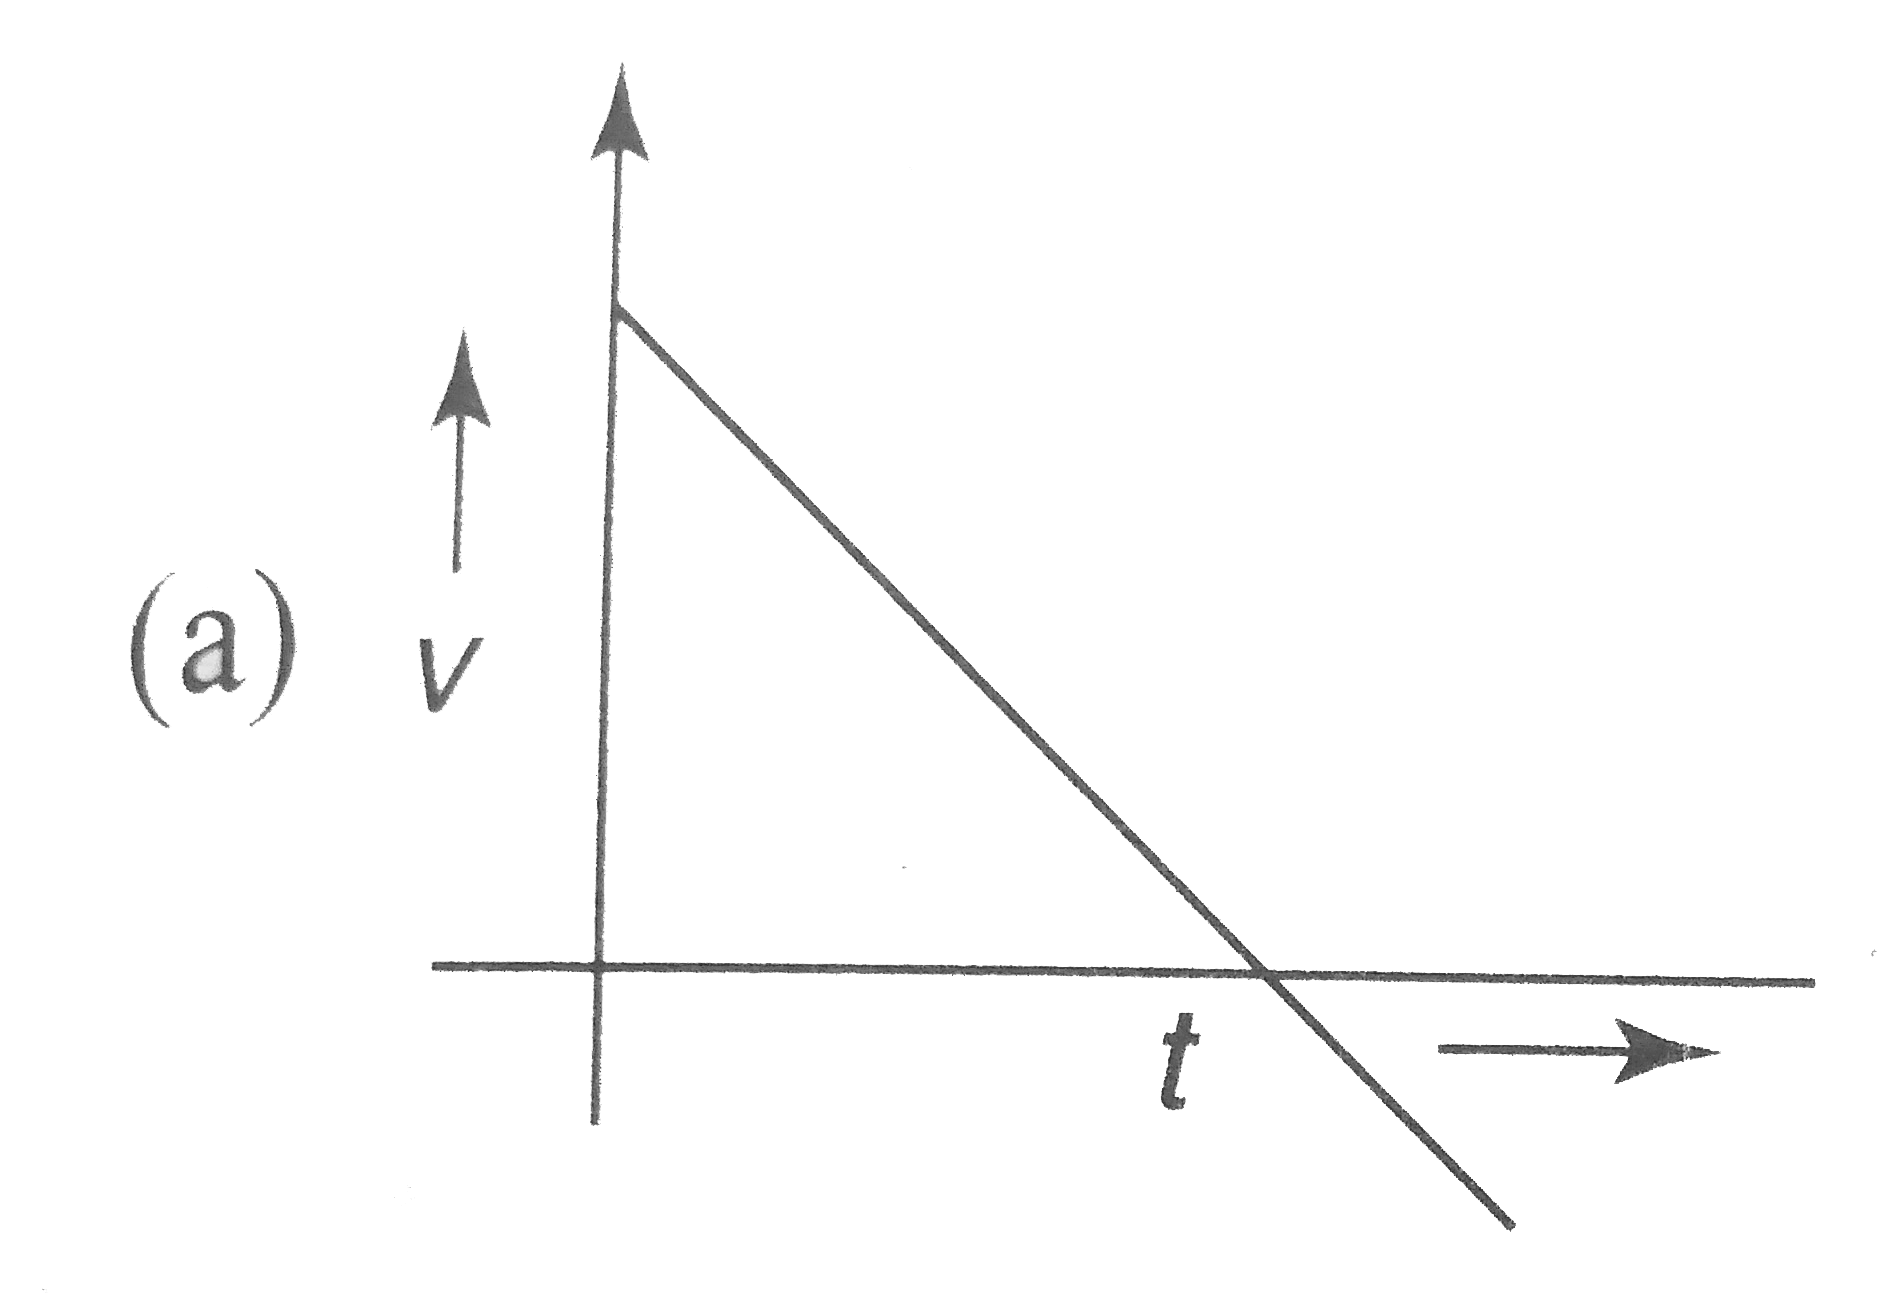
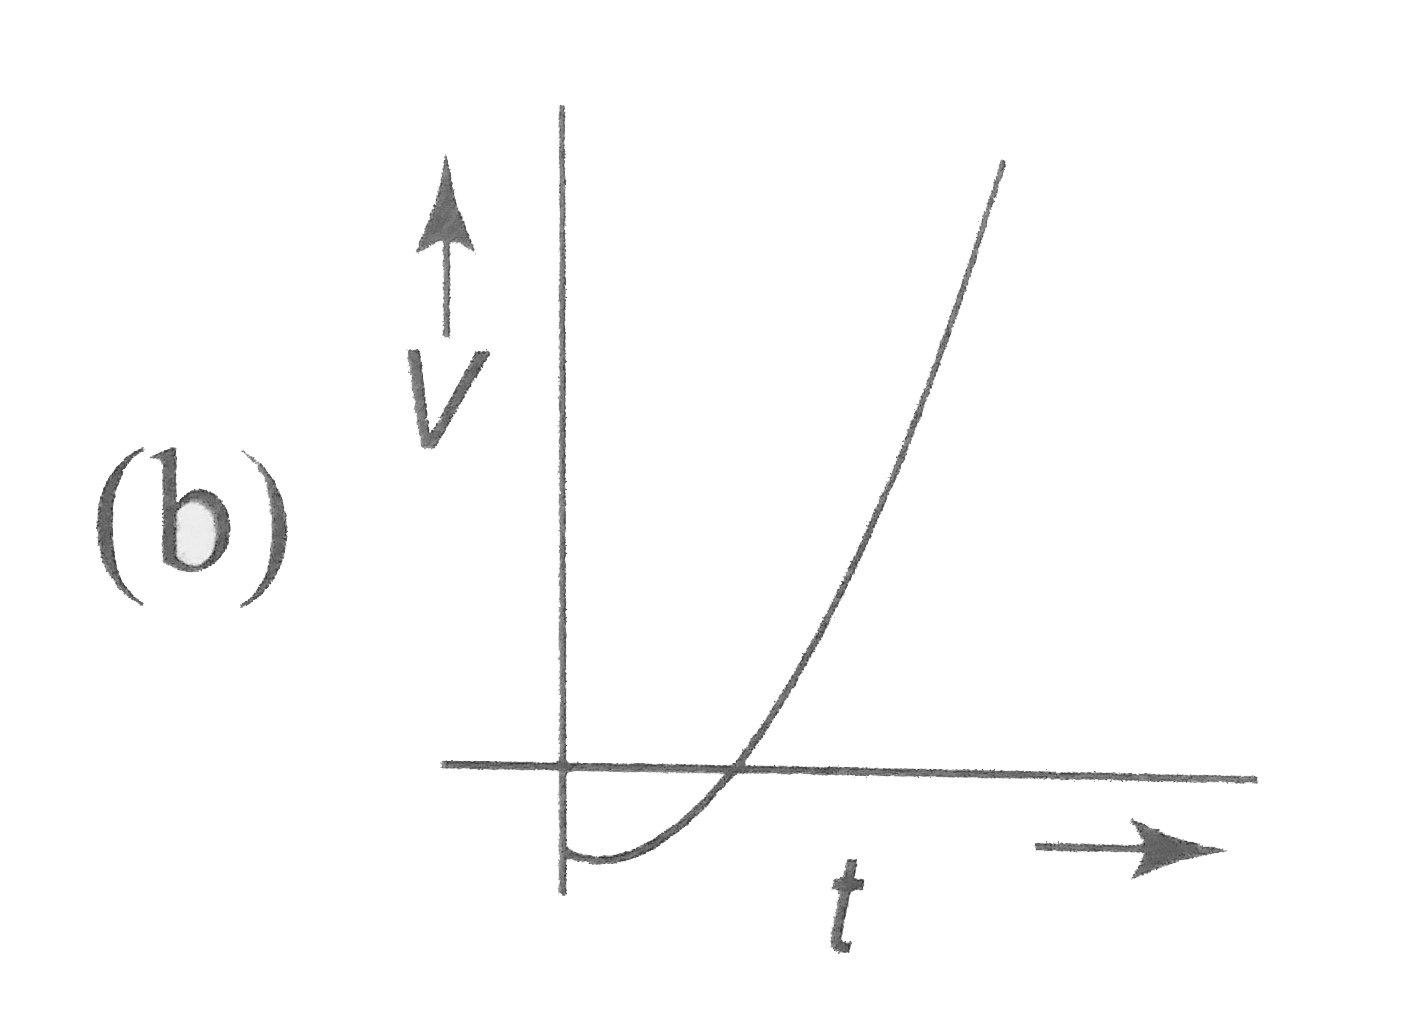
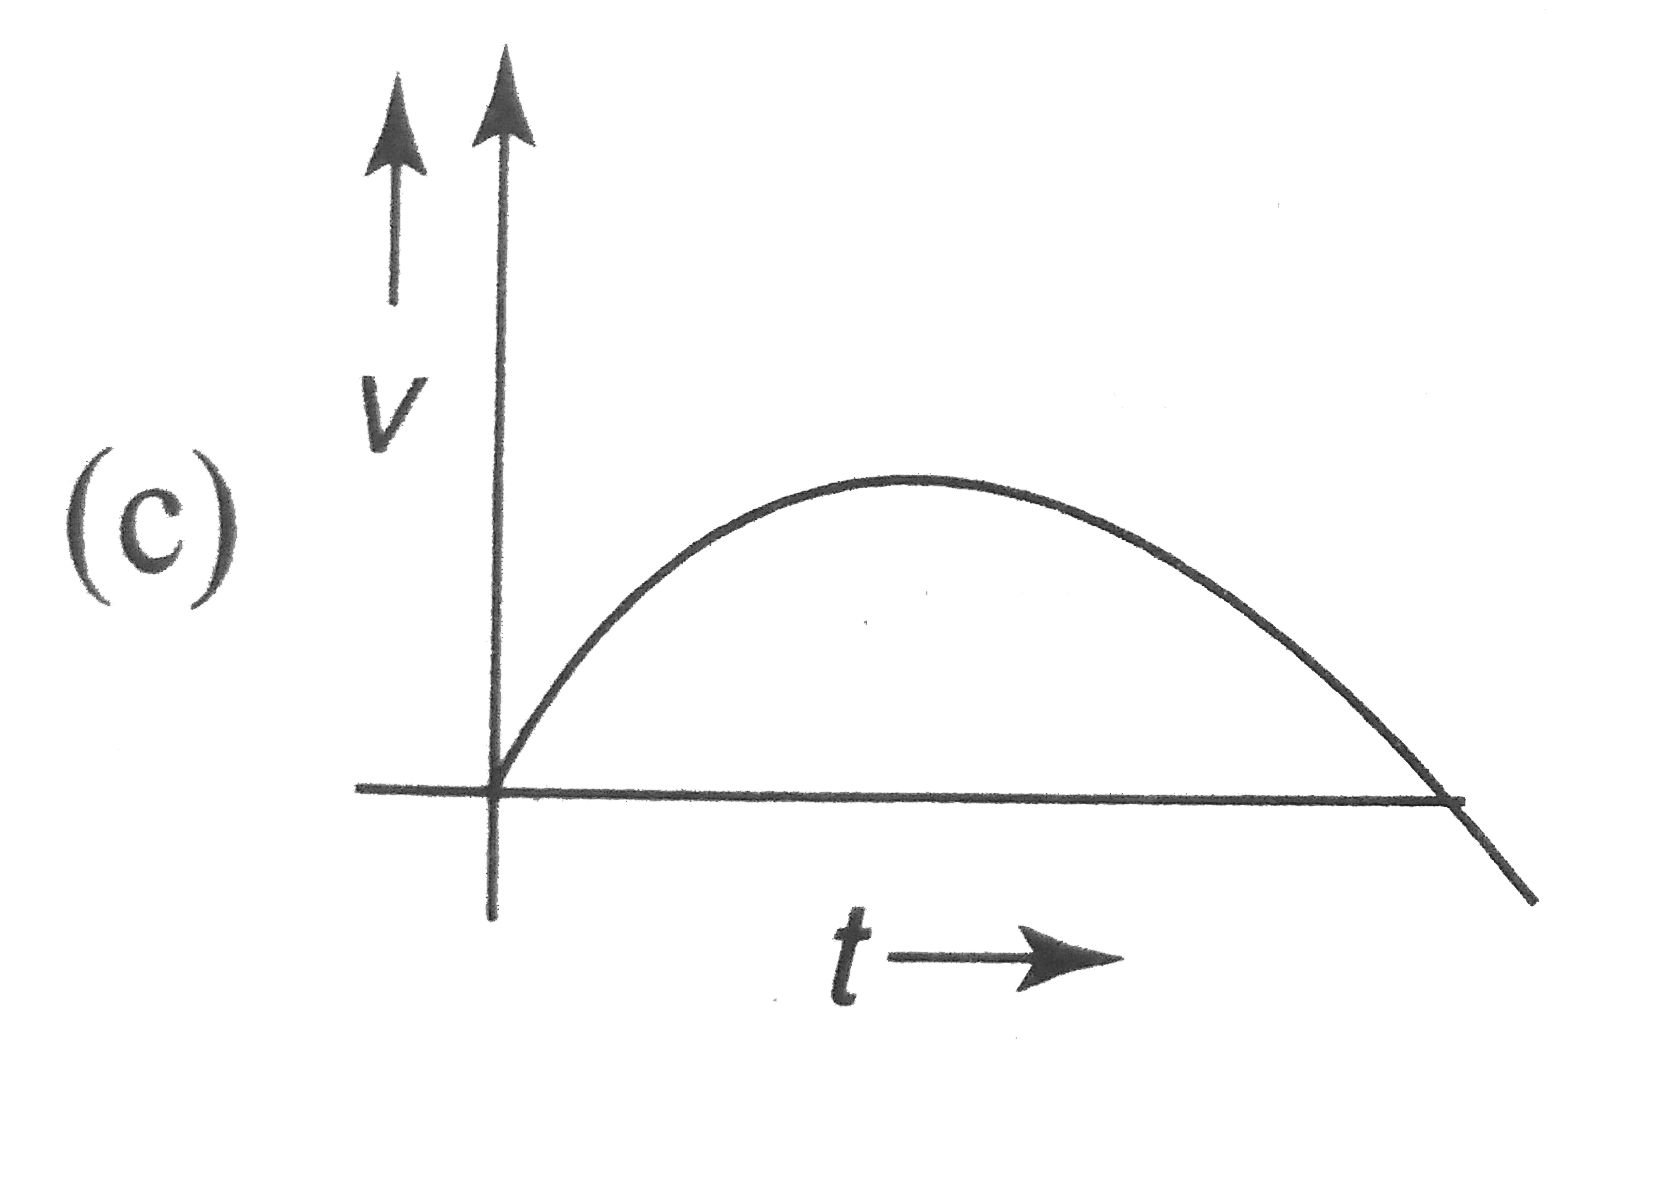
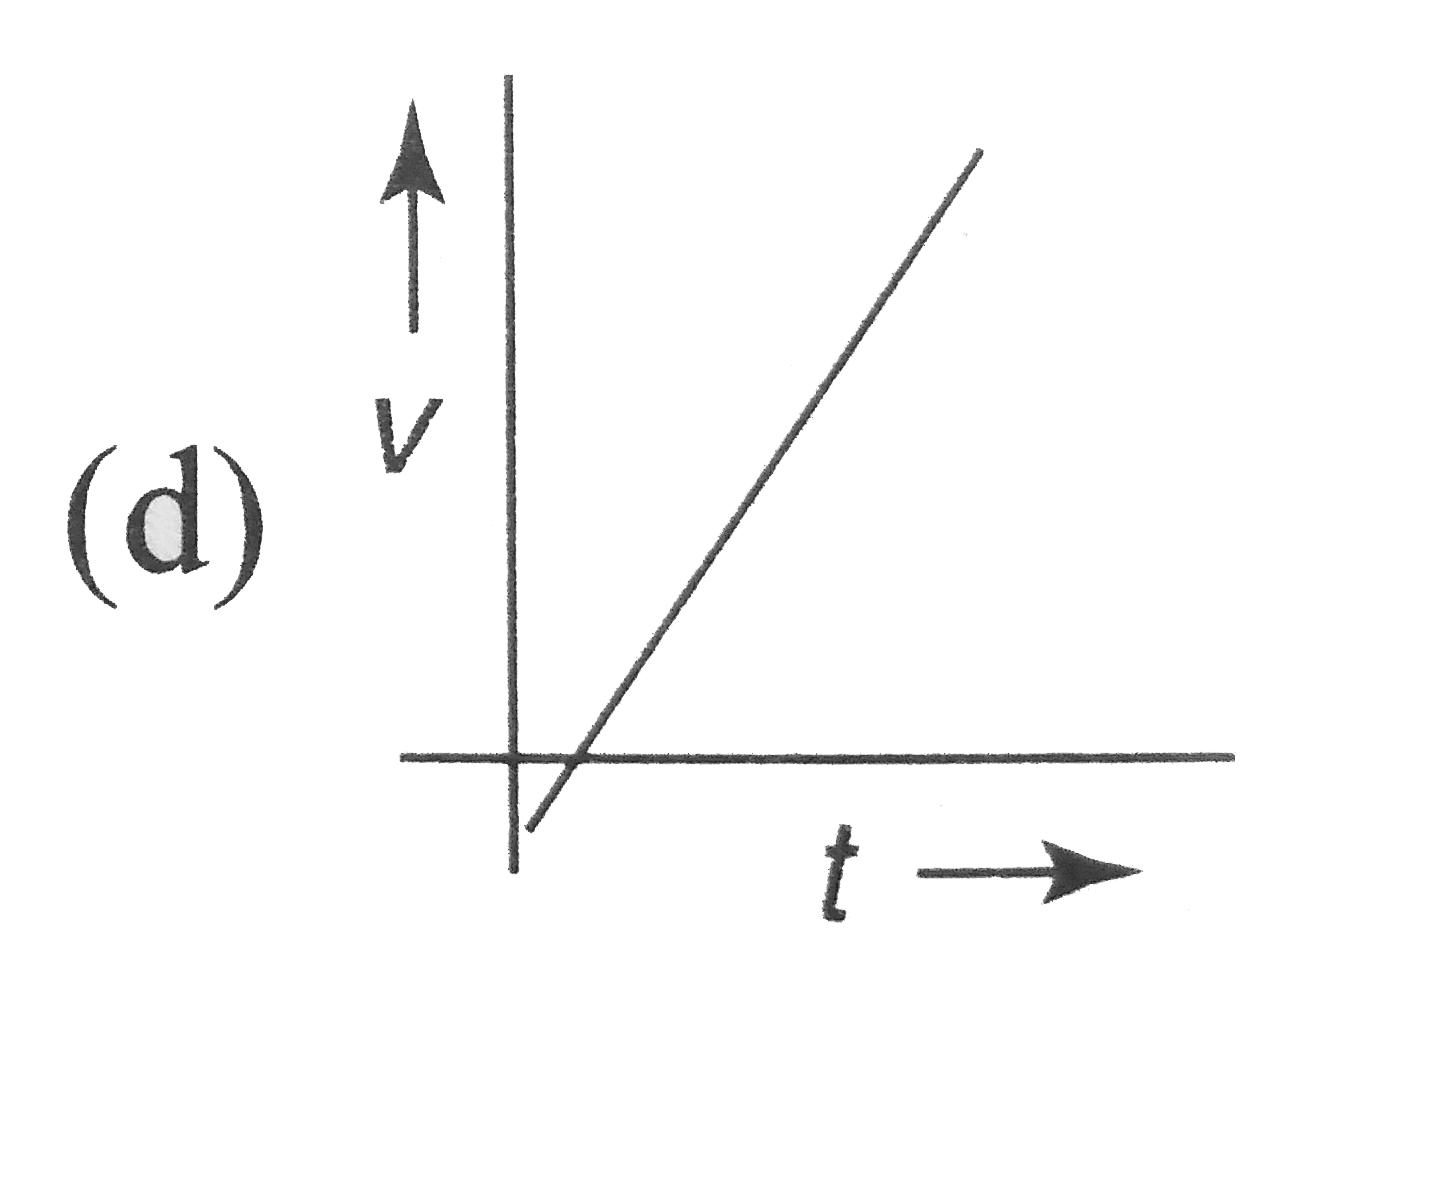
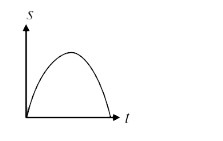
The graph of displacement versus time is shown. Its corresponding velocity-time graph will be.
 .
.
 .
.
 .
.
The correct Answer is:A
As slope of s−t graph decreases with t, so v−t will decrease. At the top of the graph slope is zero, so velocity is zero. In the downward journey slope of s−t graph increases negatively. So velocity represented by it will be negative.
Topper's Solved these Questions
- GENERAL KINEMATICS AND MOTION IN ONE DIMENSIONBOOK - A2ZCHAPTER - GENERAL KINEMATICS AND MOTION IN ONE DIMENSIONEXERCISE - Problem Based On Mixed Concepts
30 Videos
- GENERAL KINEMATICS AND MOTION IN ONE DIMENSIONBOOK - A2ZCHAPTER - GENERAL KINEMATICS AND MOTION IN ONE DIMENSIONEXERCISE - Assertion Reasoning
20 Videos
- GENERAL KINEMATICS AND MOTION IN ONE DIMENSIONBOOK - A2ZCHAPTER - GENERAL KINEMATICS AND MOTION IN ONE DIMENSIONEXERCISE - Relative Motion In One Dimension
20 Videos
- FLUID MECHANICSBOOK - A2ZCHAPTER - FLUID MECHANICSEXERCISE - Chapter Test
29 Videos
- GRAVITATIONBOOK - A2ZCHAPTER - GRAVITATIONEXERCISE - Chapter Test
29 Videos
Similar Questions
The displacement -time (x– t) graph of a body is given as
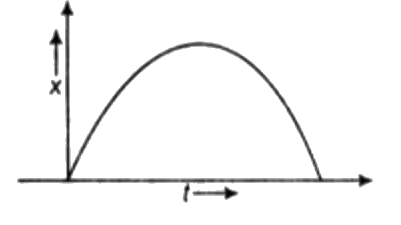
The corresponding velocity -time (v – t ) graph will be
View SolutionAcceleration versus velocity graph of a particle moving in a straight line starting form rest is as shown in figure. The corresponding velocity-time graph would be :
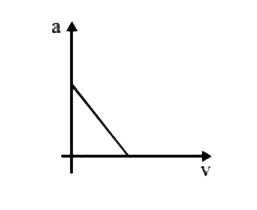
View Solution
Knowledge Check
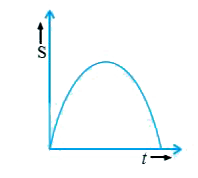
The graph of displacement v/s time is given below. Its corresponding velocity-time graph will be :
 A
A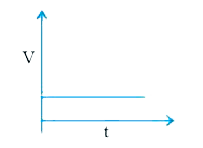 B
B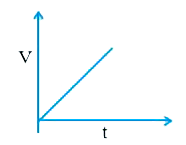 C
C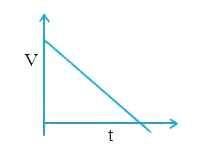 D
D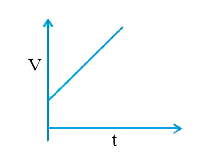
The graph of displacement vs time for a particle moving along a straight line is as shown. The best option for the corresponding velocity - time graph will be:
 A
A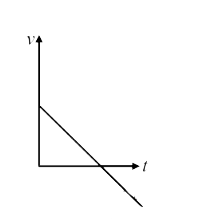 B
B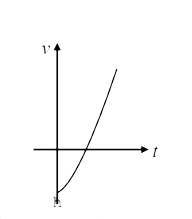 C
C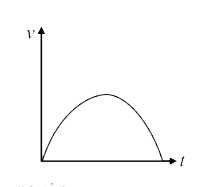 D
D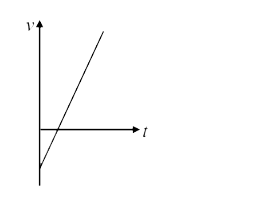
Acceleration-time graph of a body is shown. The corresponding velocity-time graph of the same body is.
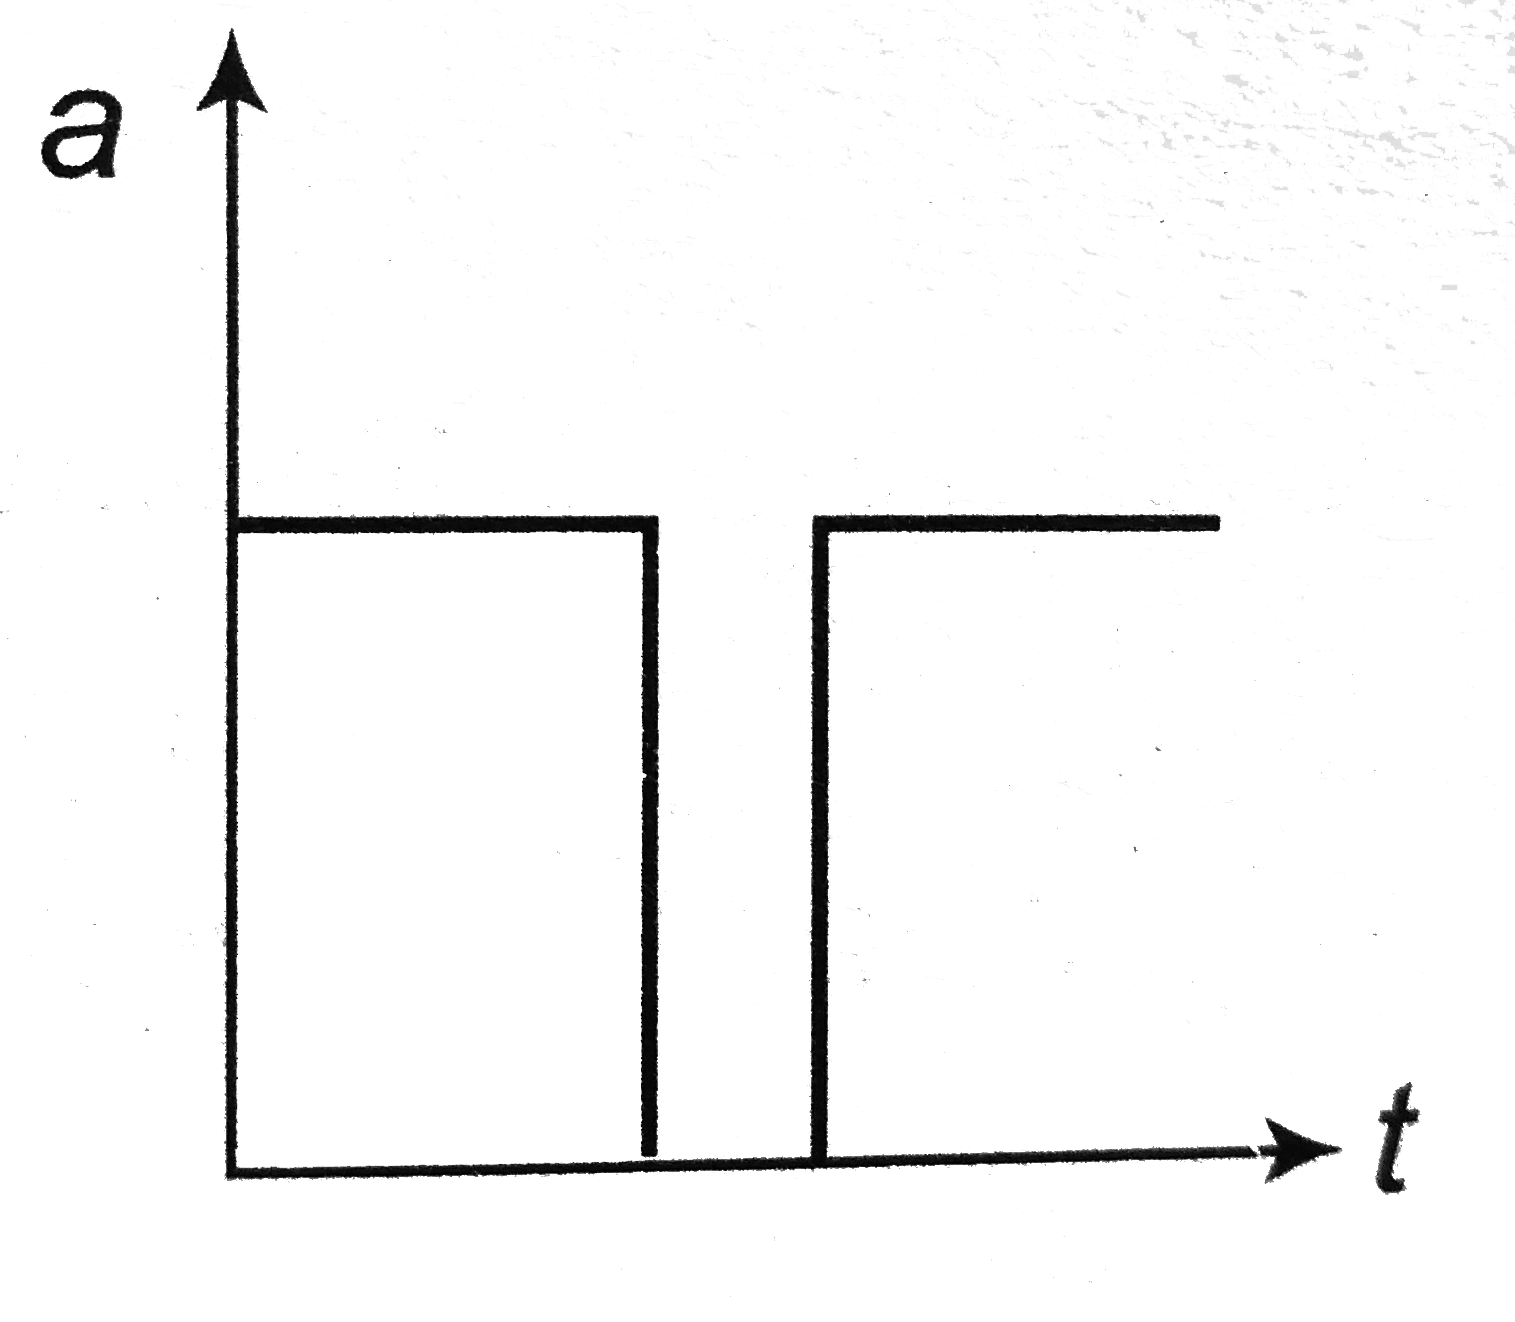 A2sB1sC32sD12s
Draw a graph of temperature versus time.
View SolutionDraw a graph of temperature versus time.
View SolutionDisplacement-time graph of a particle executing SHM is as shown
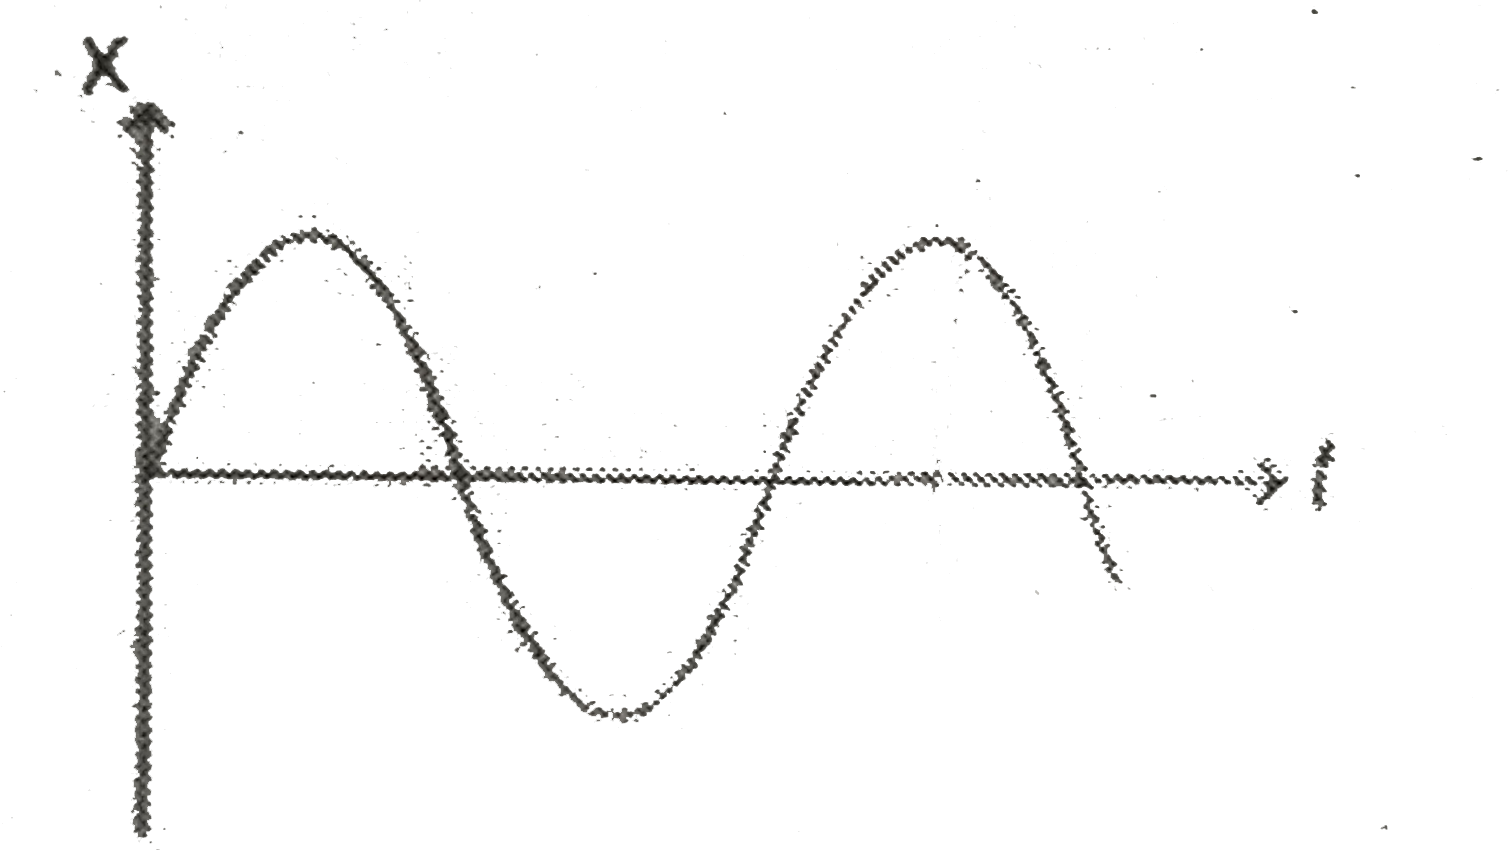
The corresponding force-time graph of the particle can be
View SolutionAcceleration time graph of a body is shown below the corresponding velocity time graph of the same body is
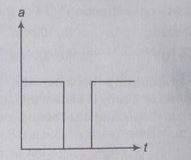
View SolutionAcceleration time graph of a body is shown below the corresponding velocity time graph of the same body is

View Solution
