The correct graph representing the variation of total energy , kinetic energy and potential energy of a satellite with its distance form the centre of earth is


The correct Answer is:C
To analyze the variation of total energy (E_t), kinetic energy (E_k), and potential energy (U) of a satellite with its distance from the center of the Earth, we can follow these steps:
Step 1: Understand the Energy Formulas
1. Potential Energy (U): The potential energy of a satellite in orbit is given by the formula:
U=−GMmr
where G is the gravitational constant, M is the mass of the Earth, m is the mass of the satellite, and r is the distance from the center of the Earth.
2. Kinetic Energy (E_k): The kinetic energy of the satellite is given by:
Ek=GMm2r
3. Total Energy (E_t): The total energy of the satellite is the sum of kinetic and potential energy:
Et=Ek+U=GMm2r−GMmr=−GMm2r
Step 2: Analyze the Variation of Energies with Distance
- As the distance r increases (moving away from the Earth):
- The Potential Energy (U) becomes less negative (increases) because it approaches zero.
- The Kinetic Energy (E_k) decreases because it is inversely proportional to r.
- The Total Energy (E_t) also becomes less negative, following the same trend as potential energy.
Step 3: Sketch the Graphs
1. Kinetic Energy (E_k):
- Starts positive and decreases as r increases.
- The graph will be a decreasing curve starting from a positive value.
2. Potential Energy (U):
- Starts from a very negative value and approaches zero as r increases.
- The graph will be a decreasing curve starting from a negative value and approaching zero.
3. Total Energy (E_t):
- Starts from a value slightly less than the potential energy and remains negative, decreasing as r increases.
- The graph will be a decreasing curve below the potential energy graph.
Step 4: Combine the Graphs
- Plot all three graphs on the same axes with energy on the y-axis and distance from the center of the Earth on the x-axis.
- The graph of kinetic energy will be above the potential energy graph, and the total energy graph will be below both.
Conclusion
Based on the analysis, the correct graph representing the variation of total energy, kinetic energy, and potential energy of a satellite with its distance from the center of the Earth corresponds to option C.
---
1. Potential Energy (U): The potential energy of a satellite in orbit is given by the formula:
U=−GMmr
where G is the gravitational constant, M is the mass of the Earth, m is the mass of the satellite, and r is the distance from the center of the Earth.
Ek=GMm2r
Et=Ek+U=GMm2r−GMmr=−GMm2r
- As the distance r increases (moving away from the Earth):
- The Potential Energy (U) becomes less negative (increases) because it approaches zero.
- The Kinetic Energy (E_k) decreases because it is inversely proportional to r.
- The Total Energy (E_t) also becomes less negative, following the same trend as potential energy.
1. Kinetic Energy (E_k):
- Starts positive and decreases as r increases.
- The graph will be a decreasing curve starting from a positive value.
- Starts from a very negative value and approaches zero as r increases.
- The graph will be a decreasing curve starting from a negative value and approaching zero.
- Starts from a value slightly less than the potential energy and remains negative, decreasing as r increases.
- The graph will be a decreasing curve below the potential energy graph.
- Plot all three graphs on the same axes with energy on the y-axis and distance from the center of the Earth on the x-axis.
- The graph of kinetic energy will be above the potential energy graph, and the total energy graph will be below both.
Based on the analysis, the correct graph representing the variation of total energy, kinetic energy, and potential energy of a satellite with its distance from the center of the Earth corresponds to option C.
Topper's Solved these Questions
- BOOK - A2ZCHAPTER - GRAVITATIONEXERCISE - Problems Based On Mixed Concepts29videos
GRAVITATION
- BOOK - A2ZCHAPTER - GRAVITATIONEXERCISE - Assertion Reasoning16videos
GRAVITATION
- BOOK - A2ZCHAPTER - GRAVITATIONEXERCISE - Gravitational Potential, Energyand Escape Velocity32videos
GRAVITATION
- BOOK - A2ZCHAPTER - GENERAL KINEMATICS AND MOTION IN ONE DIMENSIONEXERCISE - Chapter Test30videos
GENERAL KINEMATICS AND MOTION IN ONE DIMENSION
- BOOK - A2ZCHAPTER - KINETIC THEORY OF GASES AND THERMODYNAMICSEXERCISE - Chapter Test29videos
KINETIC THEORY OF GASES AND THERMODYNAMICS
Similar Questions
Knowledge Check
- Question 1 - Select One
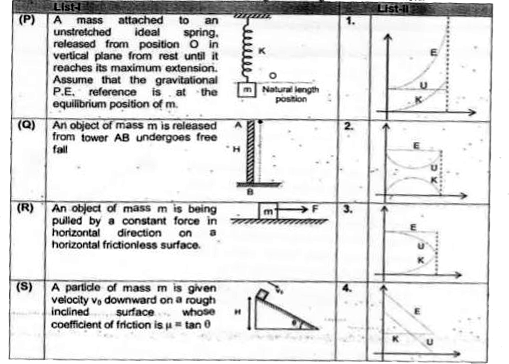
The physical situation in List-I with graphs of the variation of total energy (E), potential energy (U) and kinetic energy ( K) with time in List-II are given. Match the statements from List I with those in List II and select the correct answer using the code given below the lists.
 APQRS1423BPQRS2314CPQRS4123DPQRS4132
 - Question 2 - Select One
The kinetic energy of a satellite is 2 MJ. What is the total energy of the satellite?
A−2MJB−1MJC−12MJD−4MJ - Question 3 - Select One
The gravitational potential energy of a body at a distance r from the centre of earth is U. Its weight at a distance 2r from the centre of earth is
AUrBU2rCU4rDU√2r
If total energy of the same electron is E, then what would be its kinetic energy and potential energy .
View SolutionIf the kinetic energy of a satellite orbiting around the earth is doubled then
View SolutionWhich of the following graph is correct between kinetic energy E, potential energy (U) and height (h) from the ground of the partical
View SolutionFor a satellite moving in an orbit around the earth, ratio of kinetic energy to potential energy is
View SolutionThe magnitude of gravitational potential energy of a body at a distance r from the centre of earth is u. Its weight at a distance 2r from the centre of earth is
View Solution

