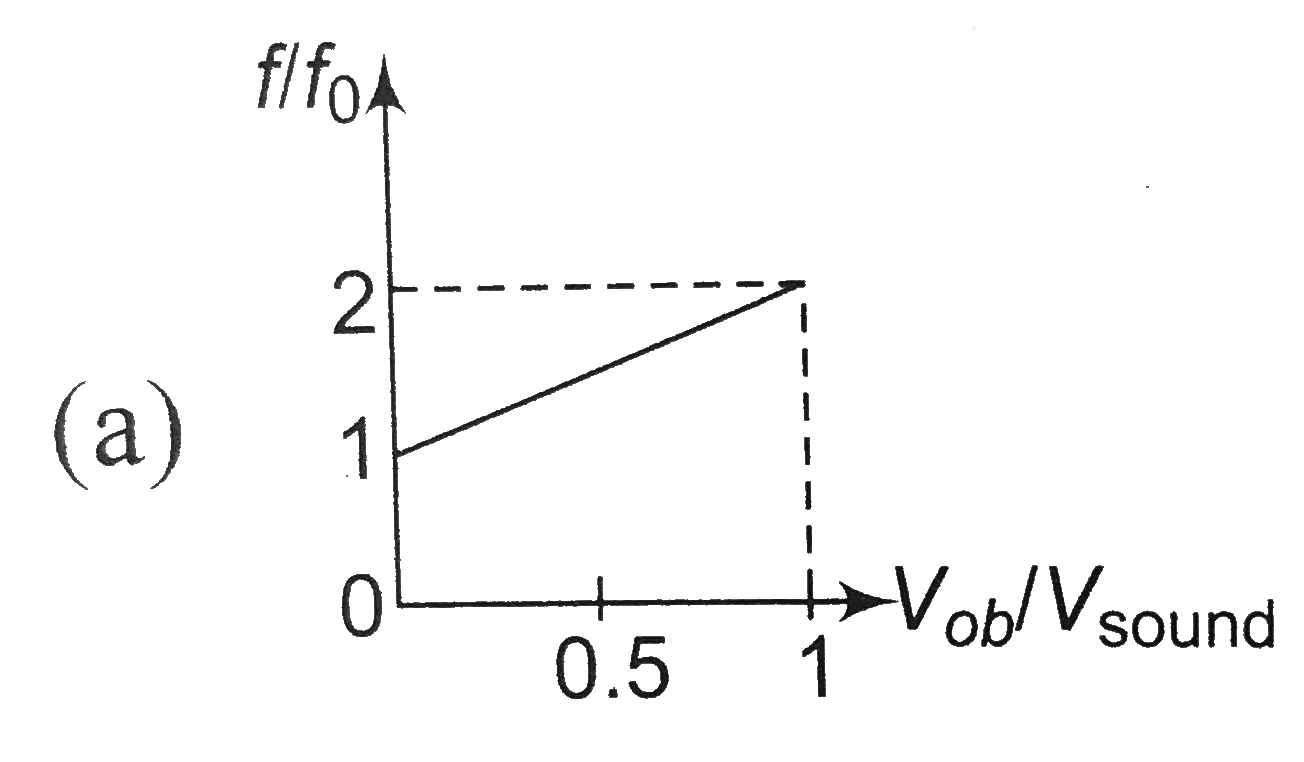
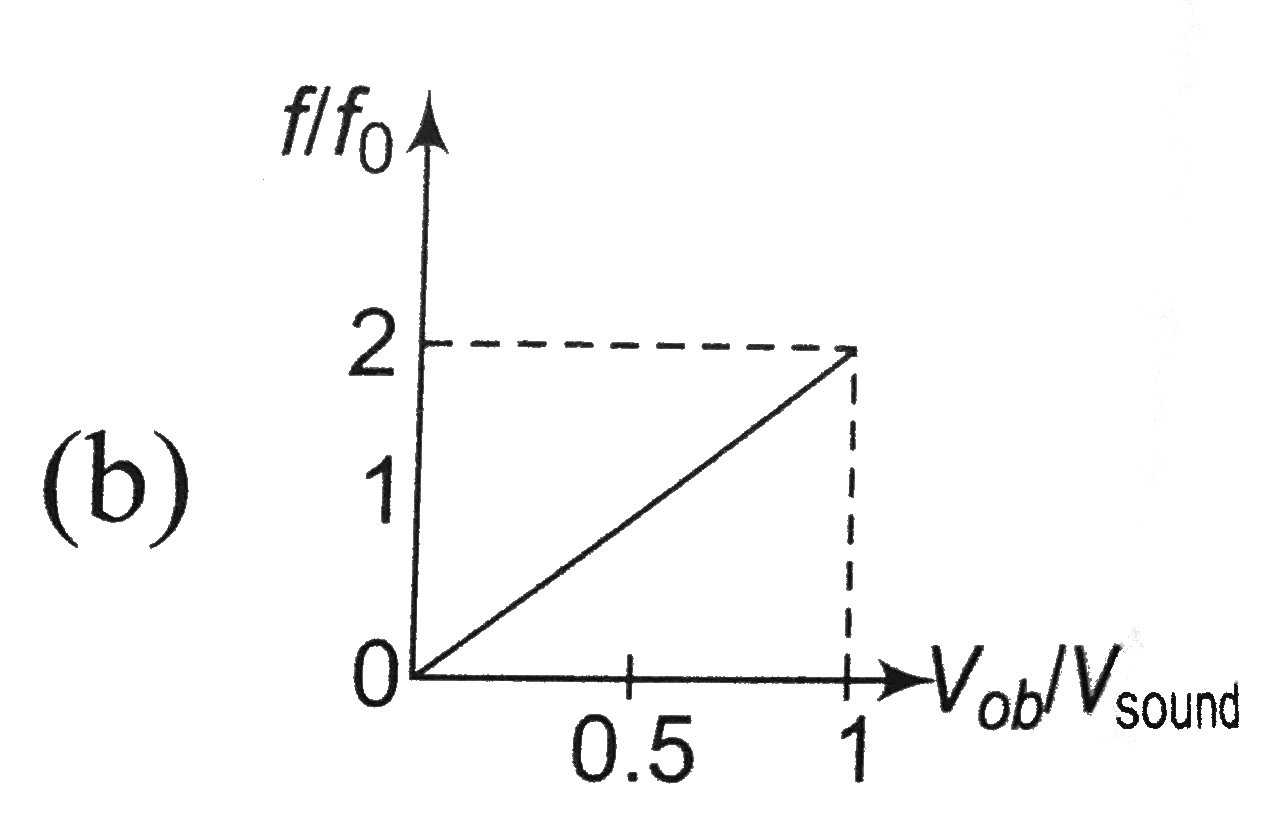
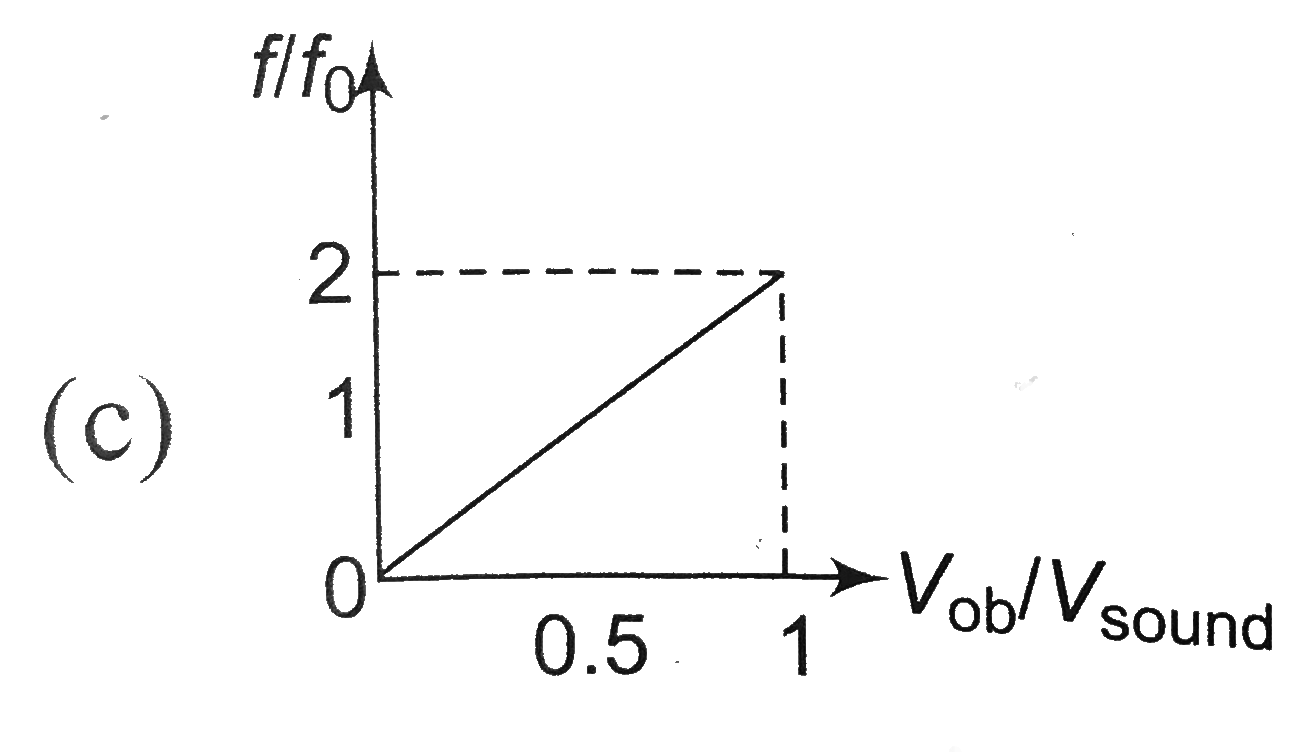
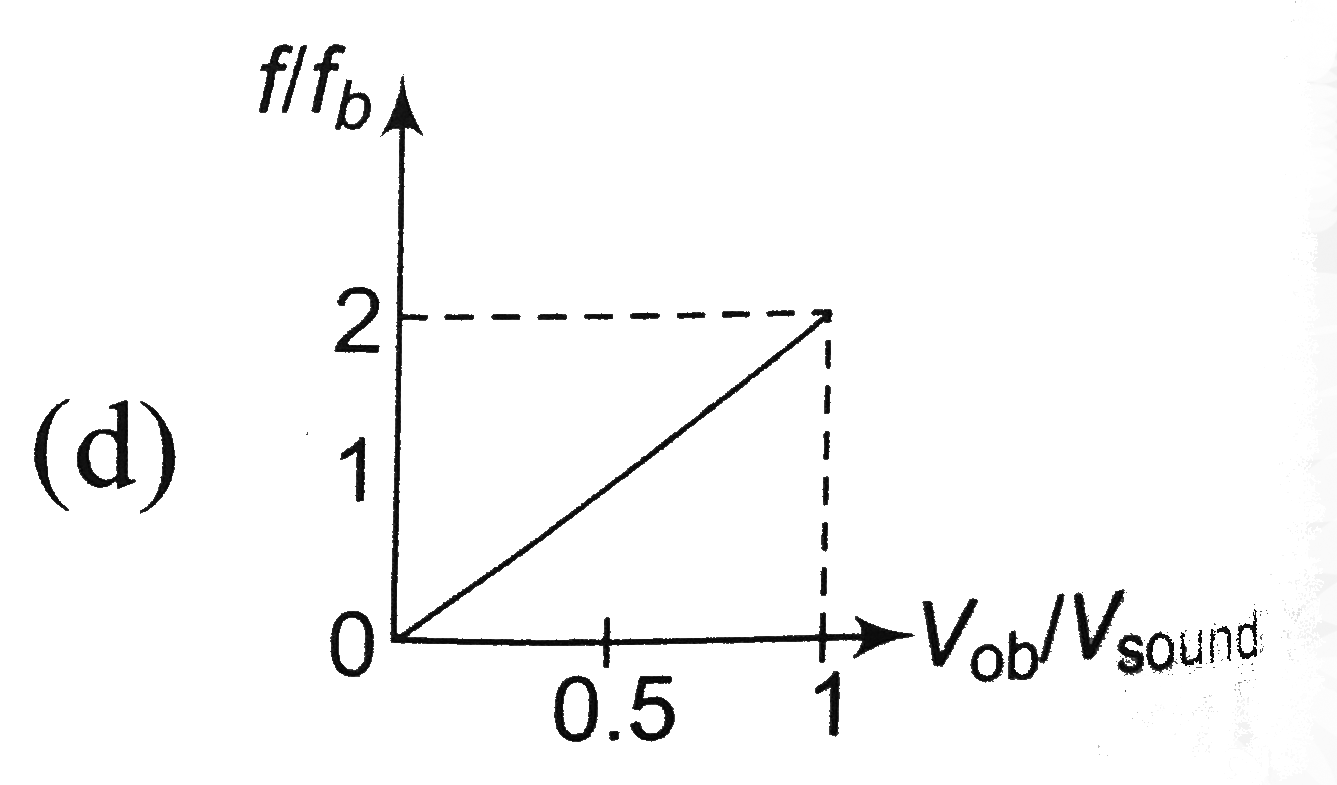
A curve is plotted to represenet the dependence of the ratio of the received frequency f to the frequency f0 emitted by the source on the ratio of the speed of obsever Vob to the speed of sound Vsound in a situation in which an observer is moving towards a stationary sound source. The curve is best represnted by :


The correct Answer is:A
f=f0(1+VobVsound)⇒ff0=1+VobVsound (straight line),
when VobVsound=0,ff0=1
and as VobVsound→1⇒ff0→2
Topper's Solved these Questions
- BOOK - A2ZCHAPTER - WAVES AND ACOUSTICSEXERCISE - Problems Based On Mixed Concepts15videos
WAVES AND ACOUSTICS
- BOOK - A2ZCHAPTER - WAVES AND ACOUSTICSEXERCISE - AIIMS Questions55videos
WAVES AND ACOUSTICS
- BOOK - A2ZCHAPTER - WAVES AND ACOUSTICSEXERCISE - Sound Wave And Loudness27videos
WAVES AND ACOUSTICS
- BOOK - A2ZCHAPTER - VECTORSEXERCISE - Chapter Test29videos
VECTORS
- BOOK - A2ZCHAPTER - WORK, ENERGY, POWER AND COLLISIONEXERCISE - Chapter Test29videos
WORK, ENERGY, POWER AND COLLISION
Similar Questions
if the speed of a sound source is equal to the speed fo sound and the source is moving away from the observer, then the ratio of apparent frequency to the original frequency is
View SolutionAn aeroplane of frequency 2f is moving towards a stationary observer. Frequency heard by observer is 4f then find out ratio of speed of aeroplane and sound
View Solution
Knowledge Check
- Question 1 - Select One
An observer moves towards a stationary source of sound. The percentage change in the apparent frequency is
AzeroB0.05C0.1D0.2 - Question 2 - Select One
A sound spurce is moving towards a stationary observer with 1/10 of the speed of sound. The ratio of apparent to real frequency is
A10/9B11/10C(11/10)2D(9/10)2 - Question 3 - Select One
A sound source is moving towards a stationary observer with 1/10 of the speed of sound. The ratio of apparent to real frequency is
A109B1110C(1110)2D(910)2
A source and a listener are both moving towards each other with speed v/10, where v is the speed of sound. If the frequency of the note emitted by the source is f, the frequency heard by the listener would be nearly
View SolutionThe speed of sound in air is v. The velocity of a source of sound whose frequency appears to be doubled to a stationary observer is
View SolutionAn observer moving towards a stationary source observes that the apparent frequency is three times the actual frequency of the source. If the velocity of sound is V, the velocity of the observer would be-
View SolutionA listener and a source of sound are moving with the same speed in the same direction. The ratio of the frequency of the source and the frequency which is heard by the listerner is
View SolutionA source of sound is travelling towards a stationary observer. The frequency of sound heard by the observer is 25% more than the actual frequency. If the speed of sound is v, that of the source is
View Solution

