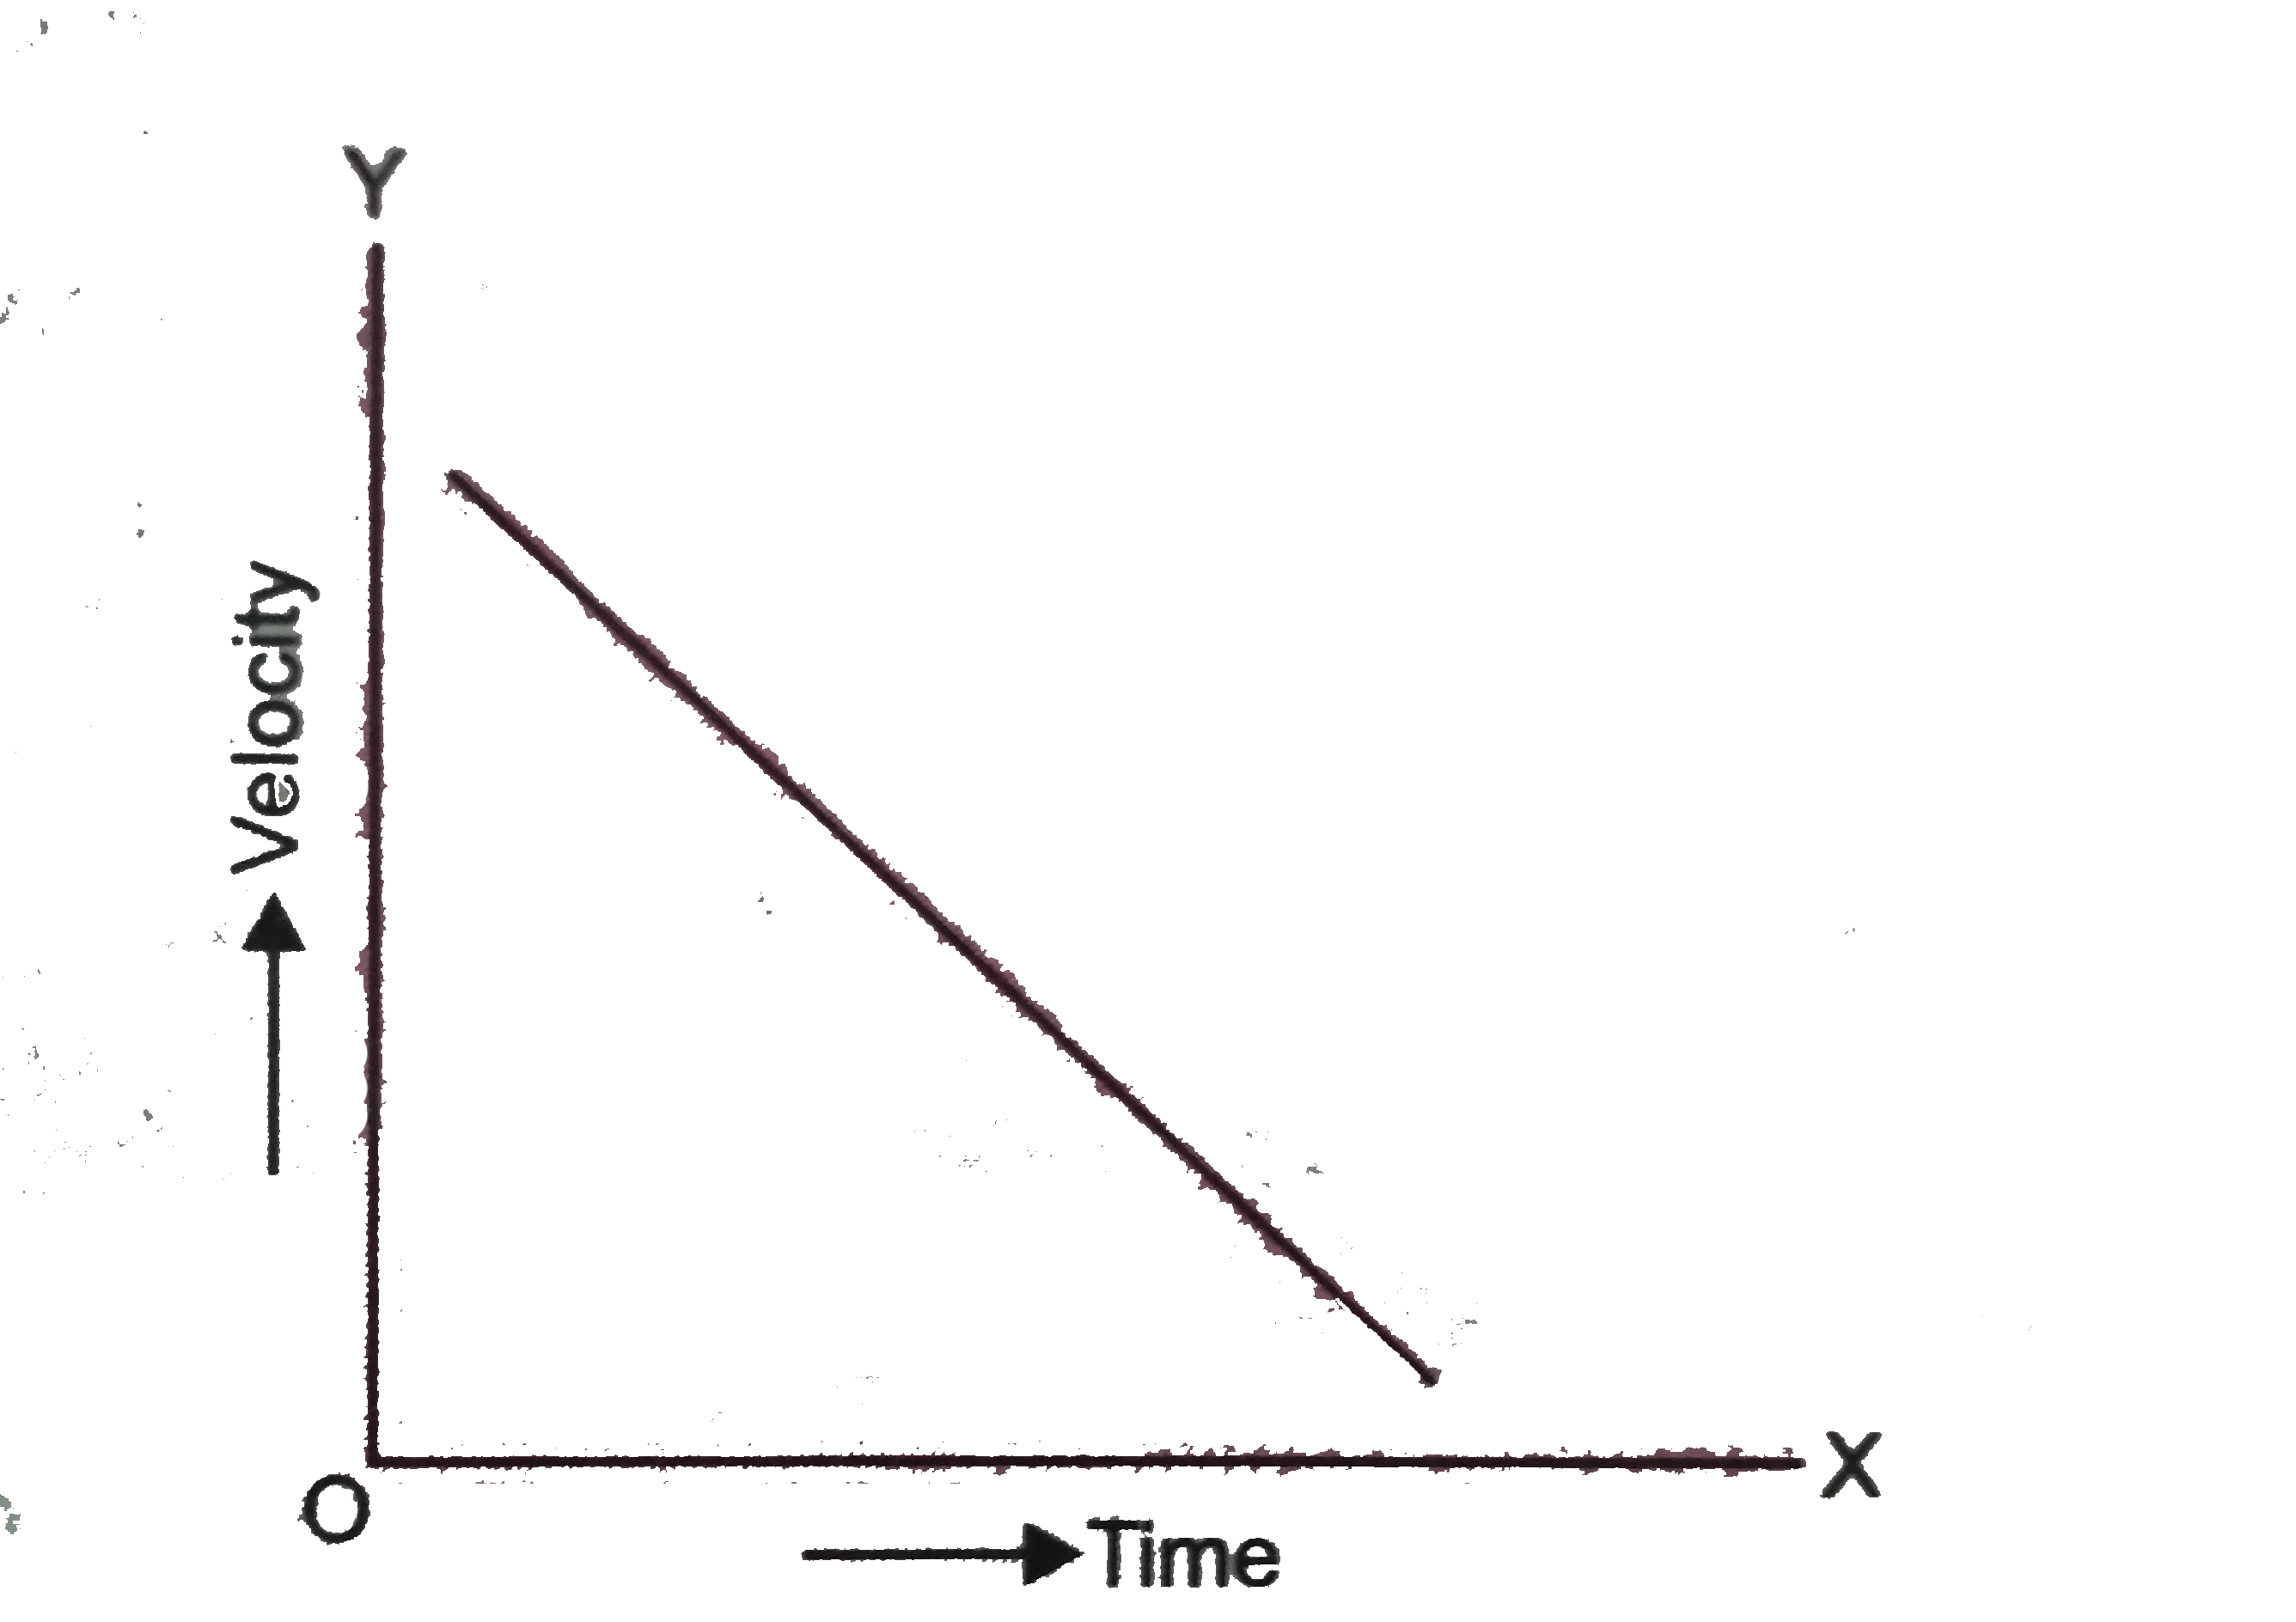
Draw velocity time graph of a body moving with constant retardation.
Video Solution
Text Solution
When retardation is constant, velocity time graph is a straight line with negative slope as shown in Fig.
|
Updated on:21/07/2023
Topper's Solved these Questions
- BOOK - PRADEEPCHAPTER - MOTIONEXERCISE - formative Assesment paper pen test15videos
MOTION
- BOOK - PRADEEPCHAPTER - MOTIONEXERCISE - Formative Assessment 1(b) - Oral testing (Exercise)1videos
MOTION
- BOOK - PRADEEPCHAPTER - MOTIONEXERCISE - Worksheet testing(fill in the blanks)5videos
MOTION
- BOOK - PRADEEPCHAPTER - GRAVITATIONEXERCISE - Model Test paper (1)36videos
GRAVITATION
- BOOK - PRADEEPCHAPTER - SOUNDEXERCISE - Model Test (sec - B)12videos
SOUND
Similar Questions
Knowledge Check
- Question 1 - Select One or More
The velocity-time graph of a body moving in a straight line is shown in the figure.
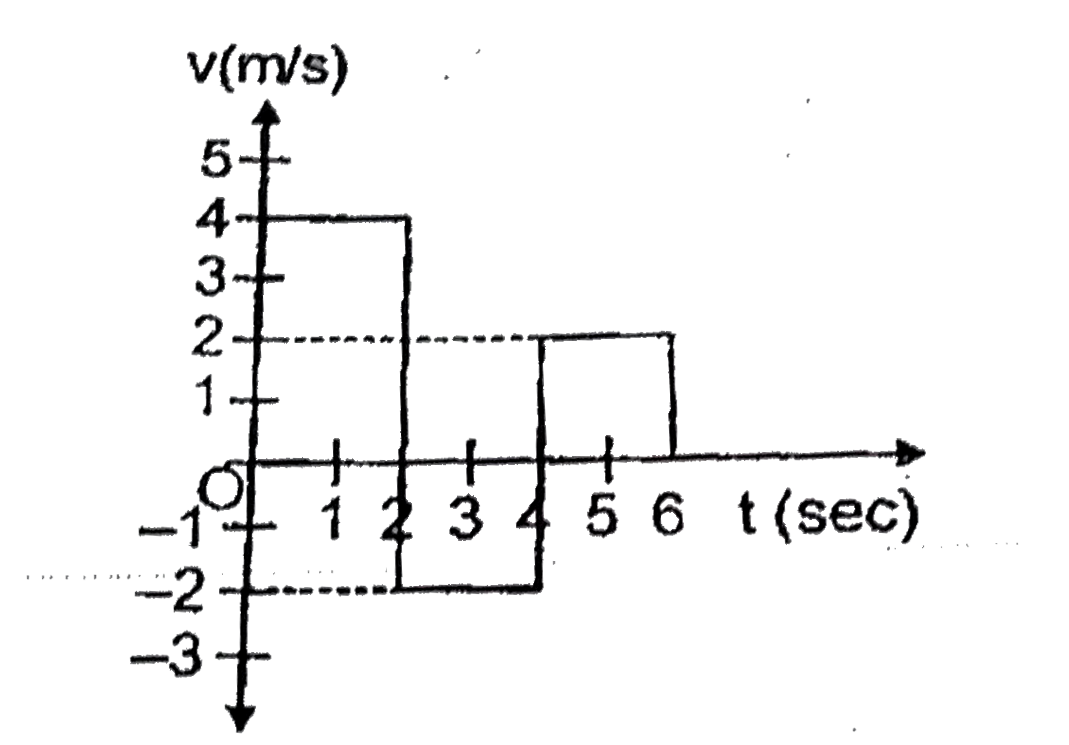 AThe magnitude of displacement of the body in 1st 2 sec is 8 mBThe magnitude of displacement of the body in 1st 4 sec is 4 mCThe distance travelled in 1st 2 sec is 8 mDThe distance travelled in 1st 4 sec is 12 m
 - Question 2 - Select One
The velocity versus time graph of a body moving in a straight line is as follows. The distance travelled by the body is 5 sec is
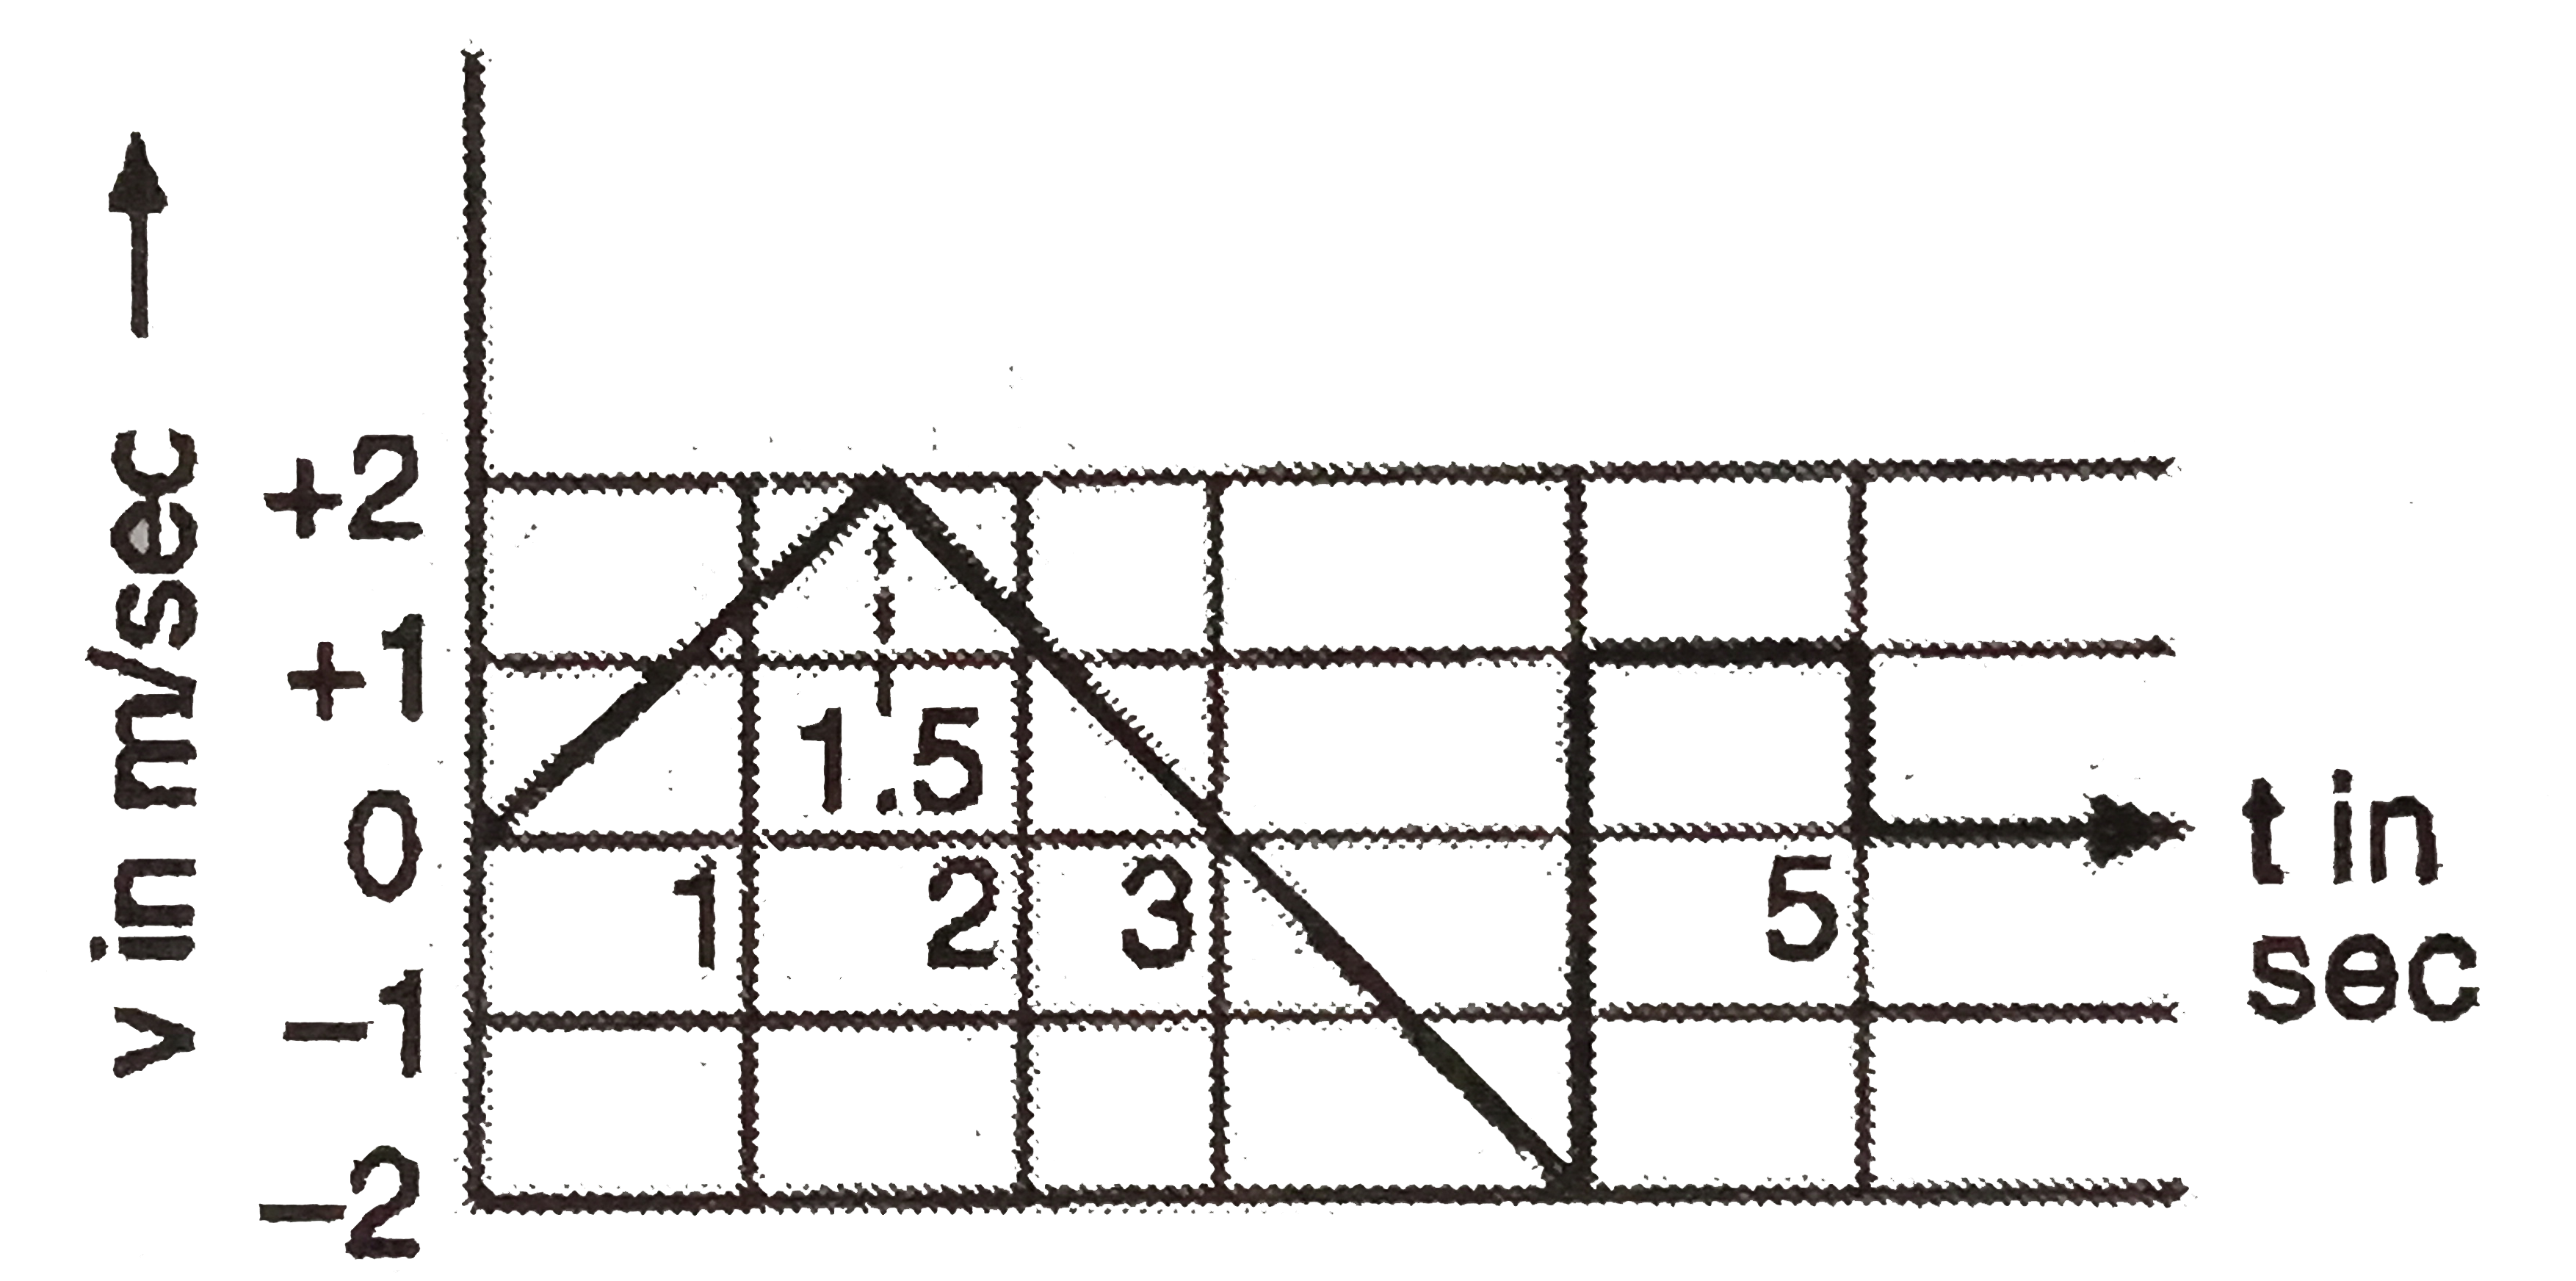 A2 mB3 mC4 mD5 m
 - Question 3 - Select One
The velocity-time graph of a body moving in a straight line is shown below:

Which one of the following represents its acceleration time graph?A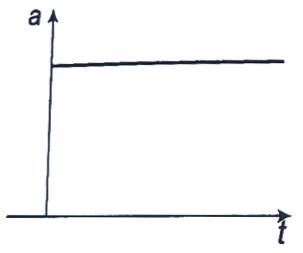 B
B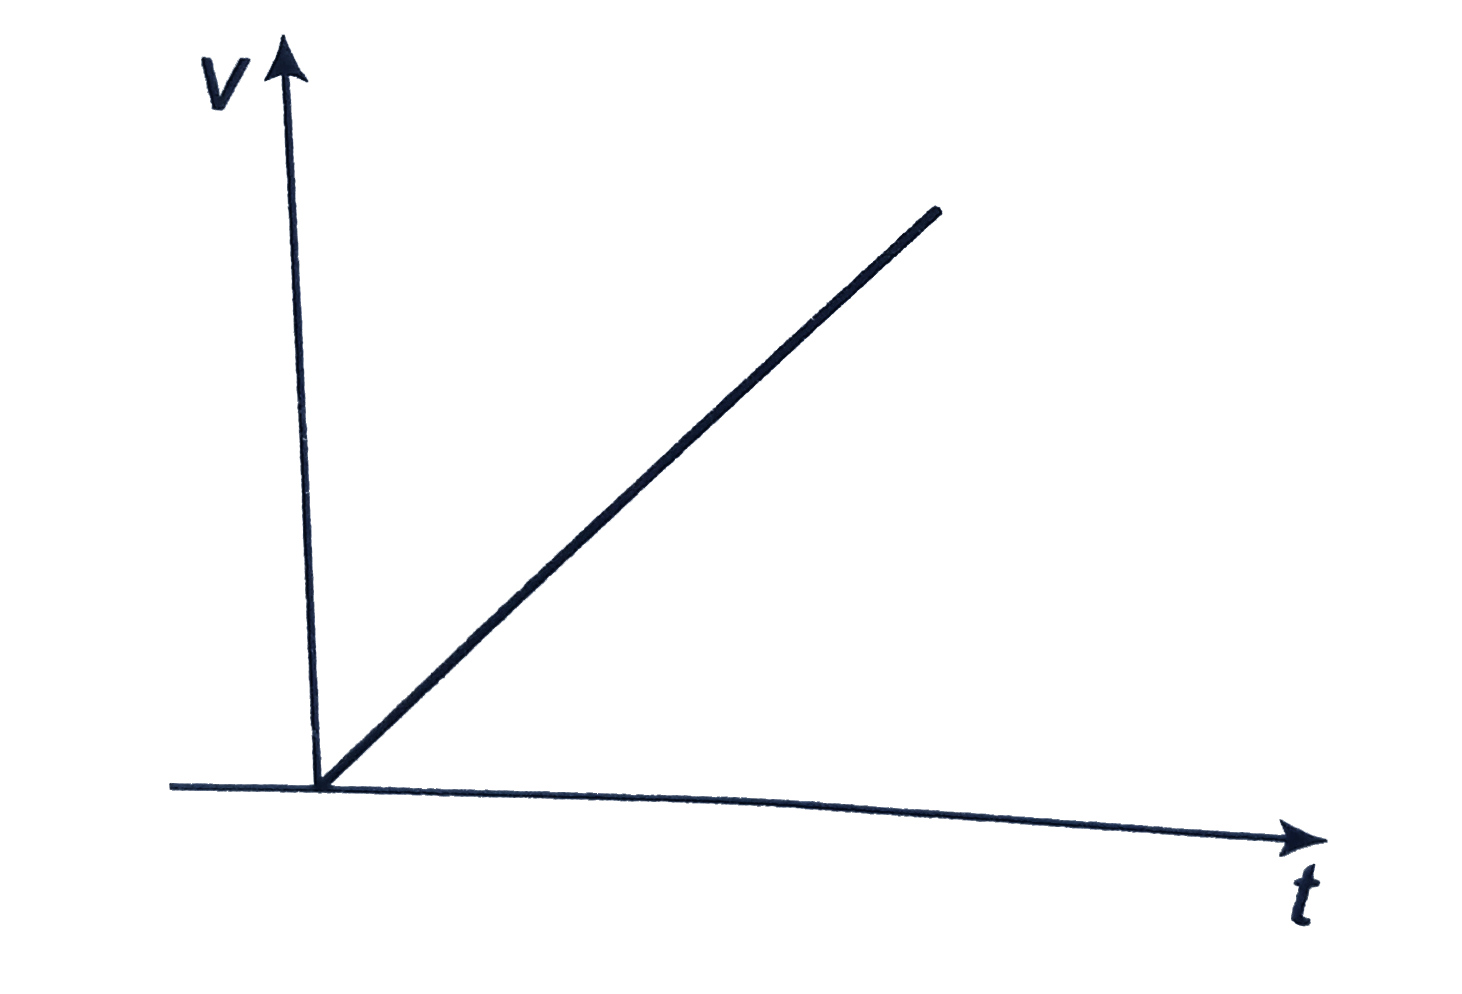 C
C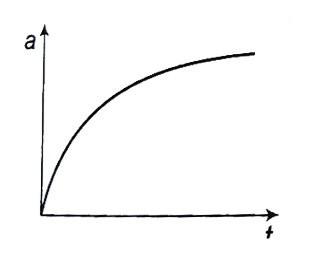 D
D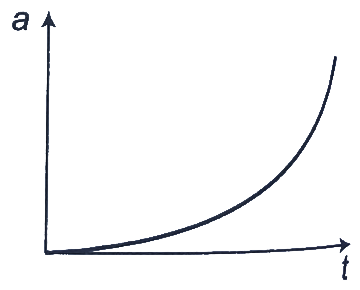
Draw velocity time graph of a body which is moving with some initial velocity and a constant acceleration.
View SolutionDraw the following graphs (expected nature only) between distance and time of an object in case of:For a body moving with constant acceleration.
View SolutionDraw the velocity-time graph of an object moving with uniform negative acceleration.
View SolutionThe velocity time graph of a body moving in a straight line is as follows. Find the magnitude of displacement of body and distance travelled by body during first 6 seconds.
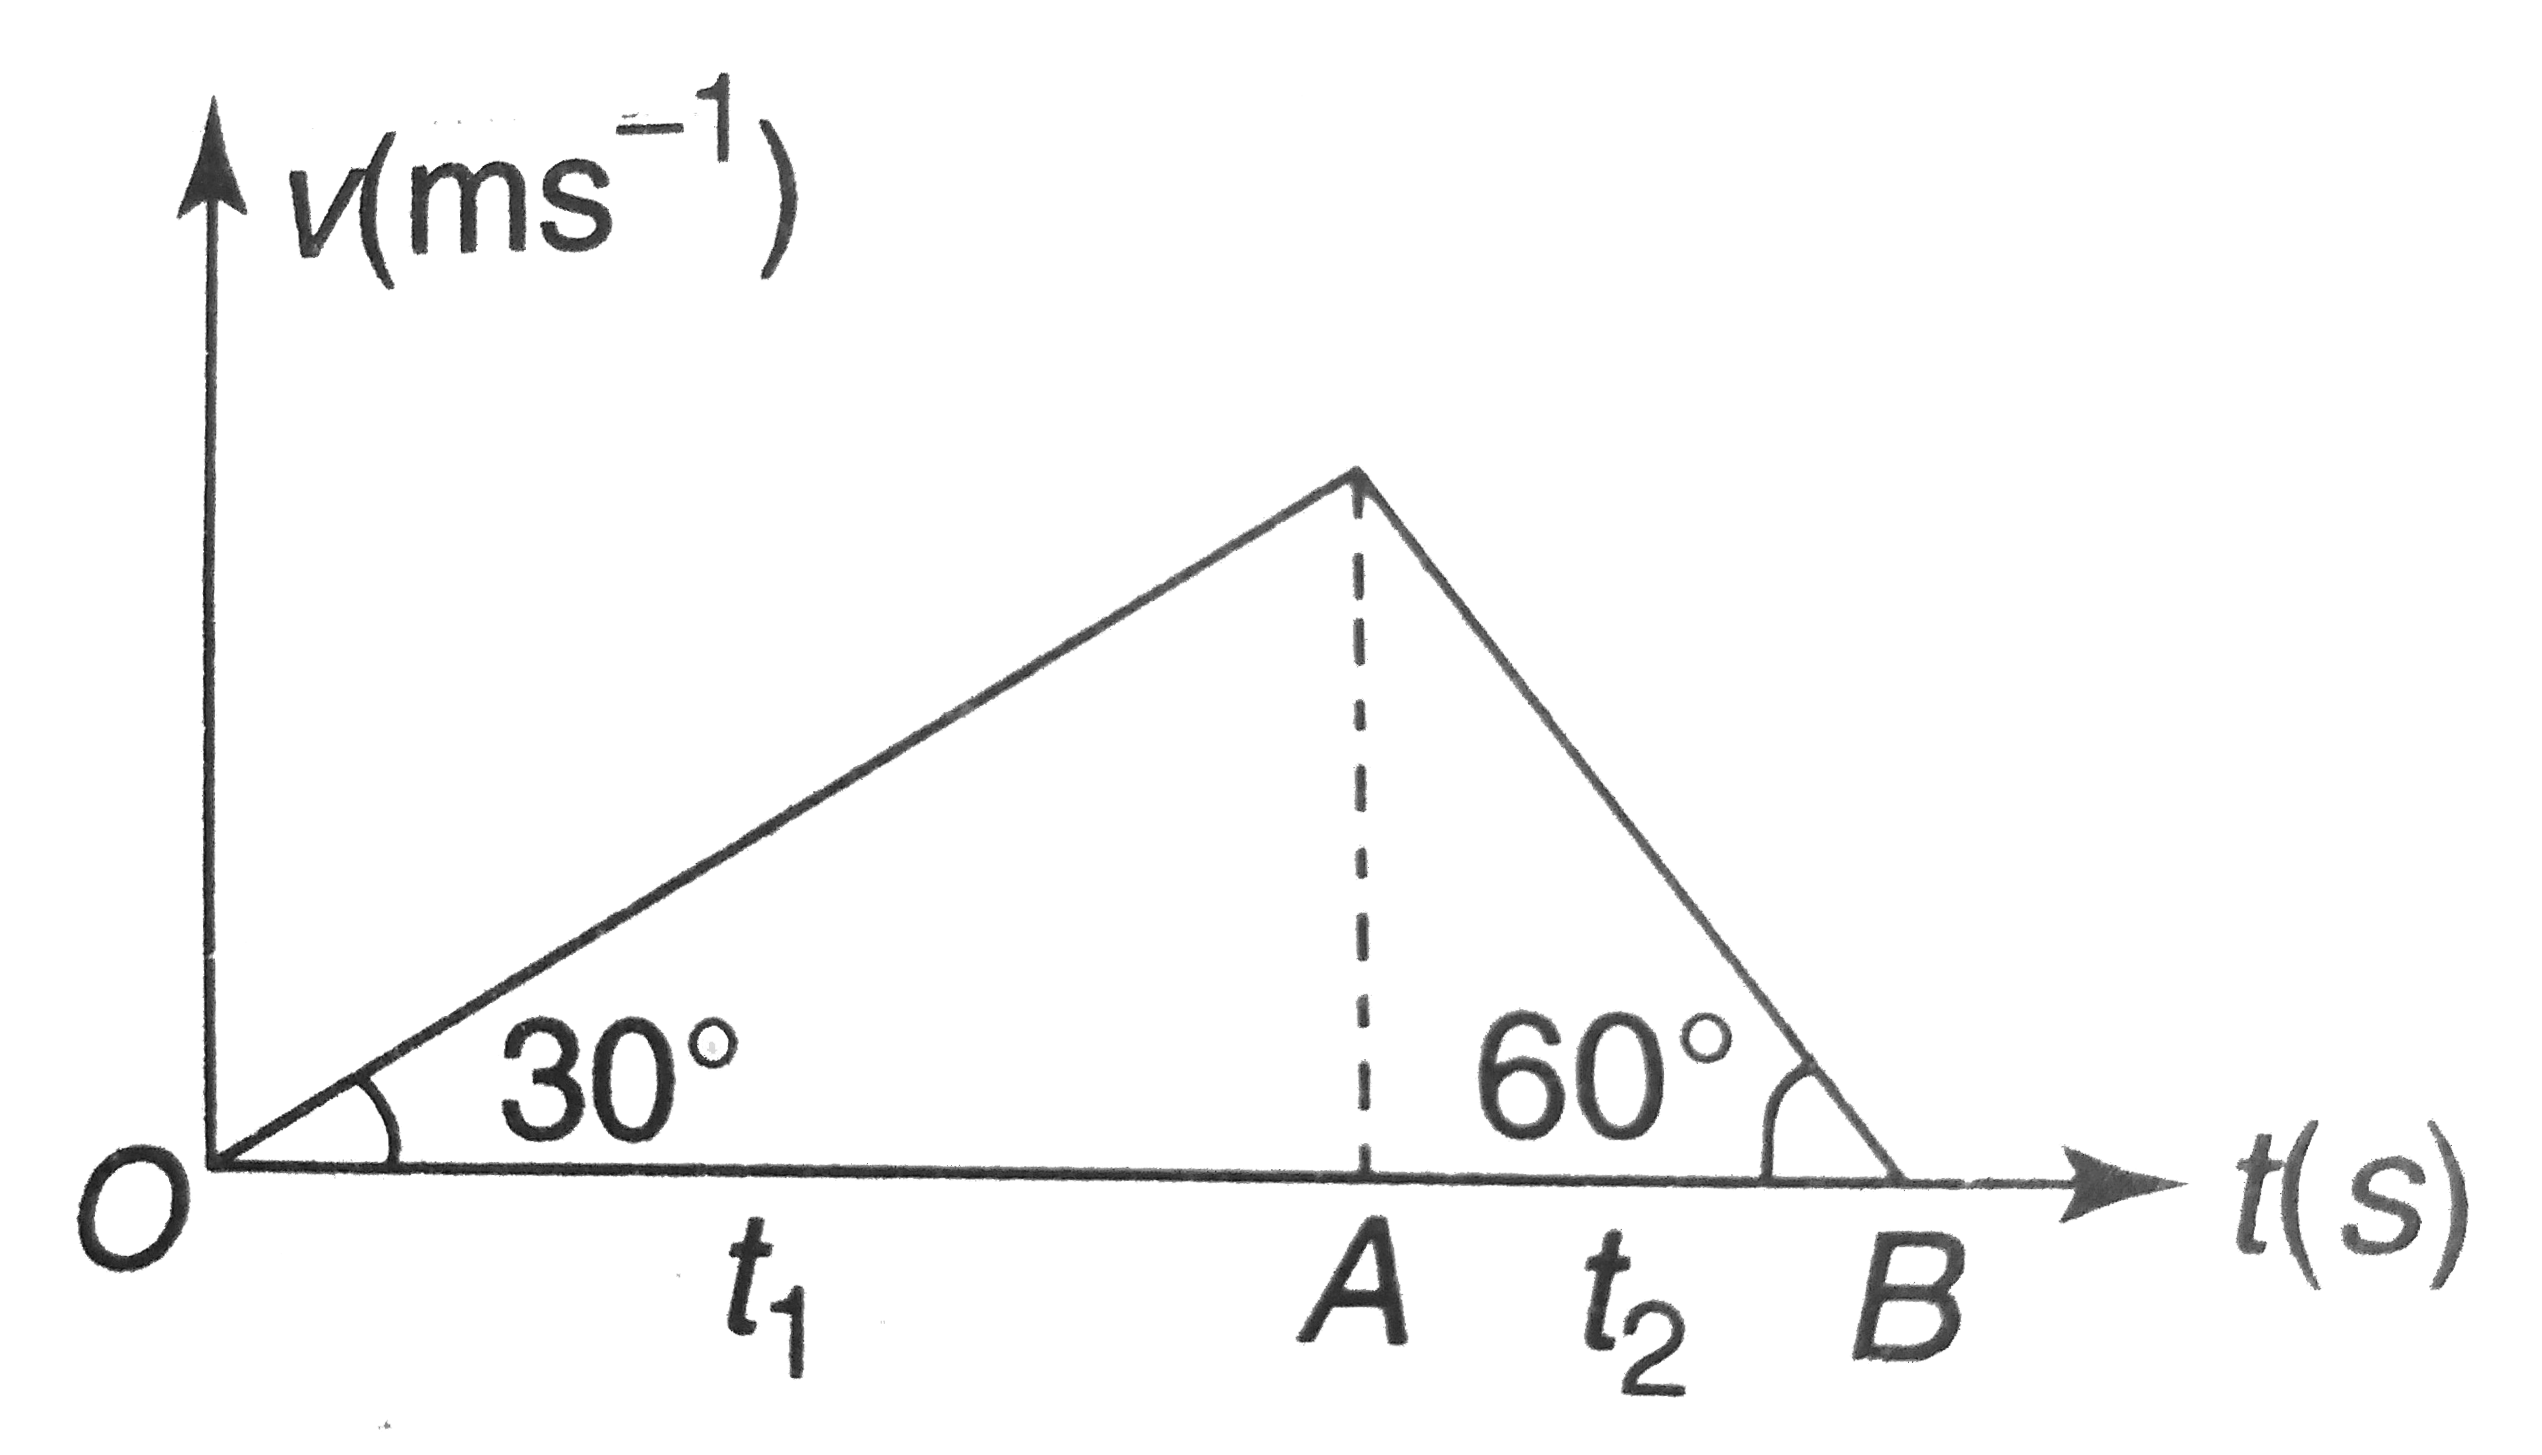
View SolutionThe velocity time graph of a body moving along a straight line is shown in figure. The ratio of the average velocities during the time t1 and t2 is.
 View Solution

