The speed time graph of a body is shown in Figure. Observer the graph carefully and answer the following :
(i) What kinds of motion are represented by OP,PQ and QR ?
(ii) Calculate acceleration of the body for the first 2sec.
(iii) Calculate retardation of body from 8s to 14s.
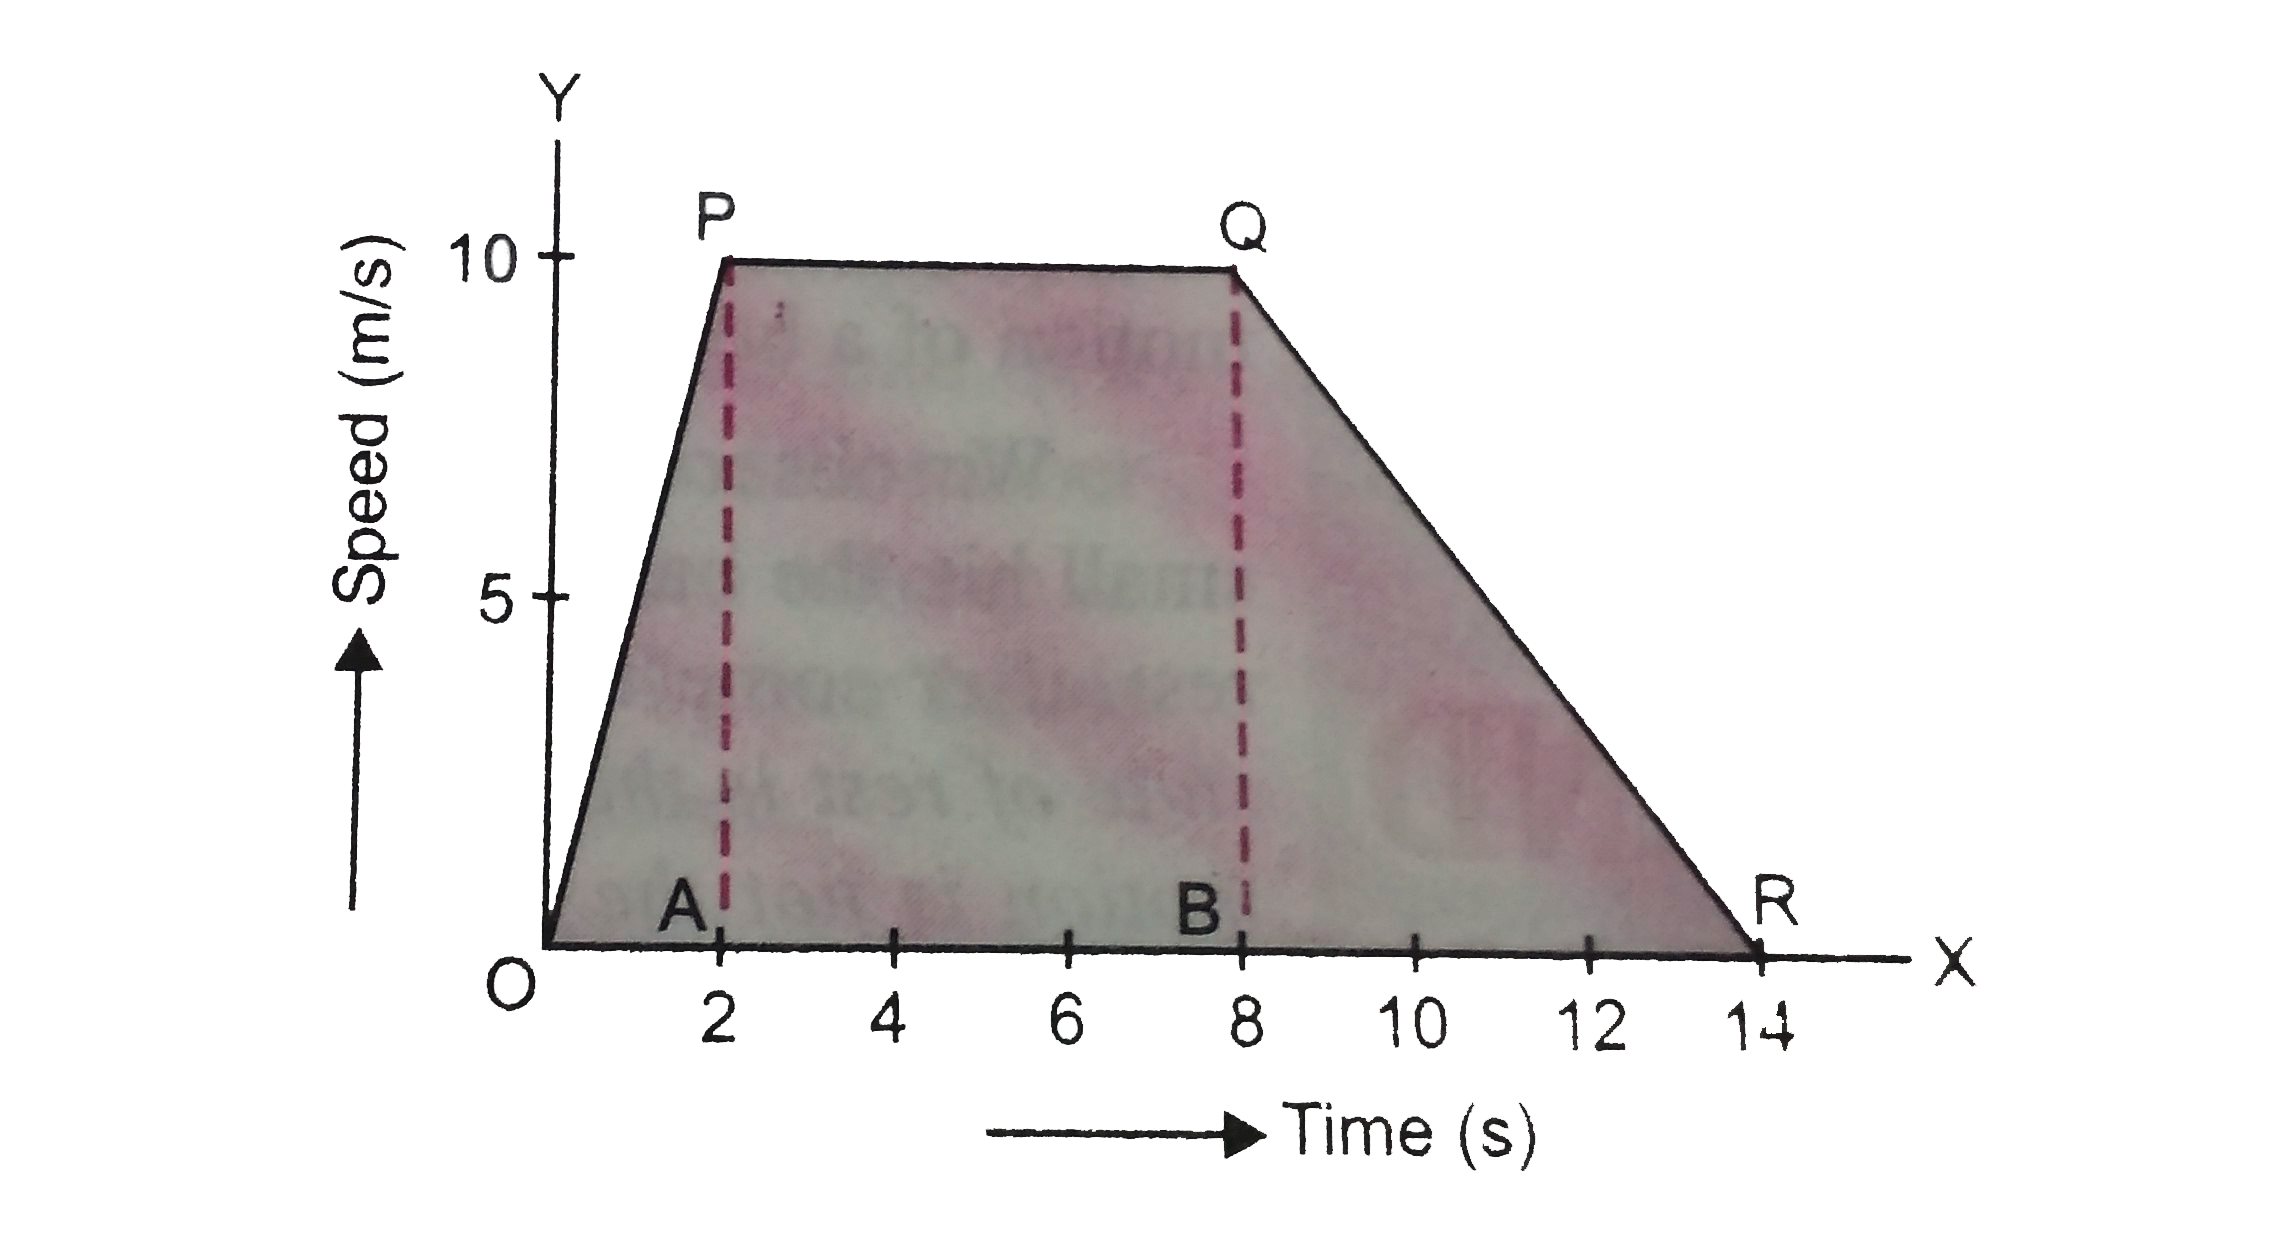
Step by step video, text & image solution for The speed time graph of a body is shown in Figure. Observer the graph carefully and answer the following : (i) What kinds of motion are represented by OP, PQ and QR ? (ii) Calculate acceleration of the body for the first 2 sec. (iii) Calculate retardation of body from 8 s to 14 s. by Physics experts to help you in doubts & scoring excellent marks in Class 9 exams.
Updated on:21/07/2023Topper's Solved these Questions
Similar Questions
Knowledge Check
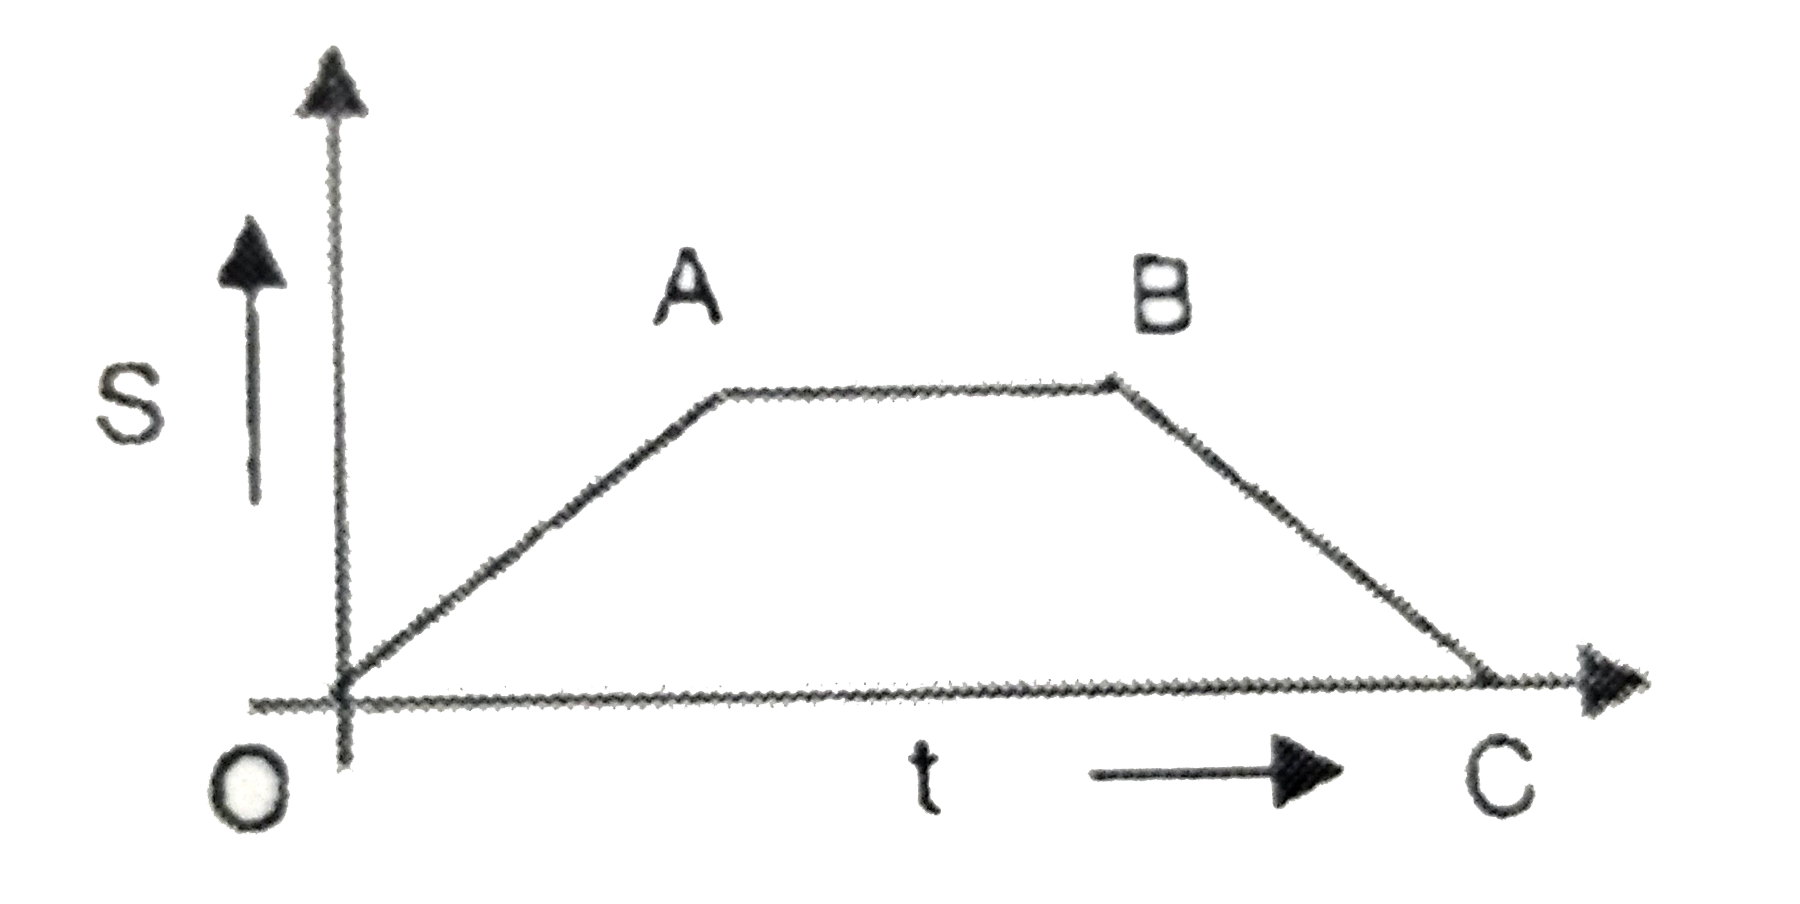
The distance- time graph of a body is as shown in the figure. The part of the graph that represent the unifrom speed of the body is
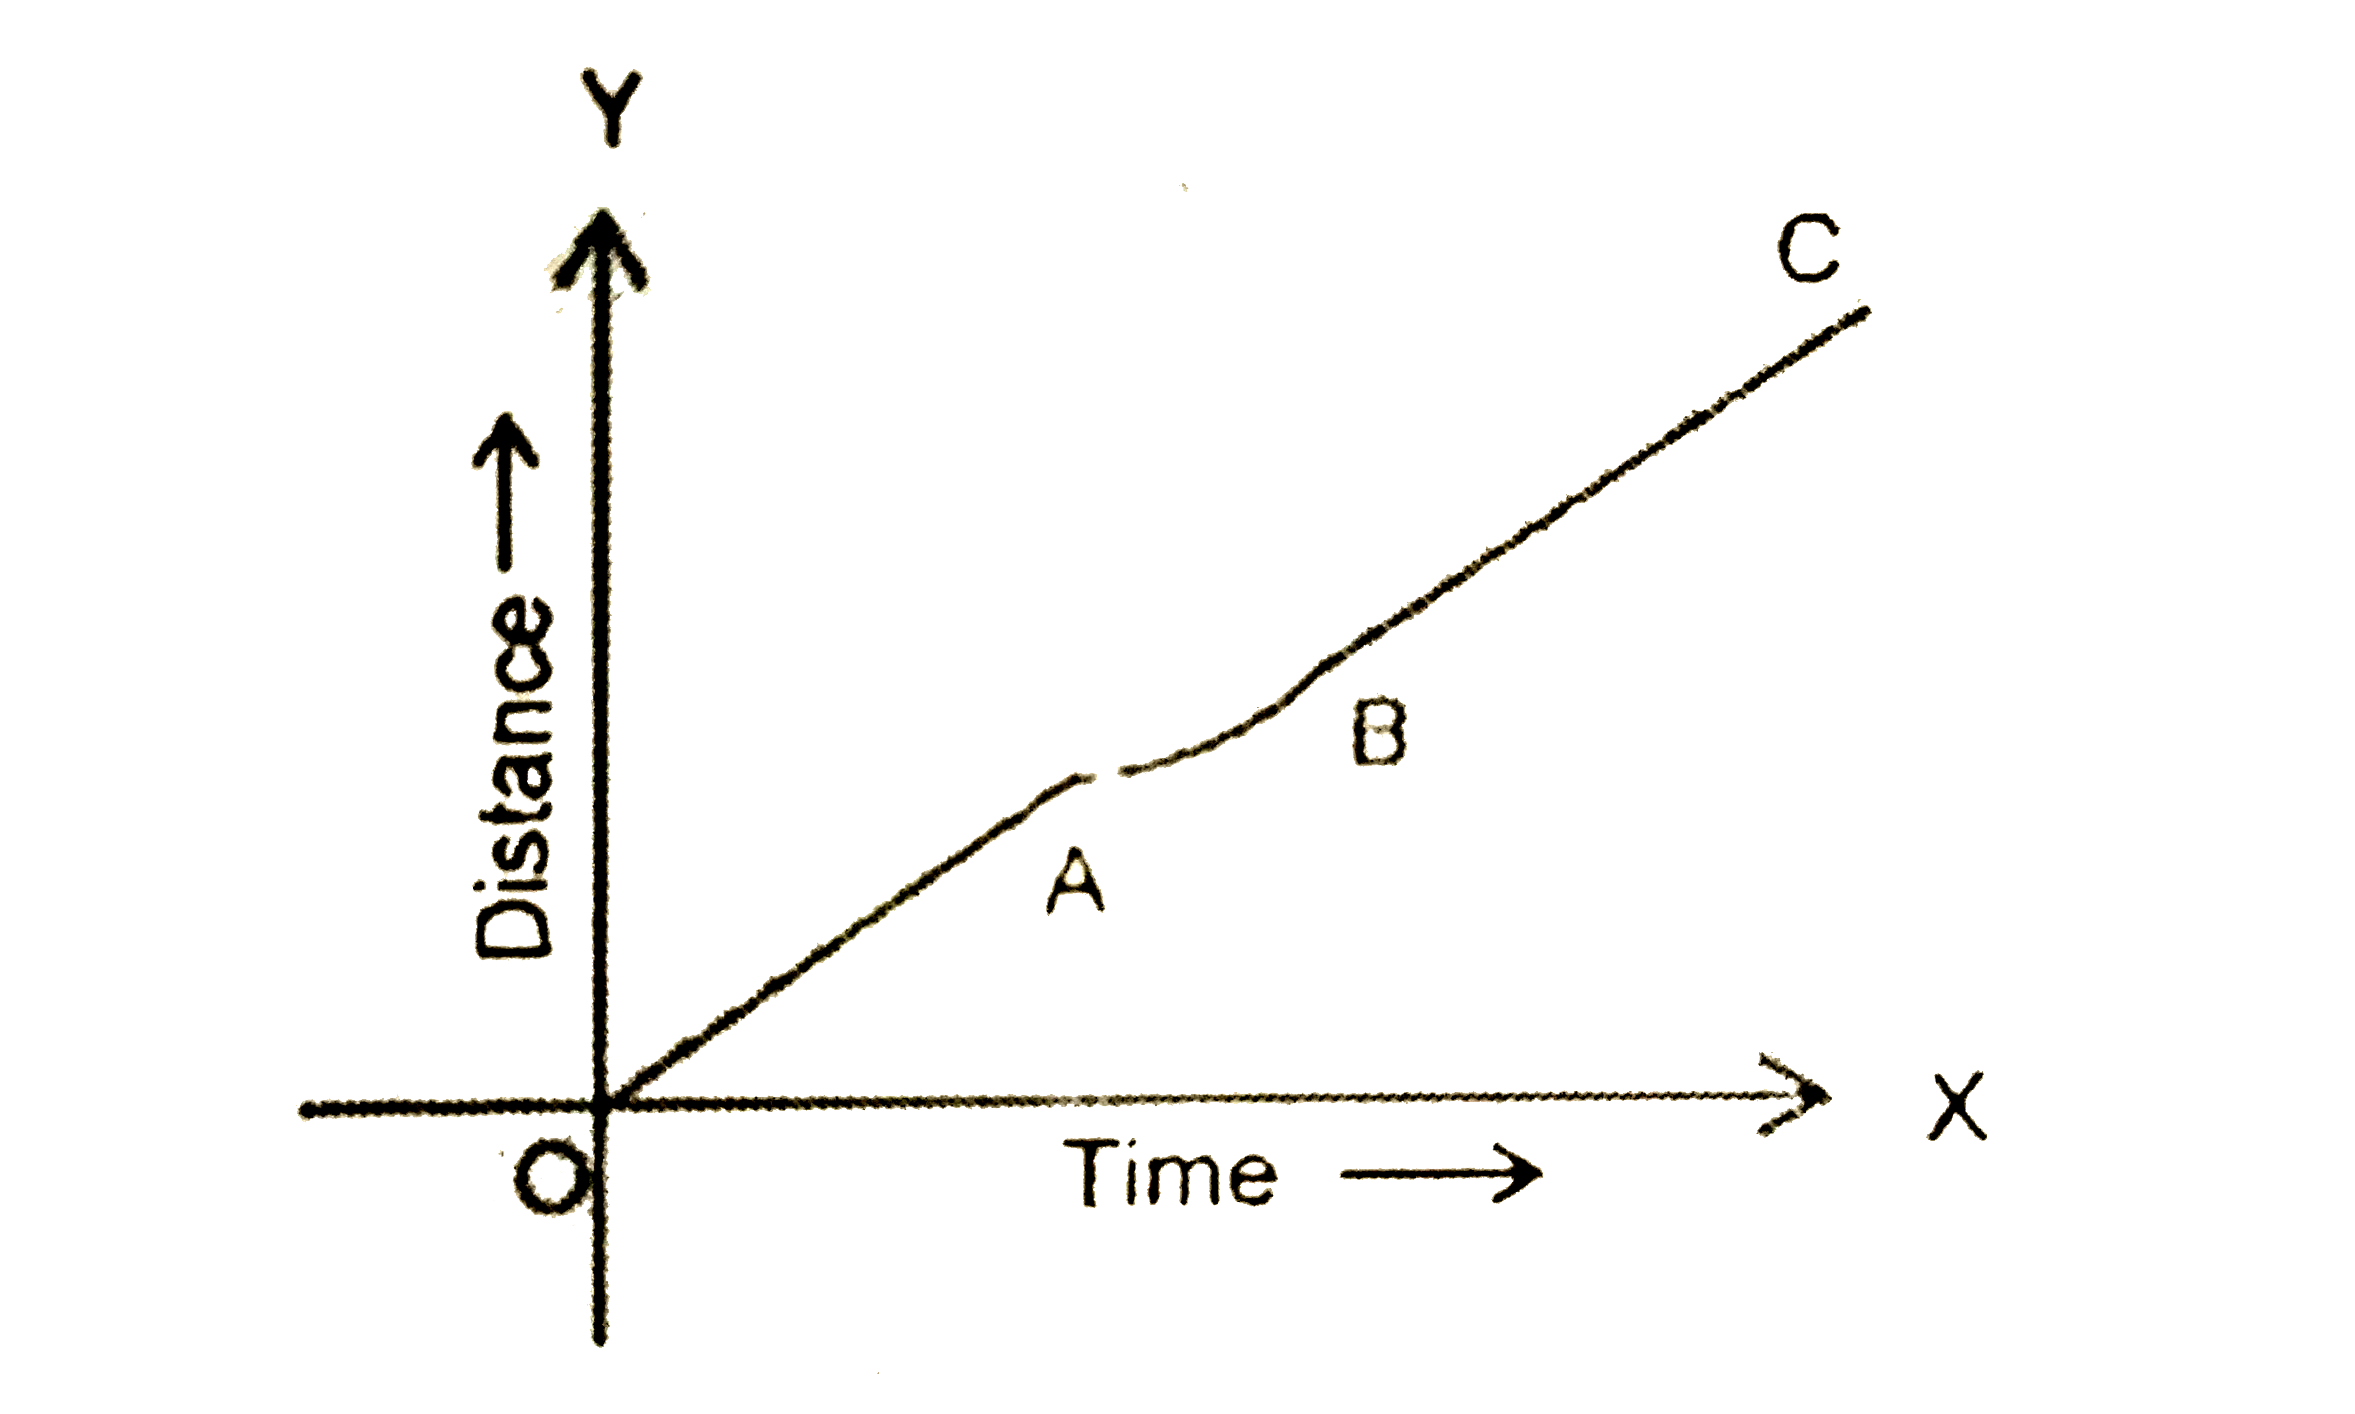 AOABABCBCDBoth OA and BC
The distance- time graph of a body is as shown in the figure. The part of the graph that represent the unifrom speed of the body is
 AOABABCBCDBoth OA and BC
The velocity-time graph of a body is shown in .
The displacement of the body in 8s is.
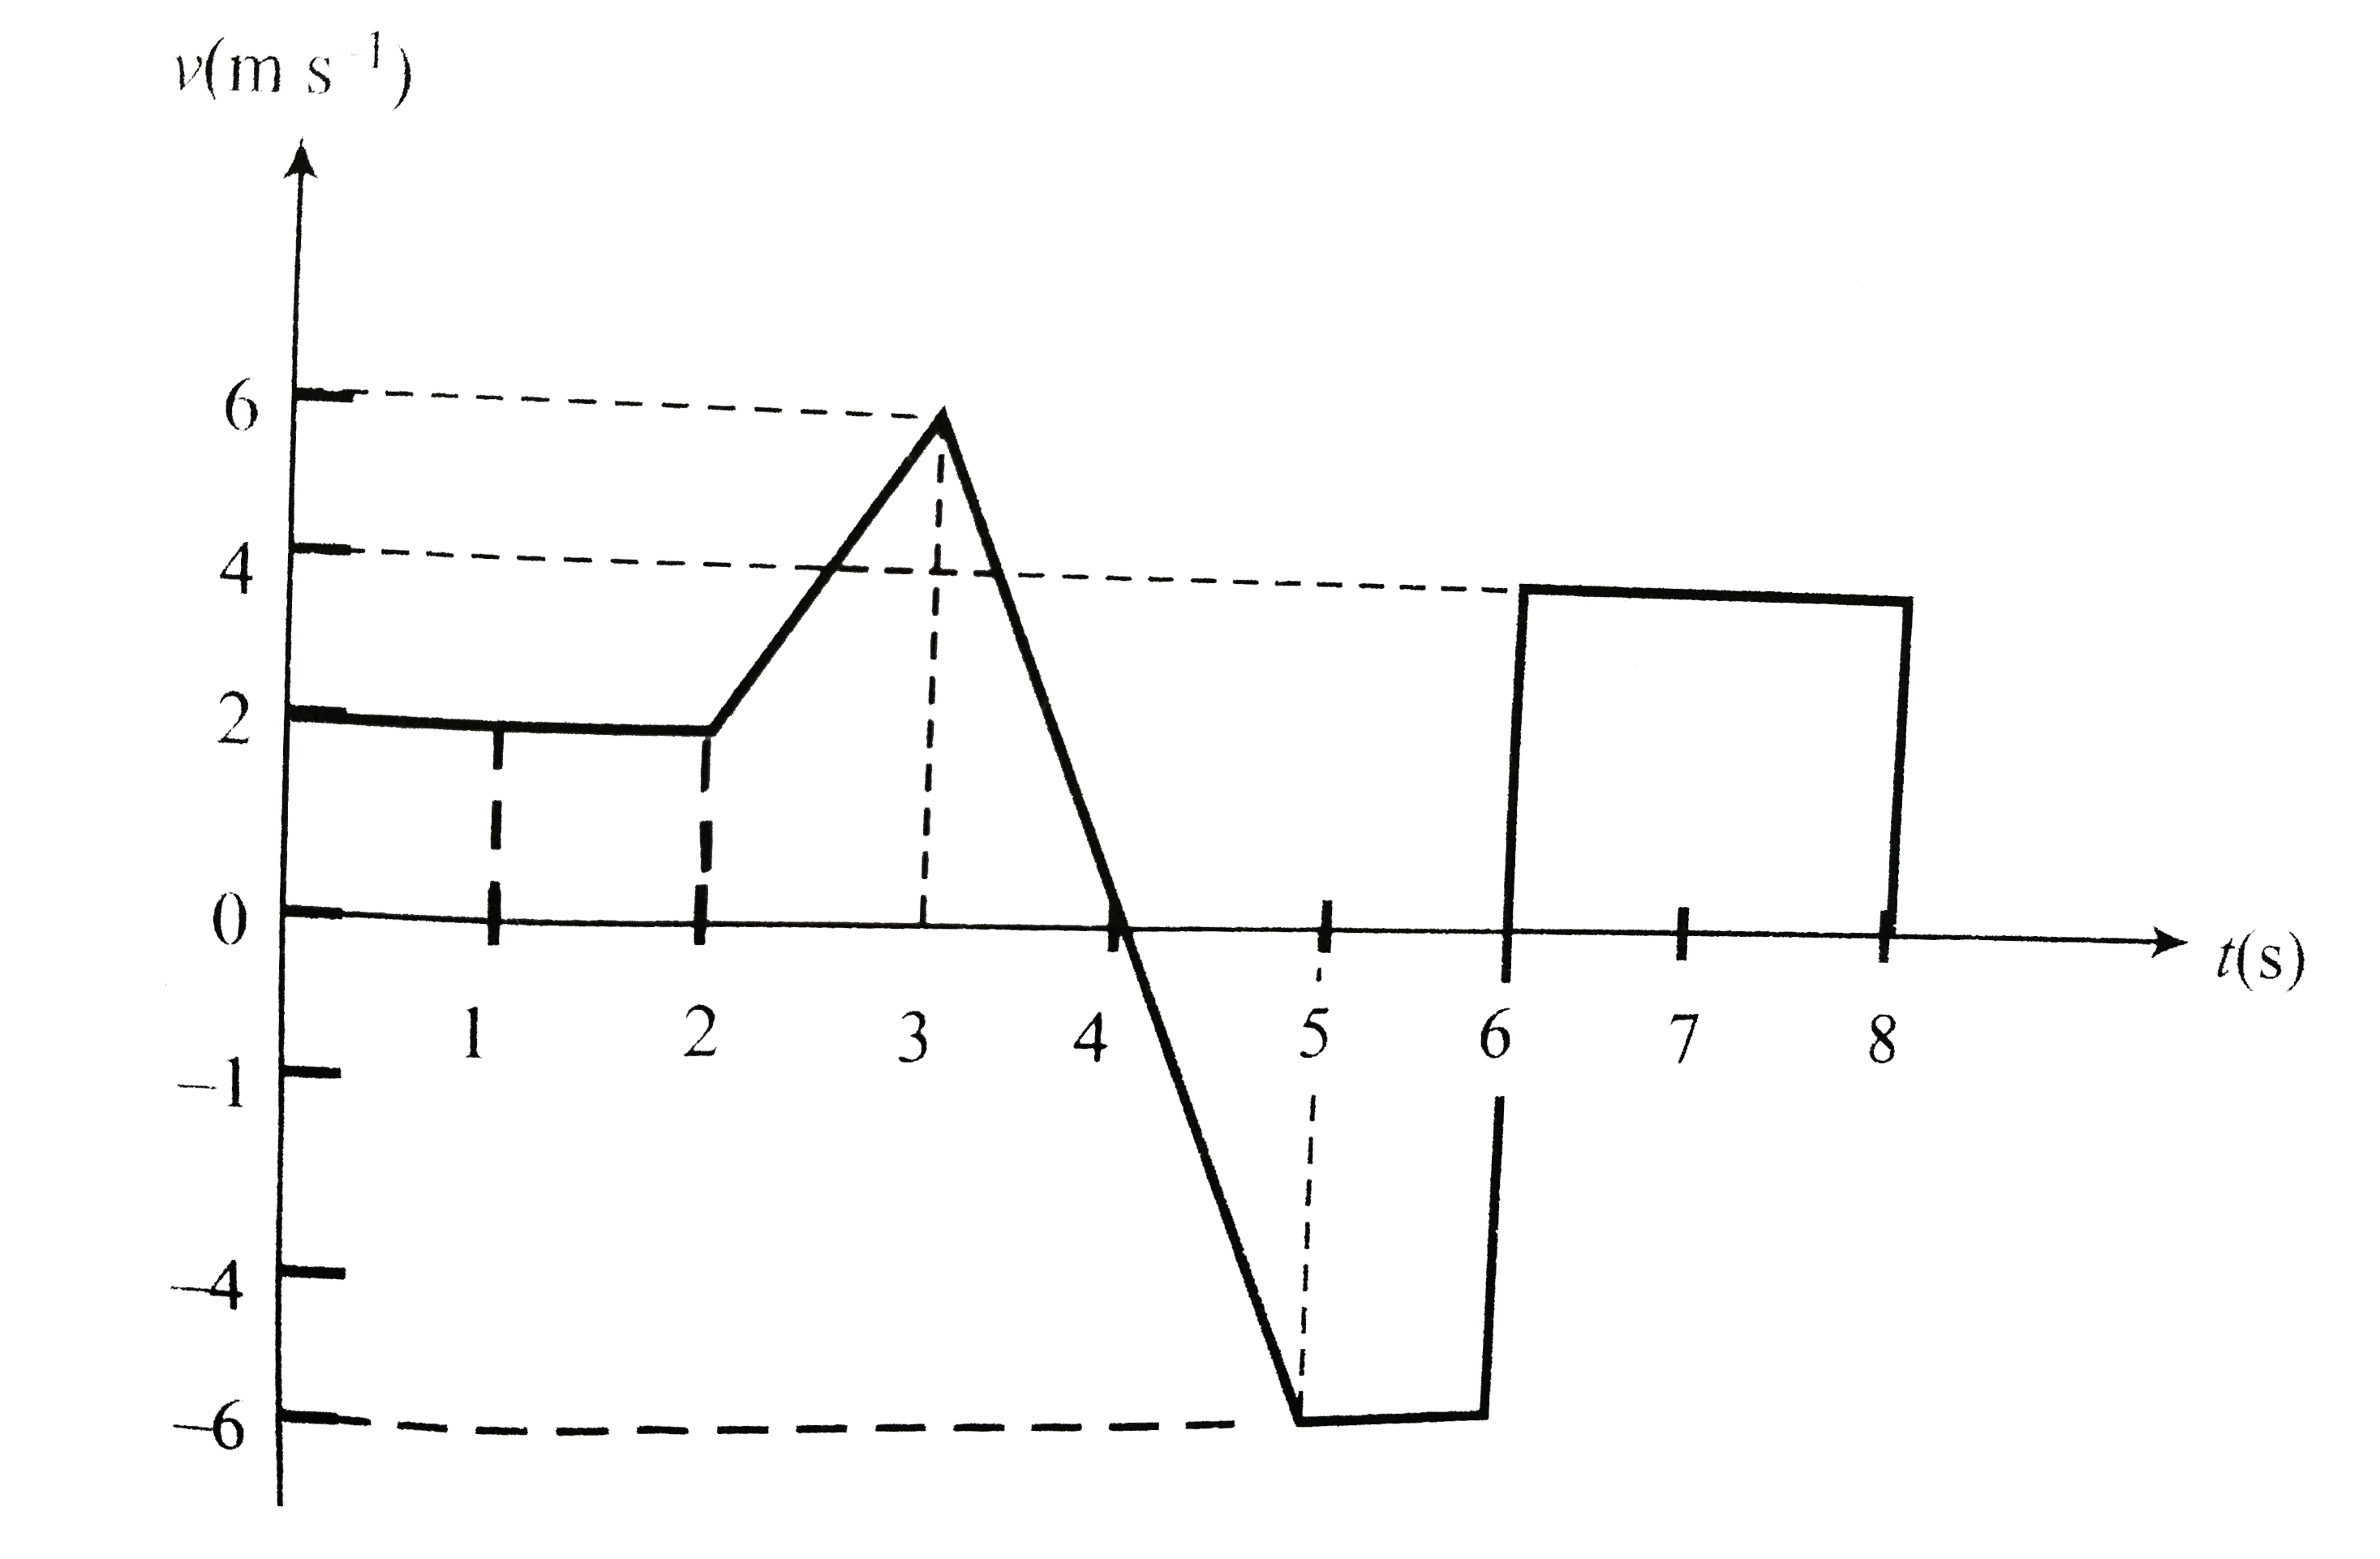 .A9mB12mC10mD28m
The speed time graph of a body of mass 50kg is shown in (figure). Calculate the force acting in the body
(i)from 0 to 4s (ii)from 4 to 6s

View SolutionThe speed time graph of a body is as shown in Figure. Calculate
(i) acceleration of body, (ii) retardation of body, (iii) total distance travelled by the body.
View SolutionThe displacement-time graph of a body is shown in the figure below. The part of the graph that represents the uniform motion of the body is _________
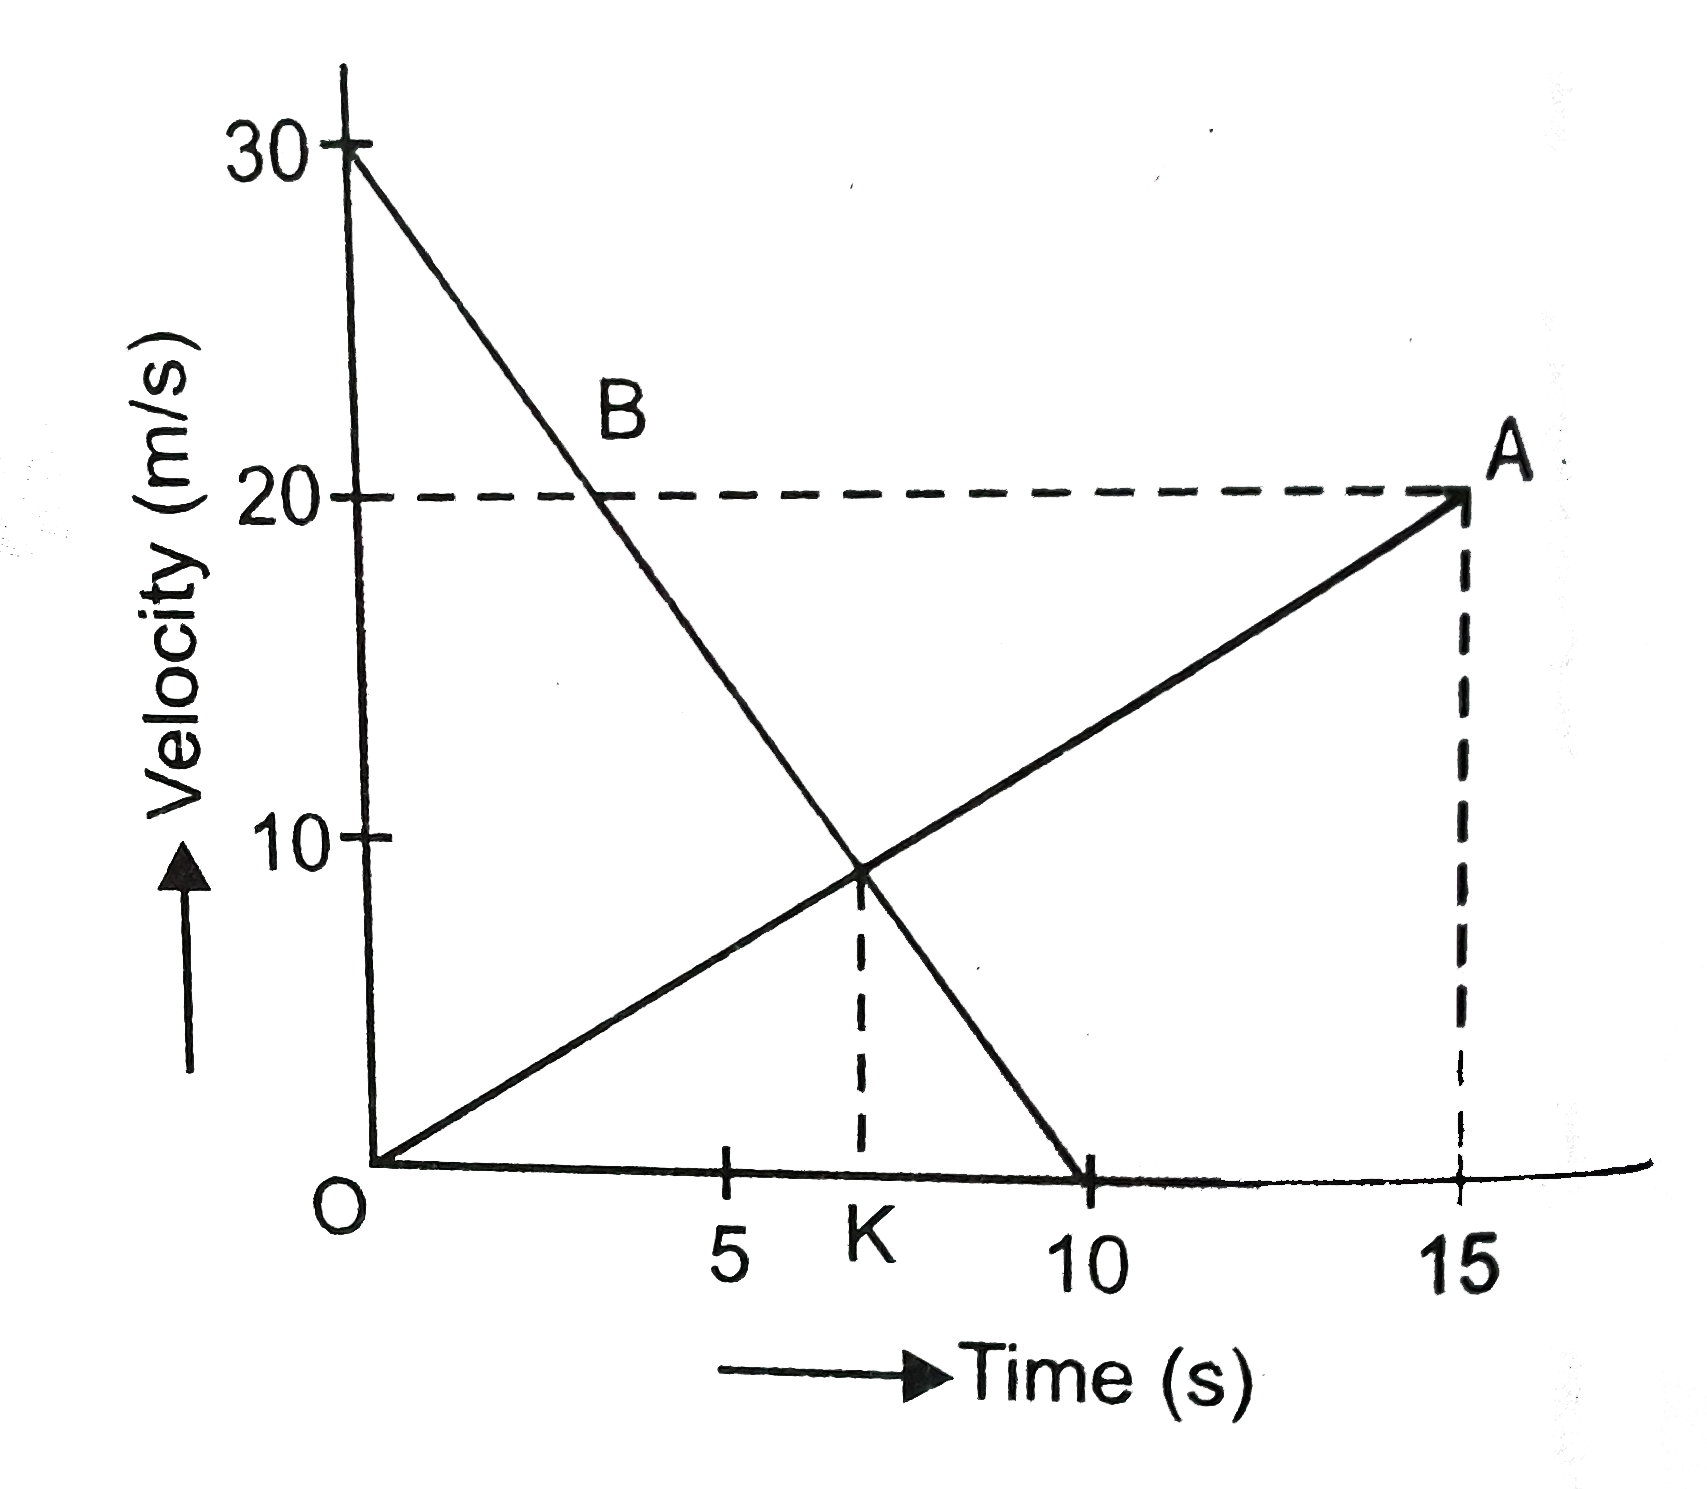
View SolutionThe velocity time graphs of two bodies A and B are shown in Figure. Observe these graphs carefully and answer the following questions :
(i) From the shape of graphs, what is nature of motion of A and B
(ii) What do you infer from the slopes of the graphs ?
(iii) What are the initial velocities of A and B ?
(iv) What is acceleration of A ?
(v) What is acceleration of B ?
(vi) What distance is travelled by B before coming to rest ?
(vii) At what time will the two bodies have equal velocity ?
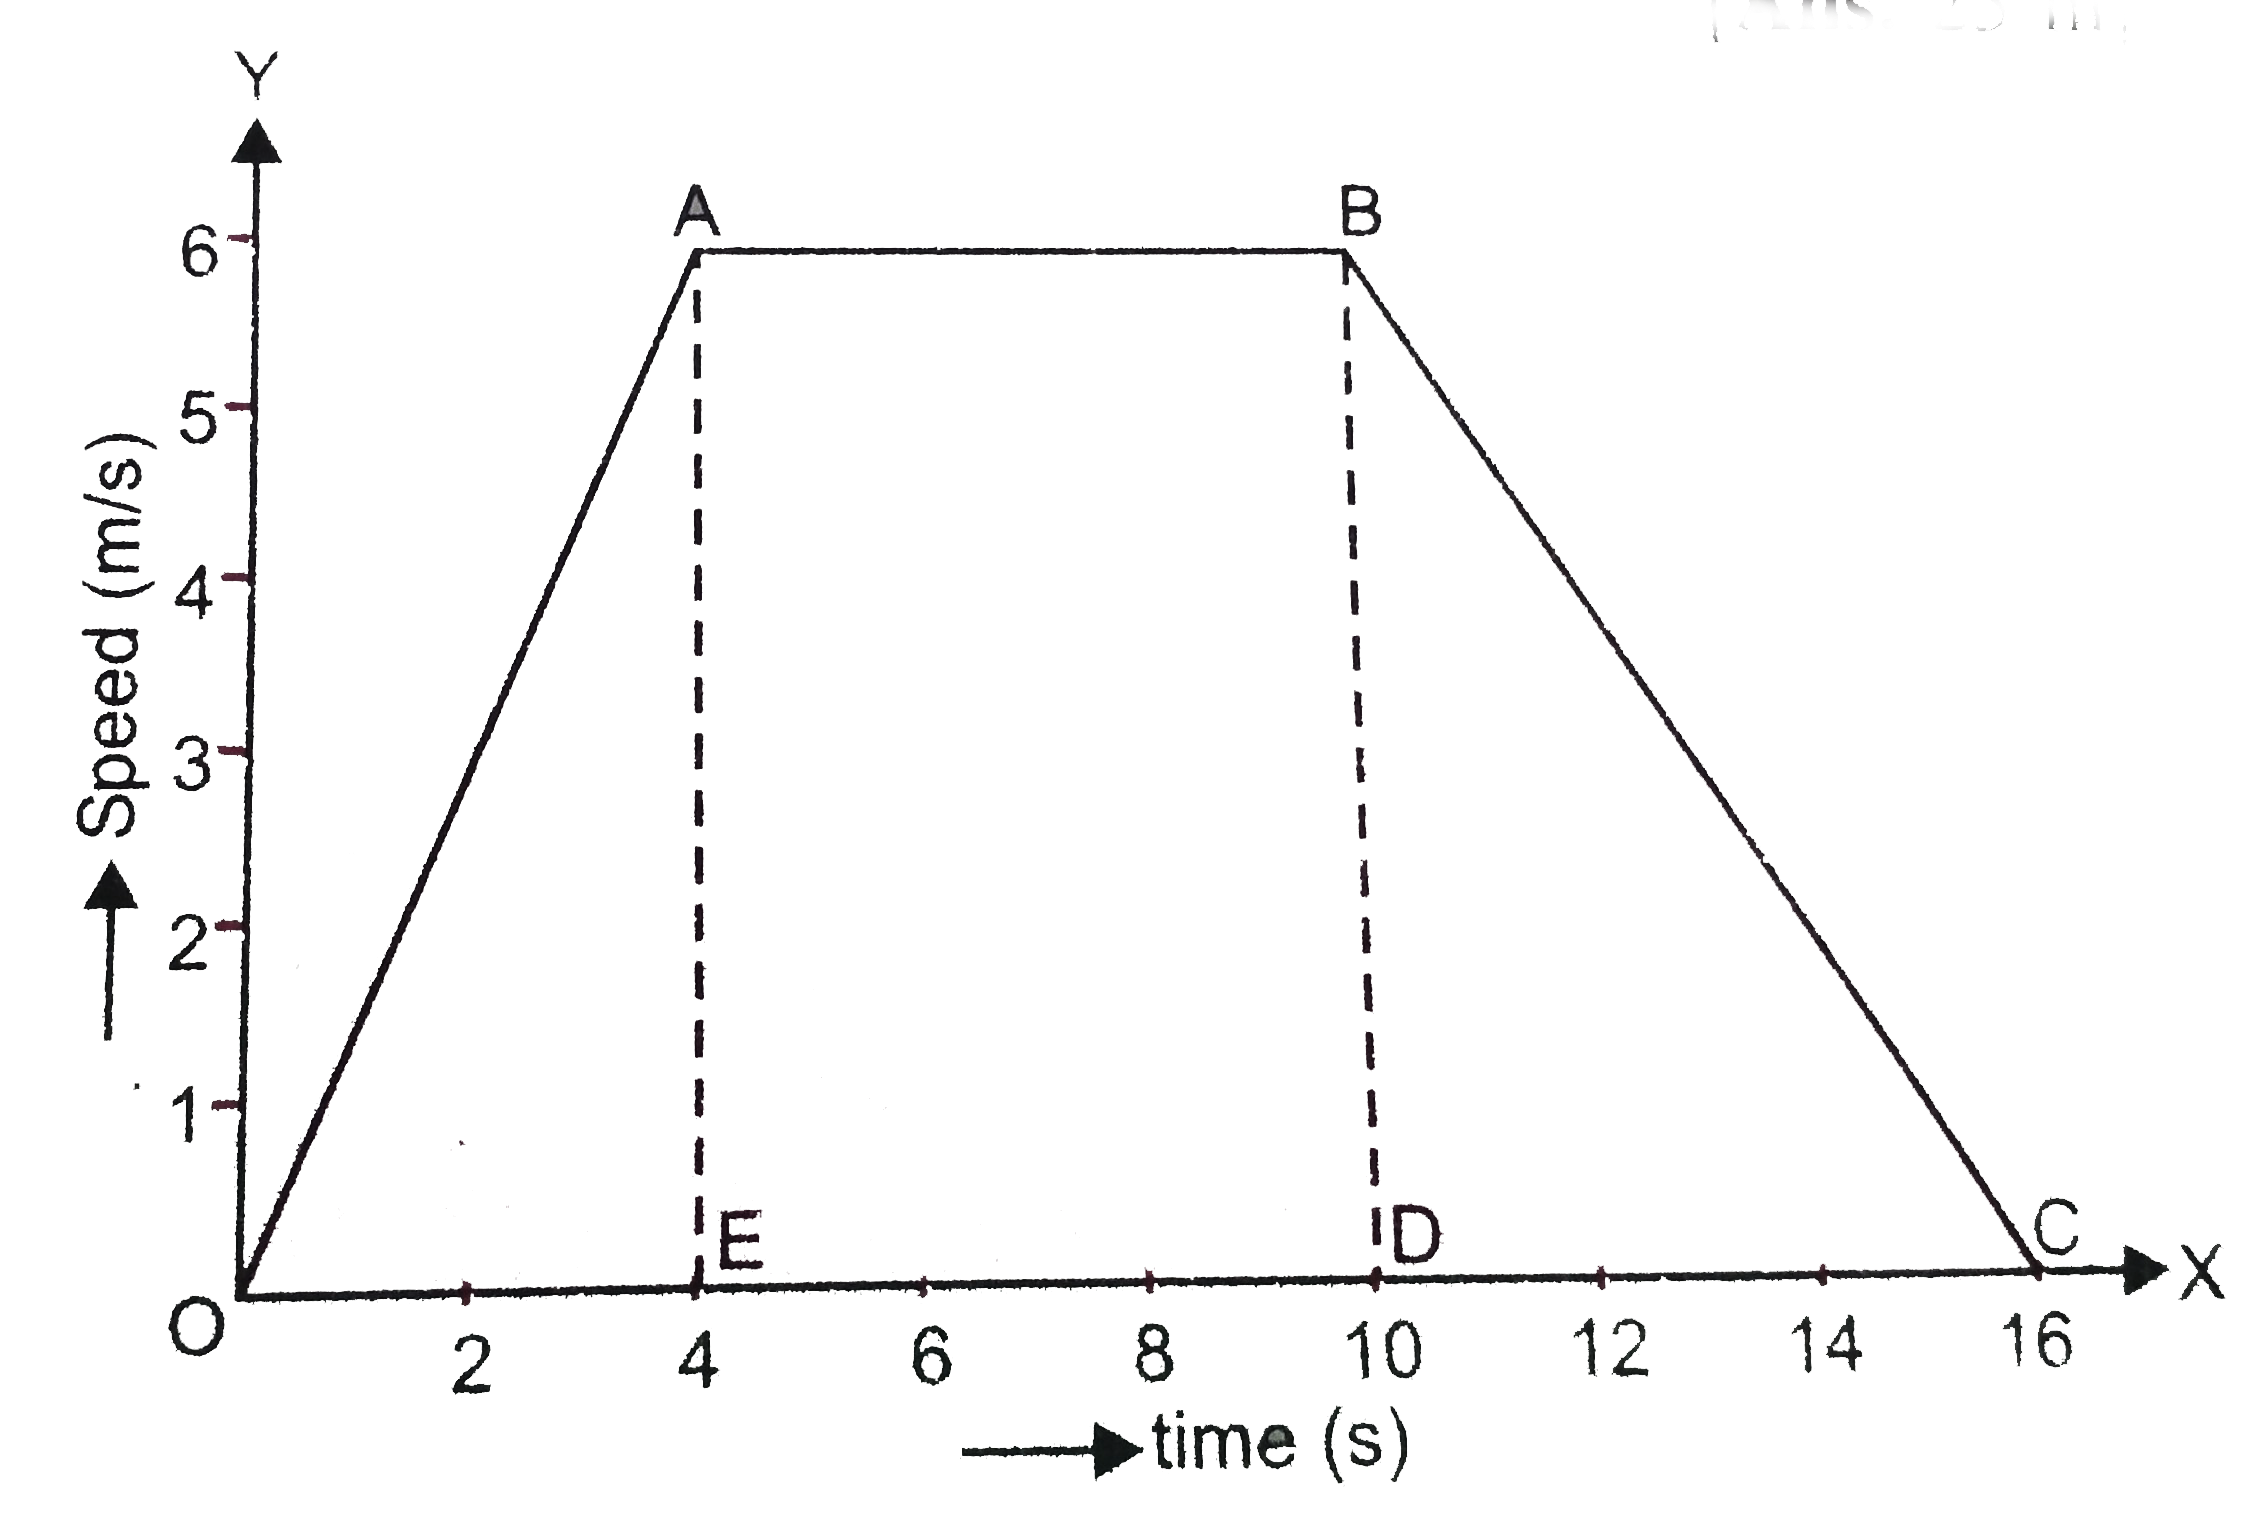
View SolutionStudy the speed time graph of a body shown in Figure. and answer the following questions:
(a) What type of motion is represented by OA ?
(b) What type of motion is represented by AB ?
( c ) What type of motion is represented by BC ?
(d) Find out acceleration of the body.
(e) Find out retardation of the body .
(f) Find out the distance travelled by the body from A to B
View Solution

