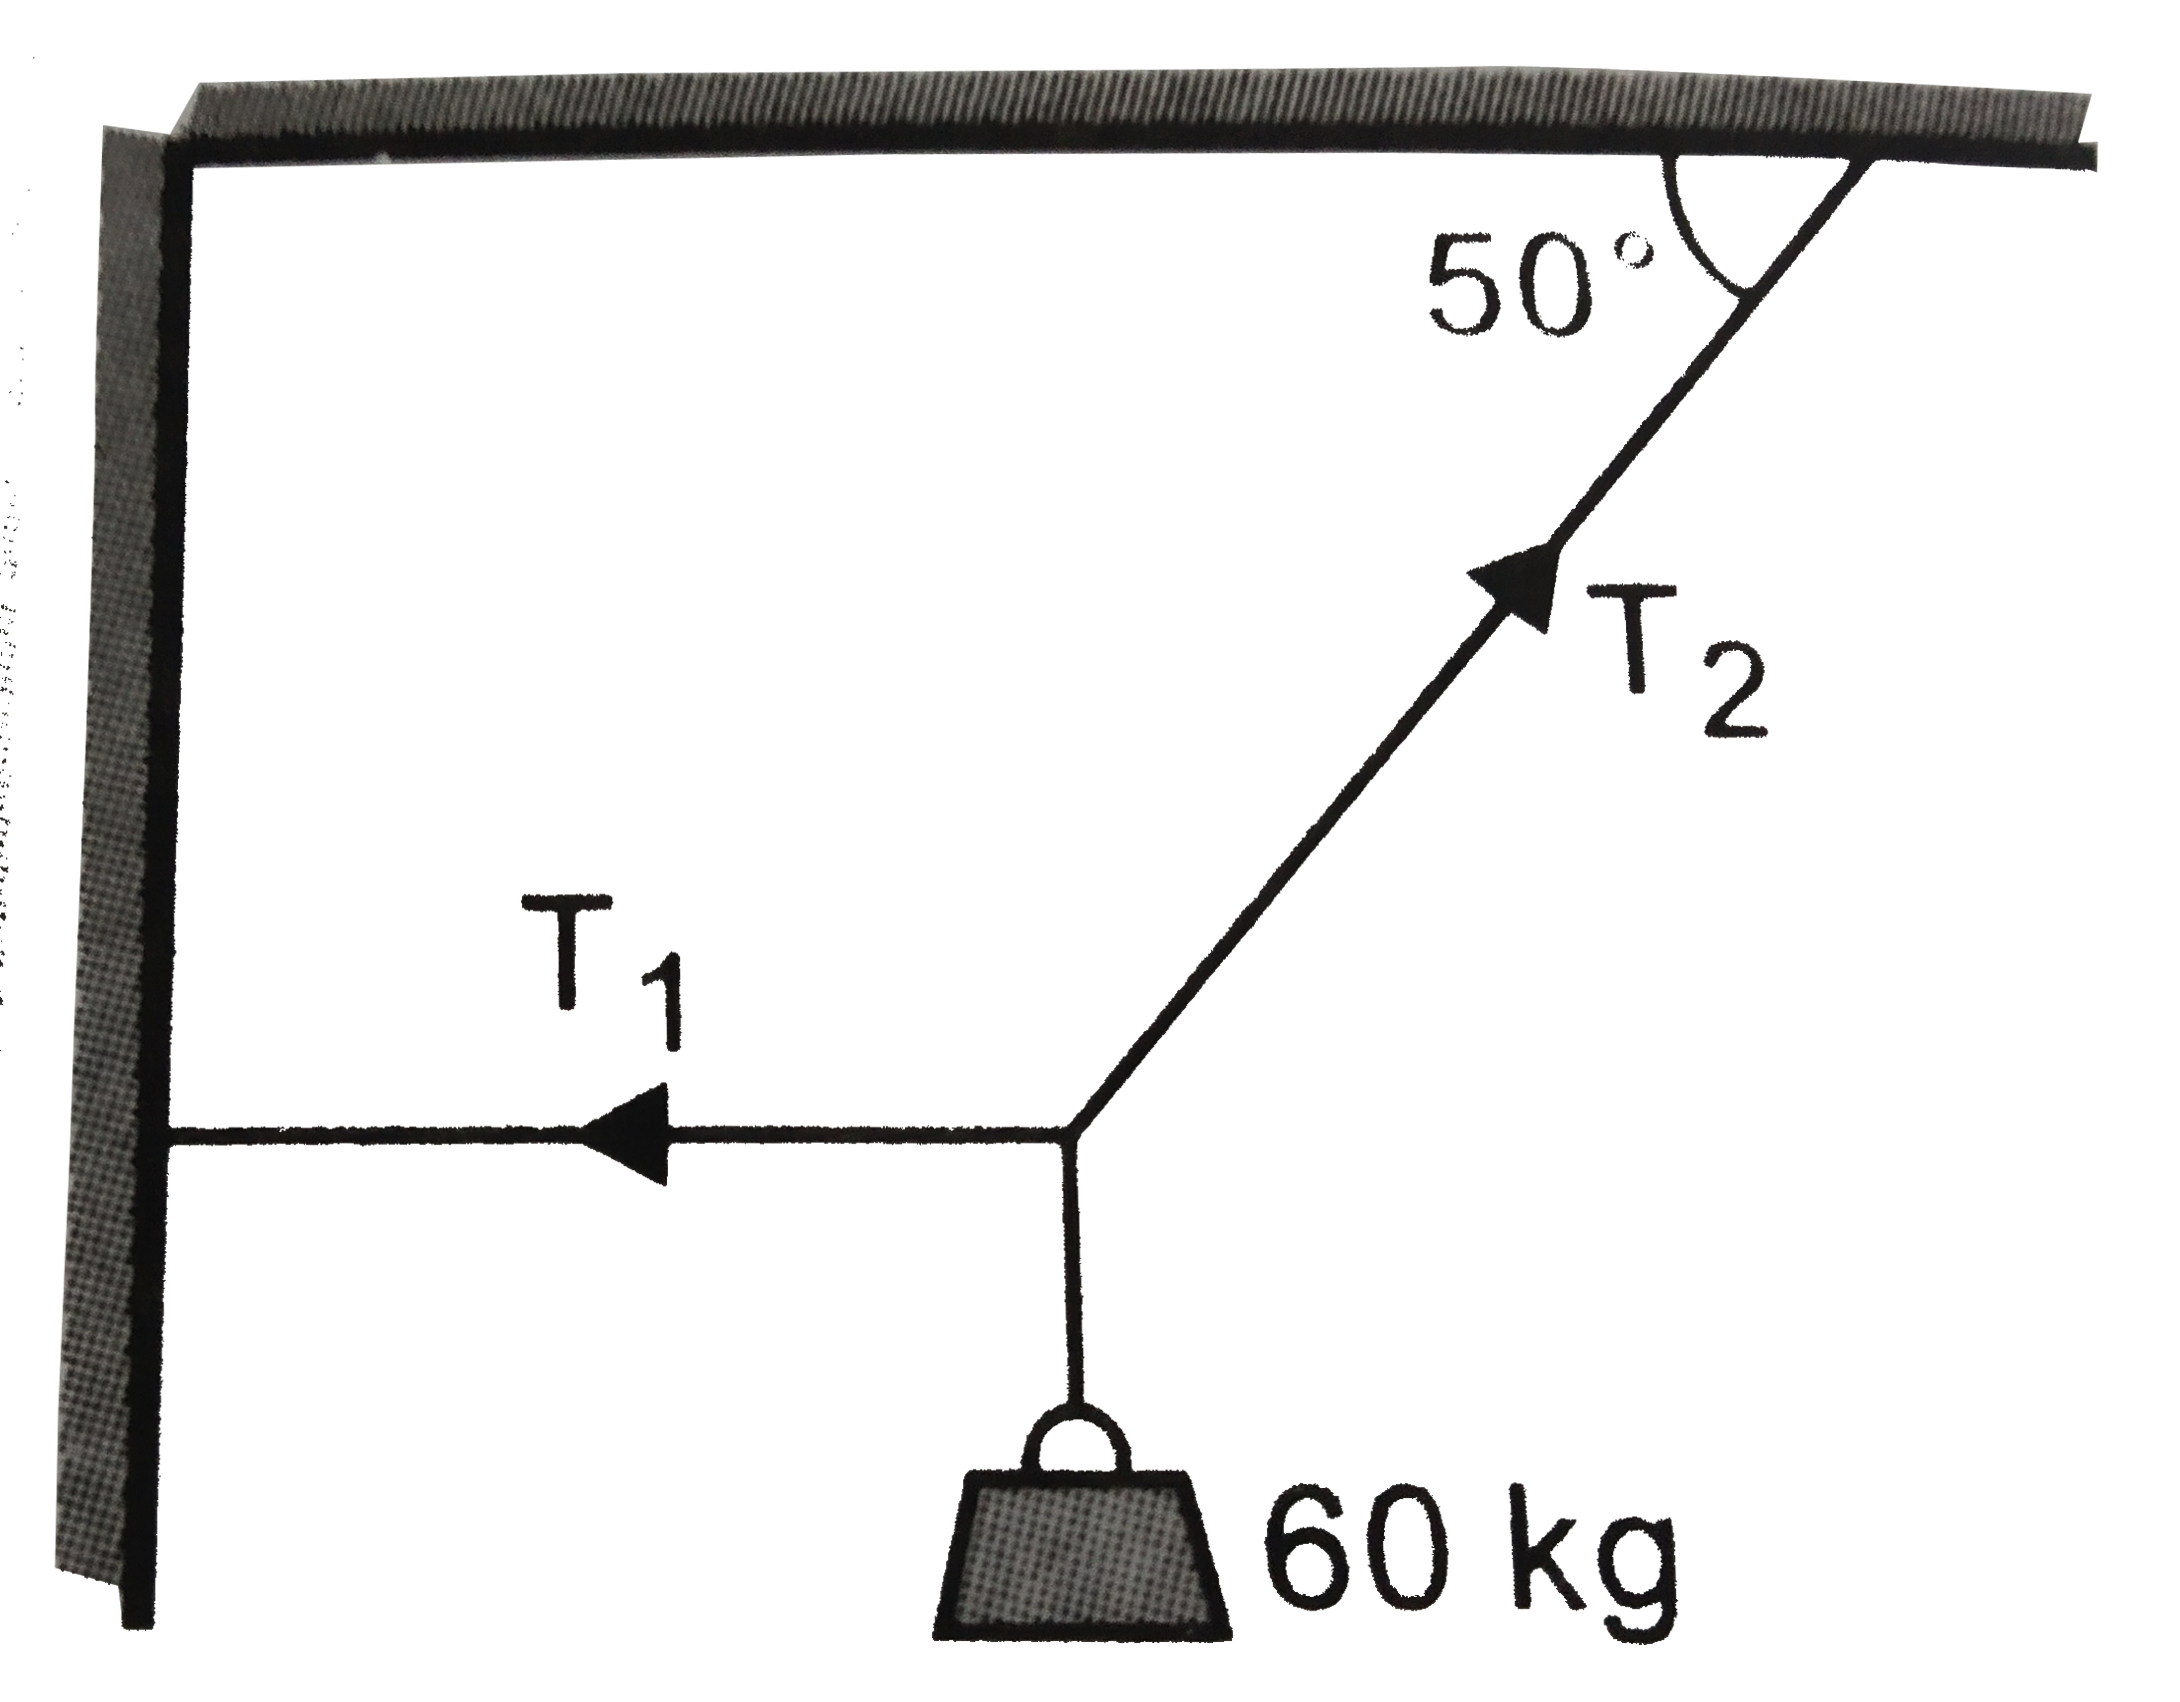
find the values of T1 and T2 for the sustem shown in Fig. 2 (c ) . 76 , g=10ms2.
 .
.
Video Solution
Text Solution
T2sin50∘=mg=60×10600N
or 1 T-2 = 600/0.766 = 783 N<br> T-1 = T_2 cos 50^@ = 7 83 xx 0.643 = 503 N.
|
Updated on:21/07/2023
Topper's Solved these Questions
- BOOK - PRADEEPCHAPTER - KINEMATICSEXERCISE - 4 Problems for practice45videos
KINEMATICS
- BOOK - PRADEEPCHAPTER - KINEMATICSEXERCISE - 1 Multiple choice10videos
KINEMATICS
- BOOK - PRADEEPCHAPTER - KINEMATICSEXERCISE - 2 Problems for practice36videos
KINEMATICS
- BOOK - PRADEEPCHAPTER - GRAVIATIONEXERCISE - Assertion-Reason Type Questions19videos
GRAVIATION
- BOOK - PRADEEPCHAPTER - LAWS OF MOTIONEXERCISE - Assertion- Reason Type Questions17videos
LAWS OF MOTION
Similar Questions
Knowledge Check
- Question 1 - Select One
Find the tension T2 in the system shown in fig.
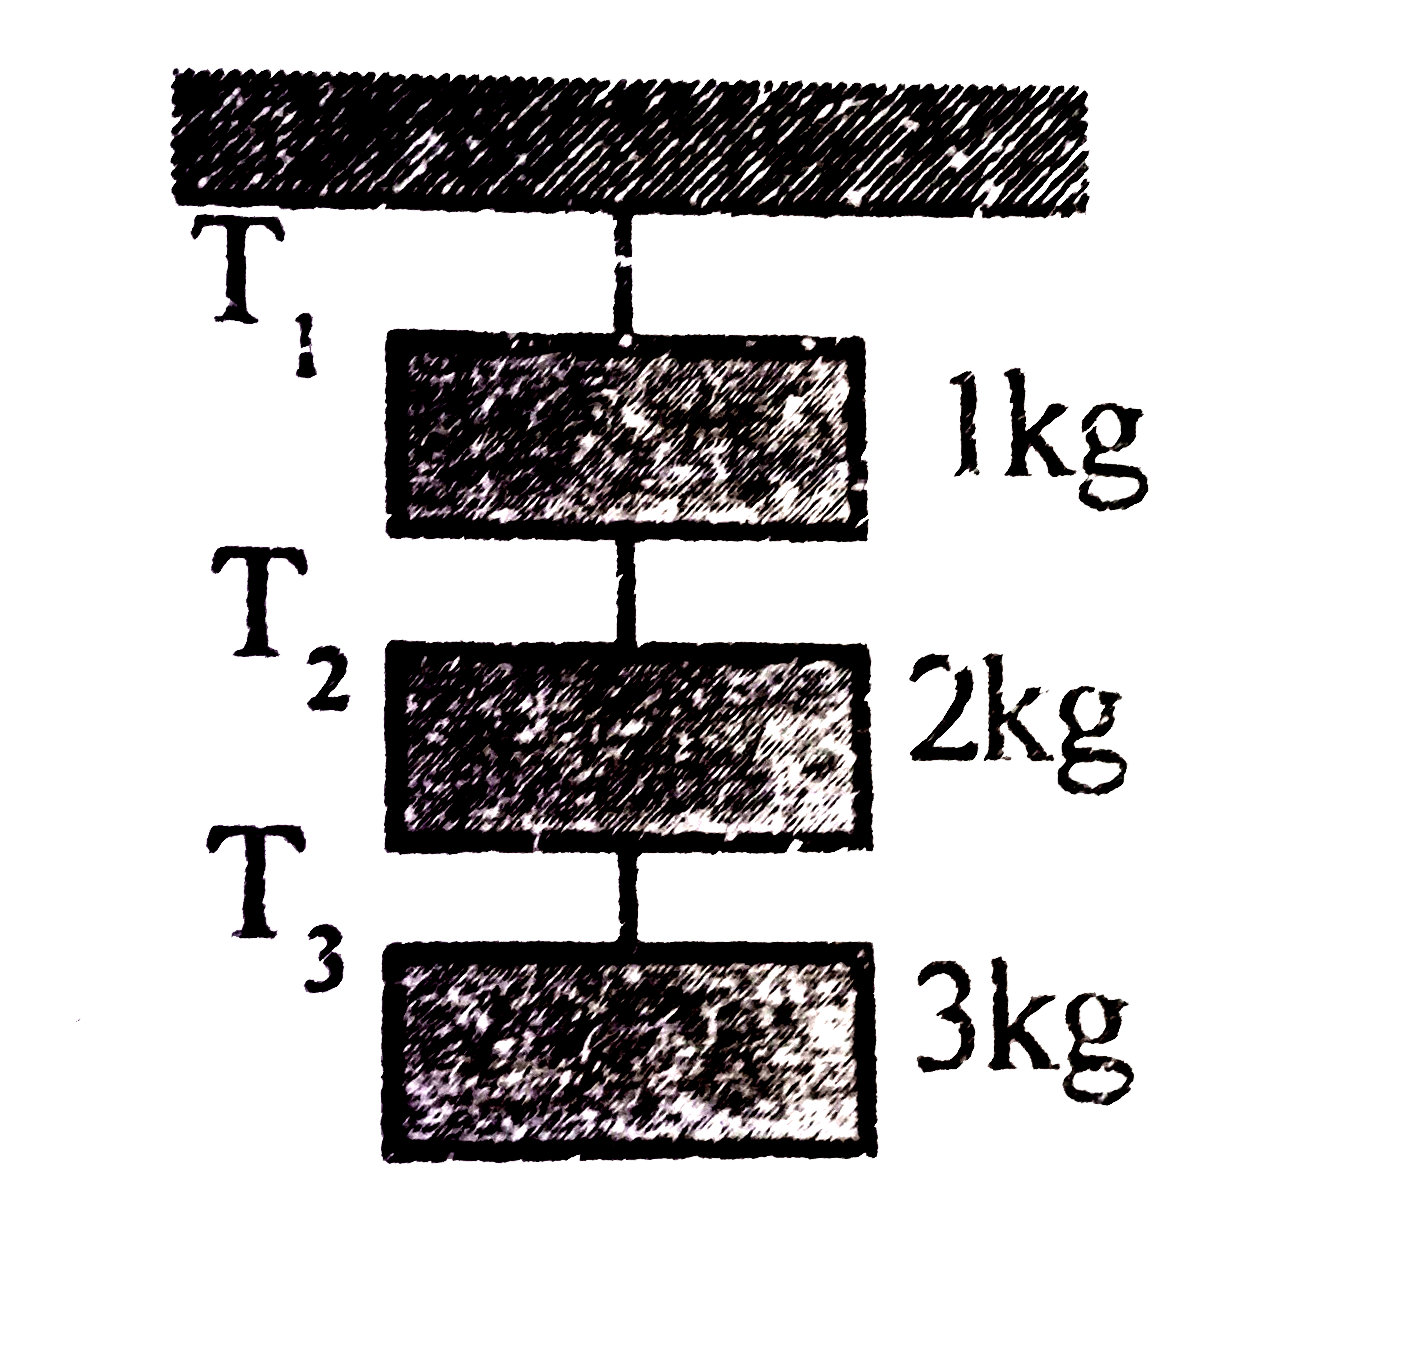 A1g NB2g NC5g ND6g N
 - Question 2 - Select One
Find the tension T2 in the system shown in fig
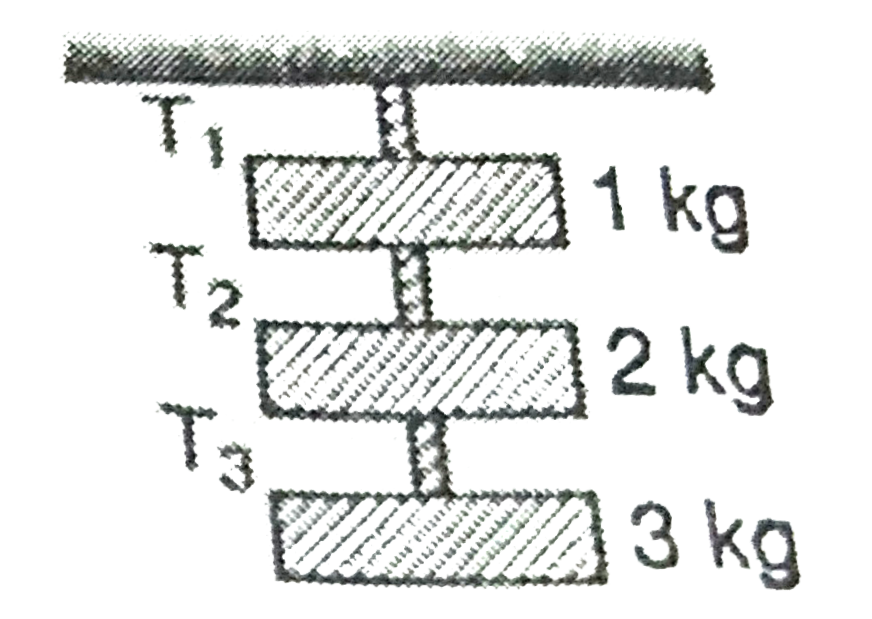 A1g NB2g NC5g ND6g N
 - Question 3 - Select One
The acceleration time graph of a particle is shown in the Fig. 2 (CF). 11. At time t=10s is the particle is 8ms−1. Its velocity t=10s is.
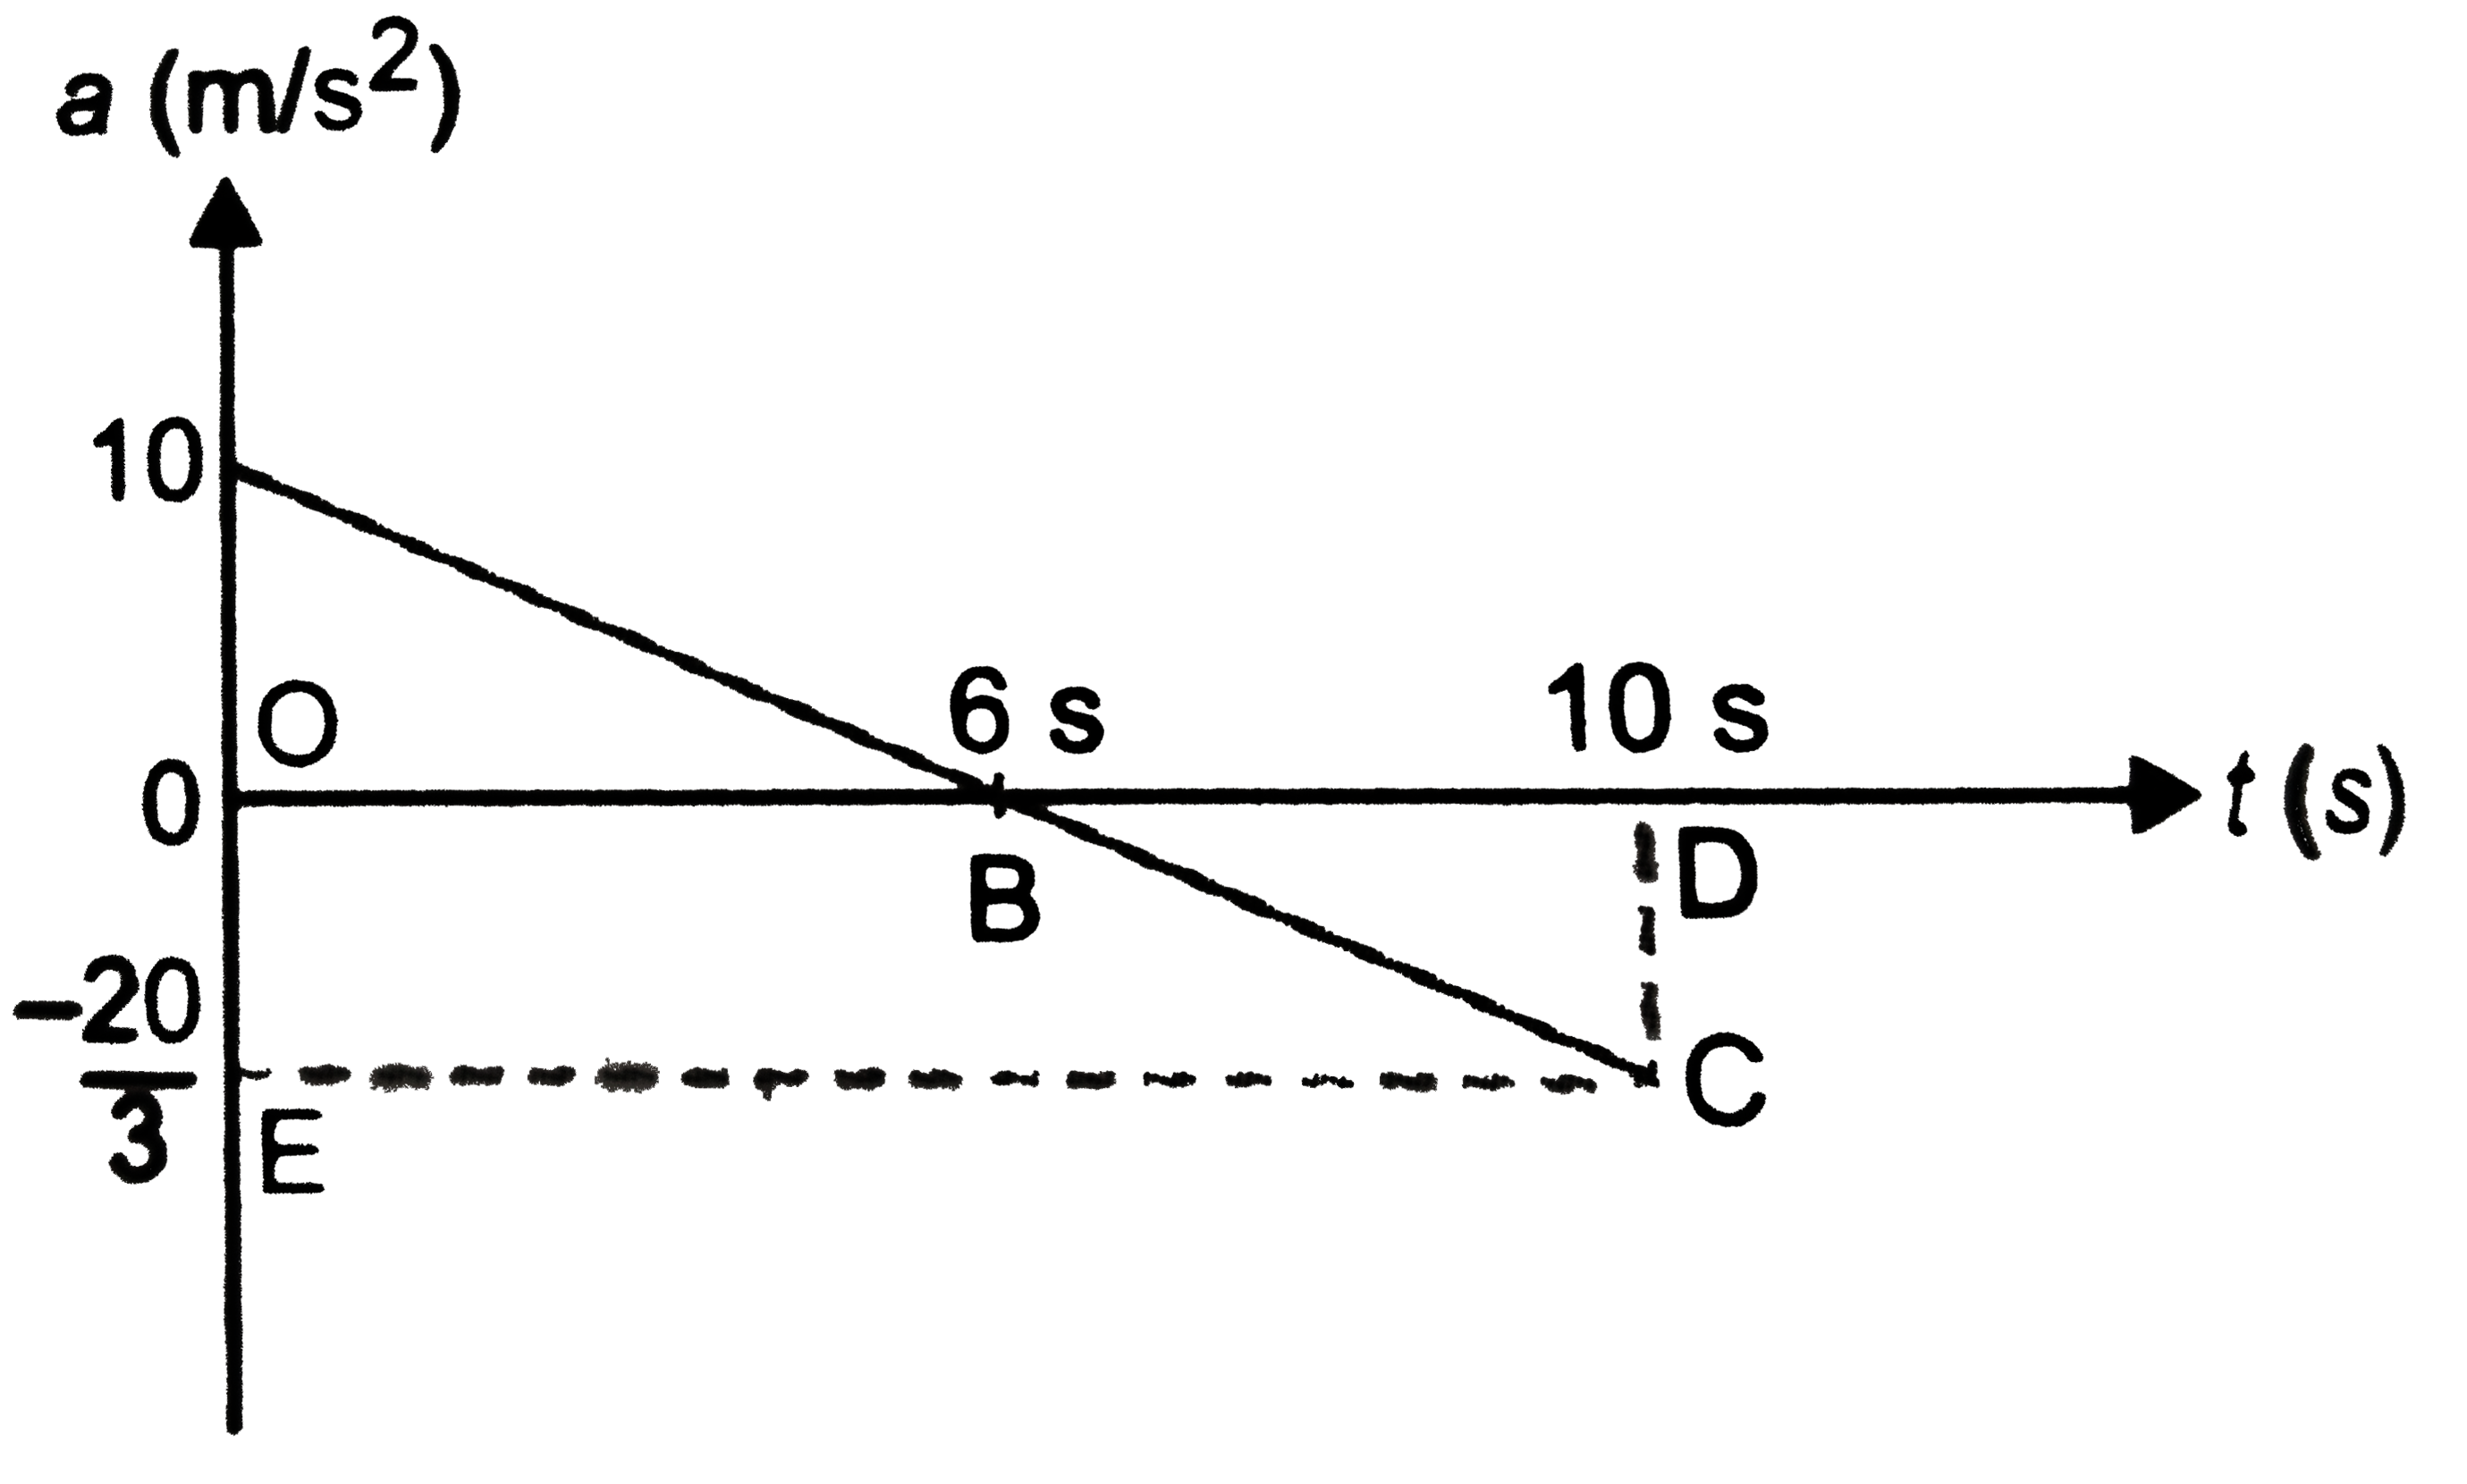 .A(a) (50)/3 ma^(-1)B(b) (70)/3 ma^(-1)C(c ) 743ms−1D(d) (144)/3 ms^(-1)
Given ratio of time period T1T2. For the two systems shown here is √x. Find x
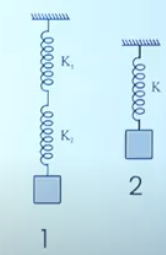 View Solution
I-V graph for a given metallic wire at two temperatures T1 and T2 is as shown in Fig. Which of the two temperatures is lower and why?
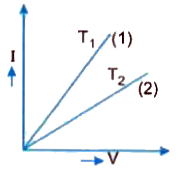 View Solution
In the arrangement as shown, tension T2 is (g=10m/s2)
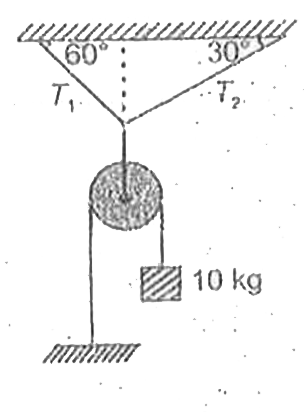 View Solution
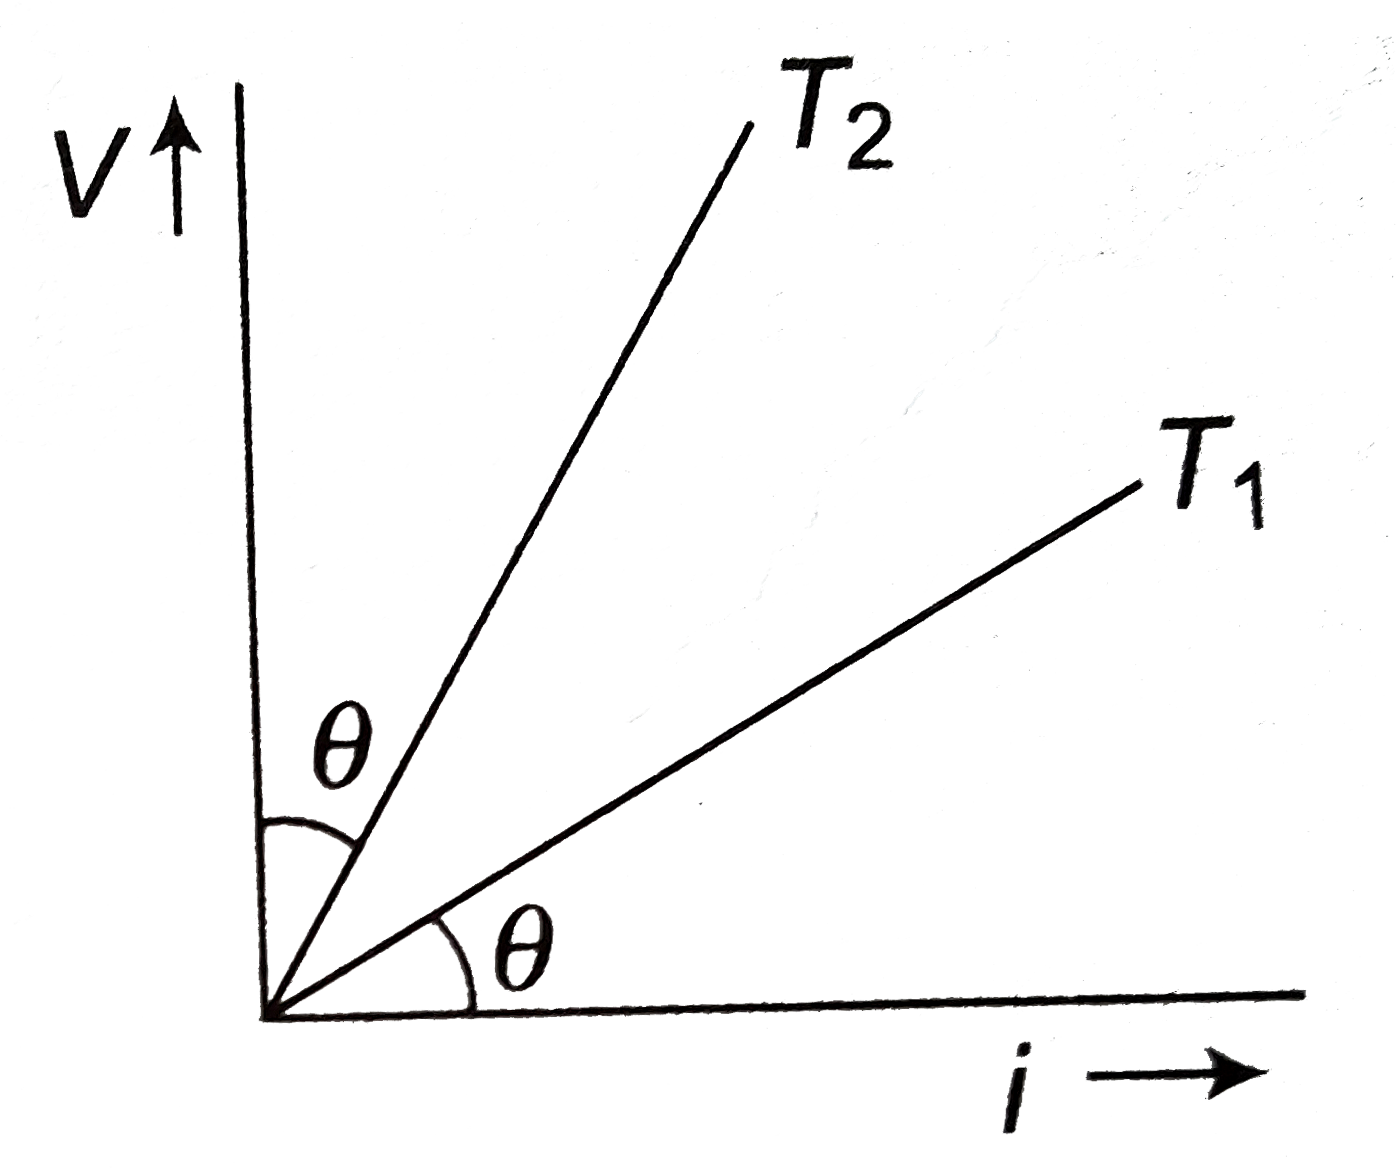
The V−i graph for a conductor at temeratures T1 and T2 are as shown in the figure. (T2−T1) is alphaortional to.
 .View Solution
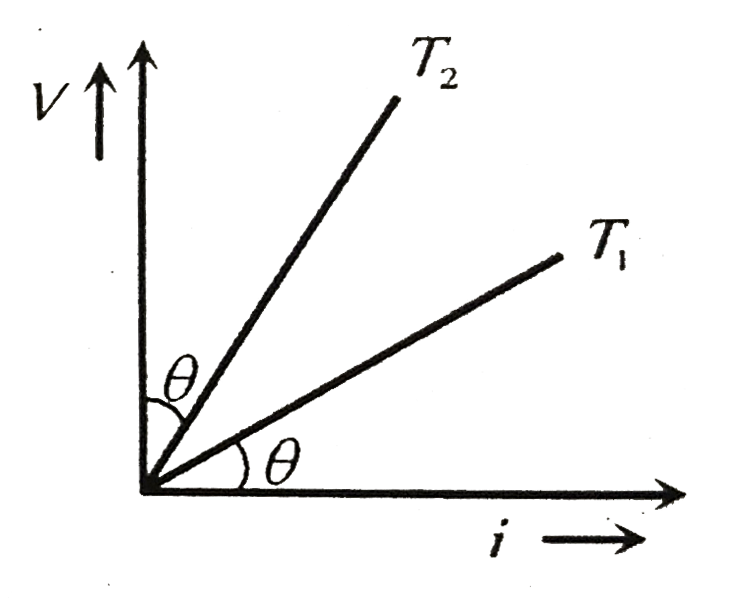
The V - i graph for a conductor at temperature T1 and T2 are as shown in the figure. (T2−T1) is proportional to
 View Solution


