Which one of the following function best represent the graphs as shown below?
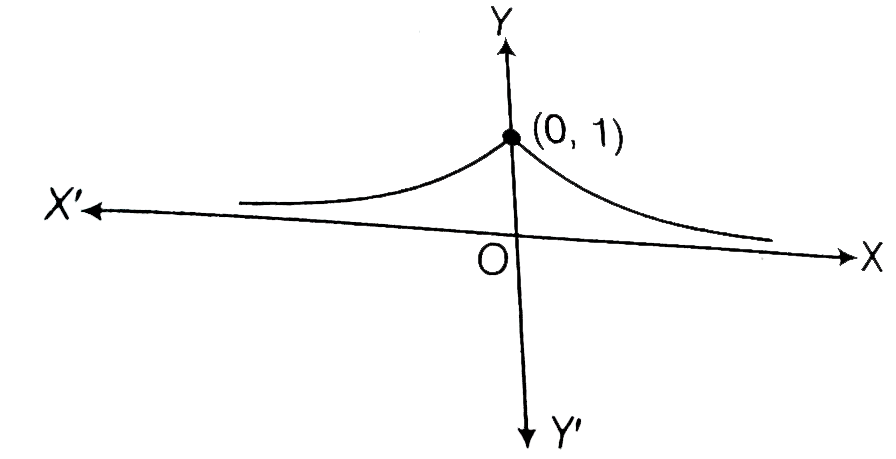
f(x)=11+x2
f(x)=1√1+|x|
f(x)=e−|x|
f(x)=a|x|,a>1
The correct Answer is:C
Step by step video & image solution for Which one of the following function best represent the graphs as shown below? by Maths experts to help you in doubts & scoring excellent marks in Class 12 exams.
Updated on:21/07/2023Topper's Solved these Questions
- FUNCTIONSBOOK - ARIHANT MATHSCHAPTER - FUNCTIONSEXERCISE - Exercise (More Than One Correct Option Type Questions)
25 Videos
- FUNCTIONSBOOK - ARIHANT MATHSCHAPTER - FUNCTIONSEXERCISE - Exercise (Statement I And Ii Type Questions)
11 Videos
- FUNCTIONSBOOK - ARIHANT MATHSCHAPTER - FUNCTIONSEXERCISE - Exercise For Session 12
4 Videos
- ESSENTIAL MATHEMATICAL TOOLS BOOK - ARIHANT MATHSCHAPTER - ESSENTIAL MATHEMATICAL TOOLS EXERCISE - Exercise (Single Integer Answer Type Questions)
3 Videos
- GRAPHICAL TRANSFORMATIONSBOOK - ARIHANT MATHSCHAPTER - GRAPHICAL TRANSFORMATIONSEXERCISE - Exercise (Questions Asked In Previous 13 Years Exam)
10 Videos
Similar Questions
Knowledge Check
Which one of the following graphs represents motion?
A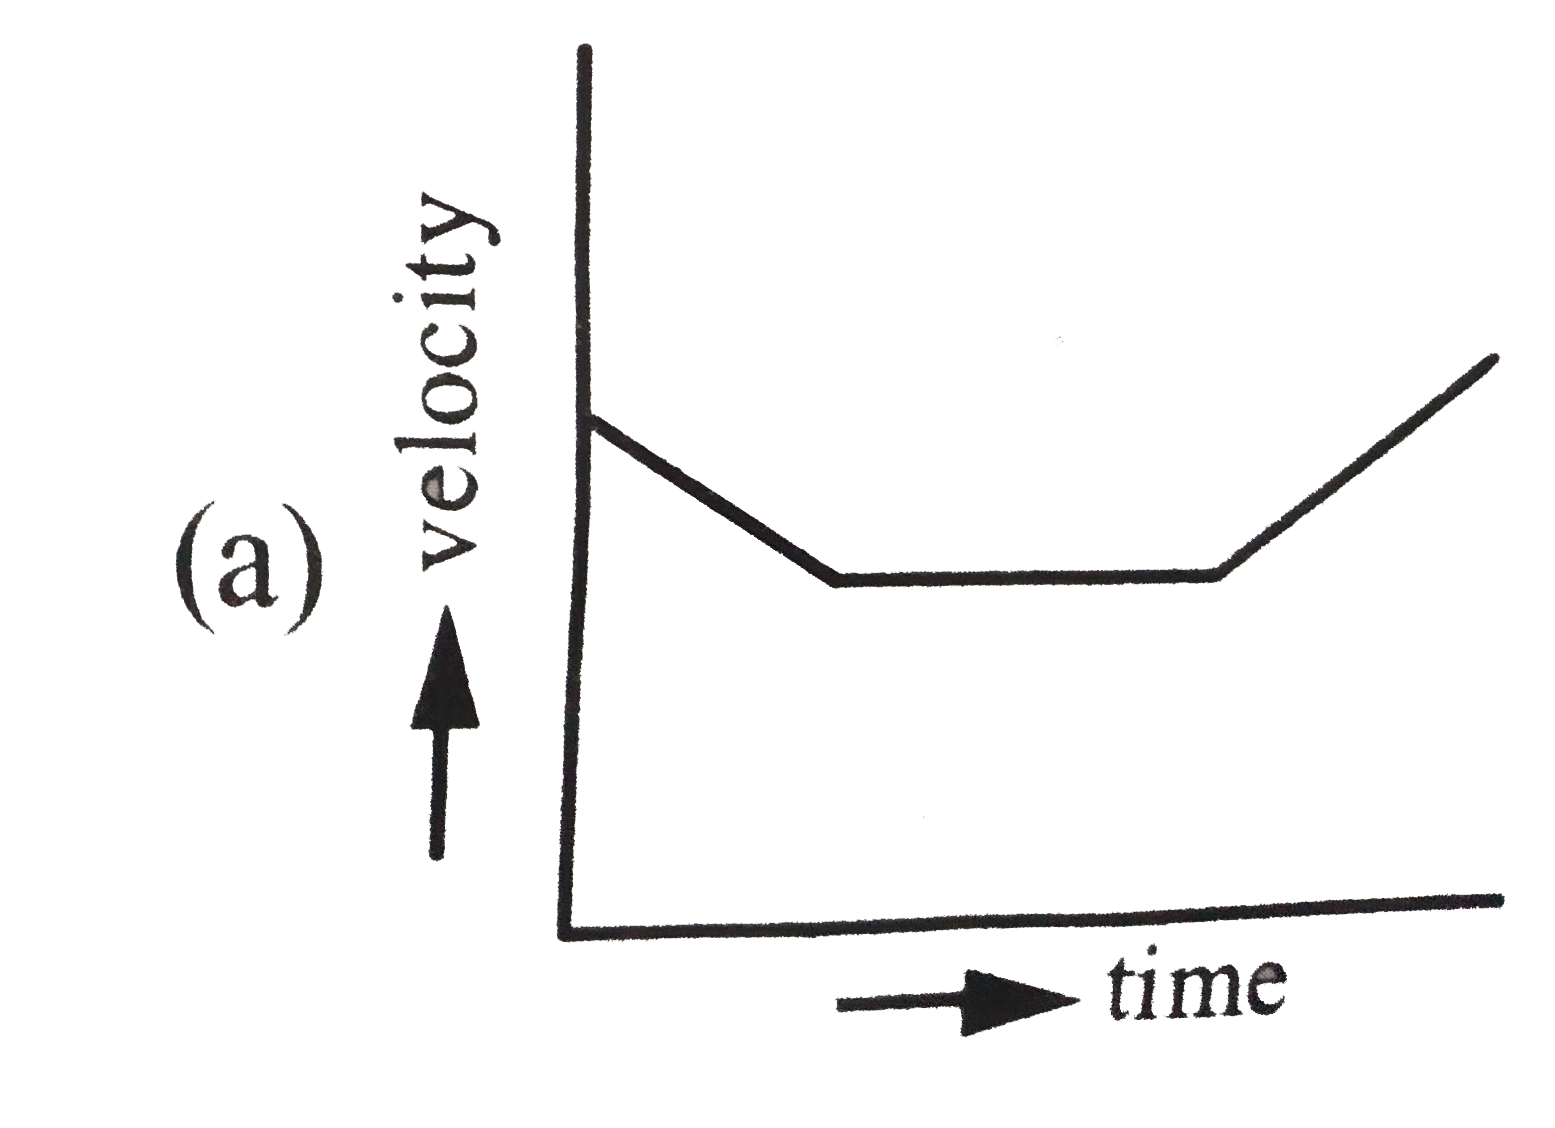 B
B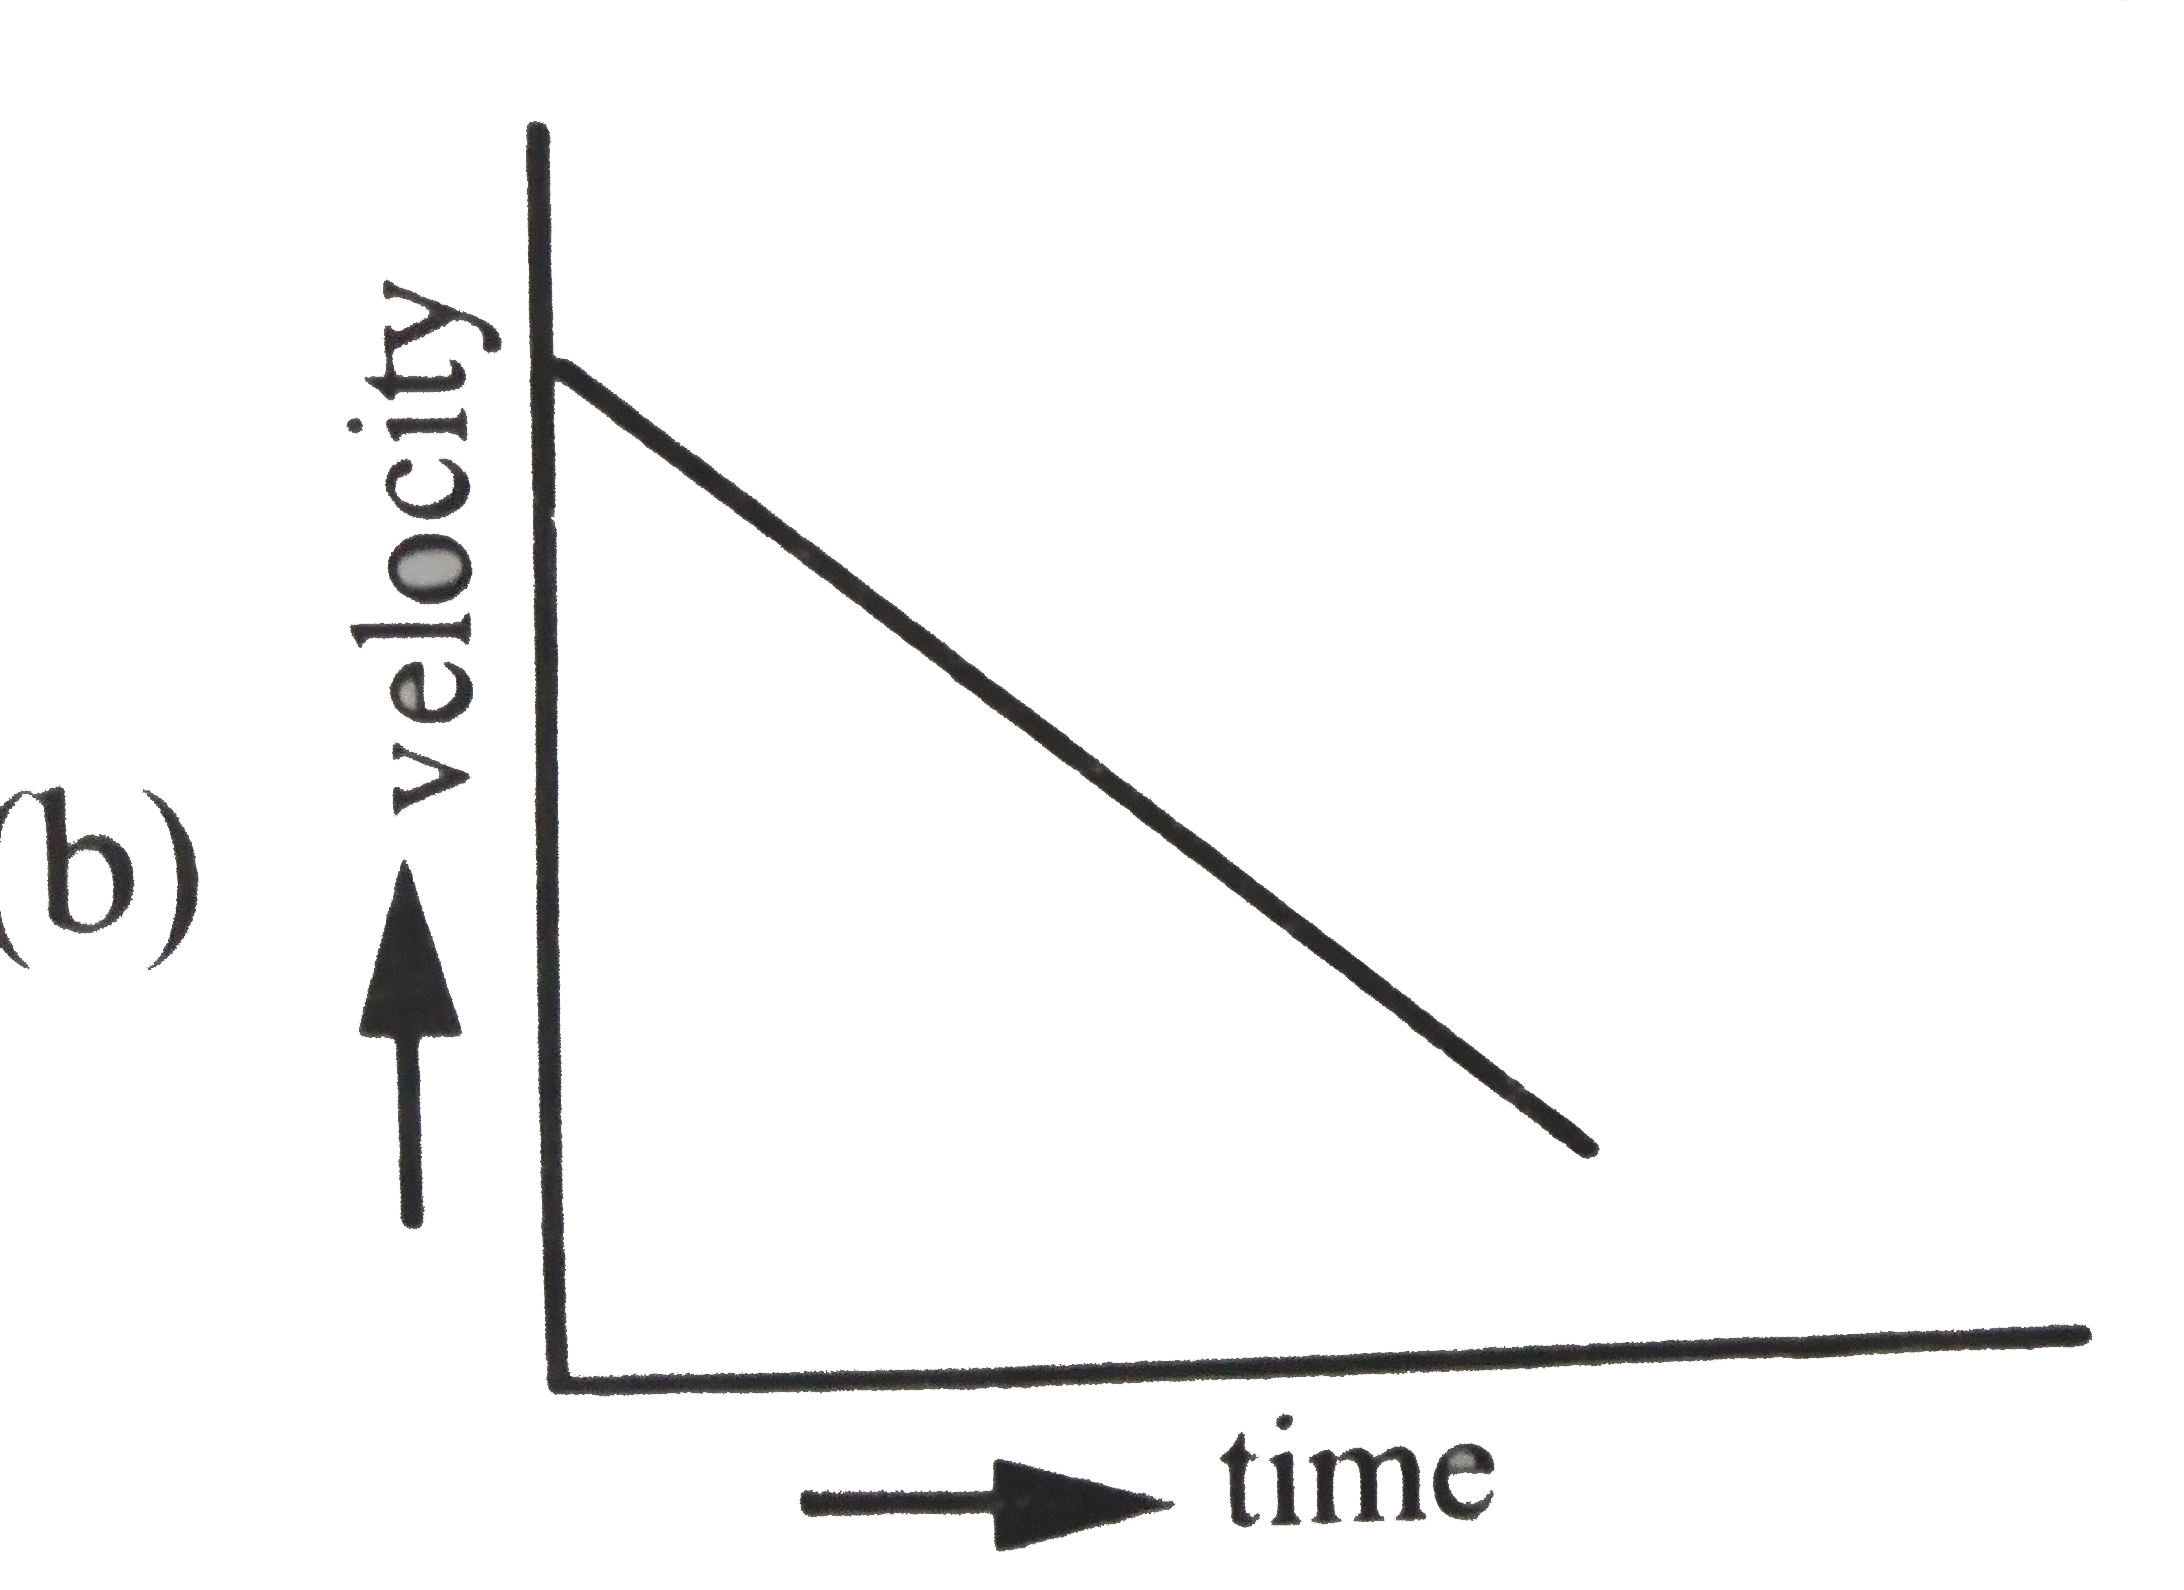 C
C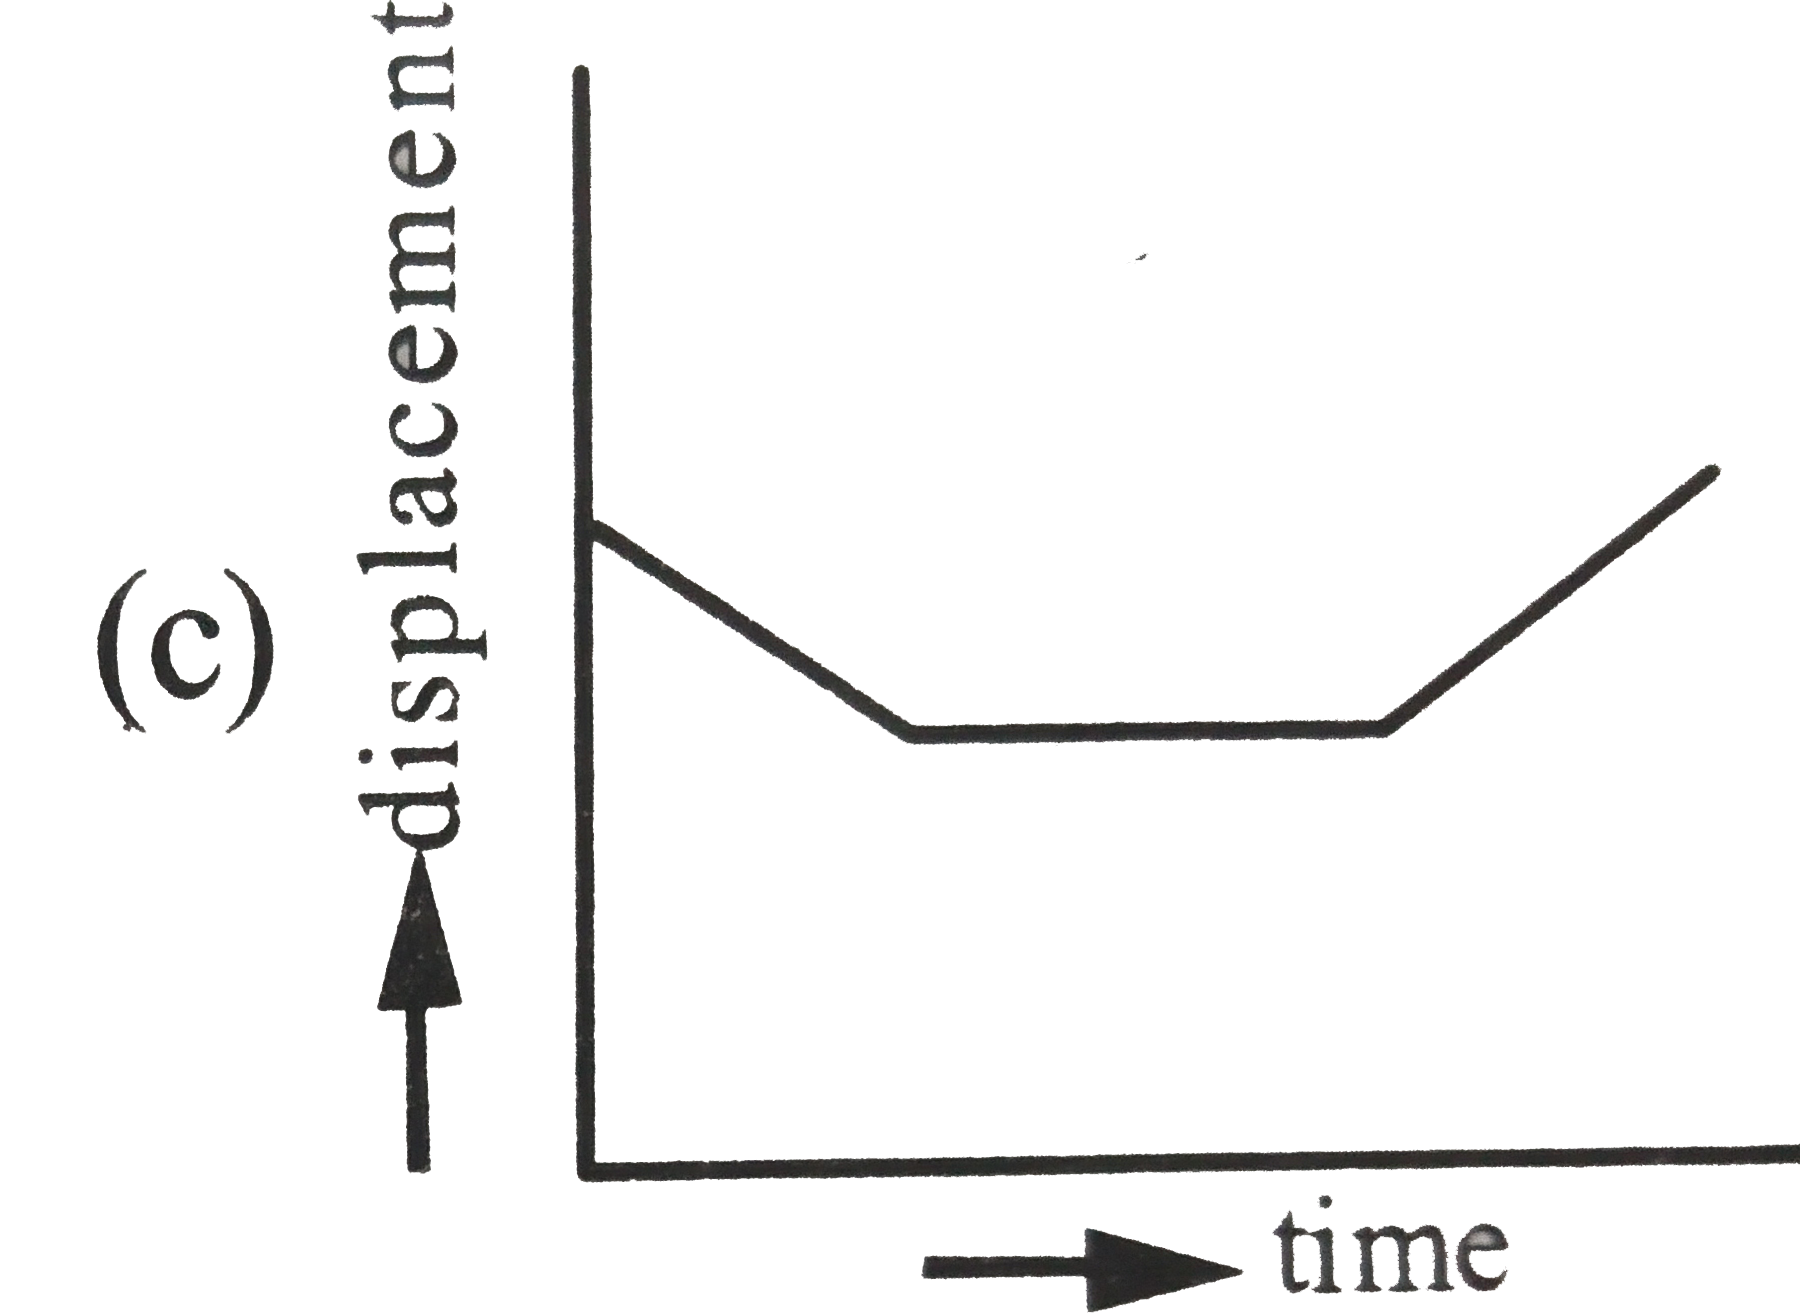 D
D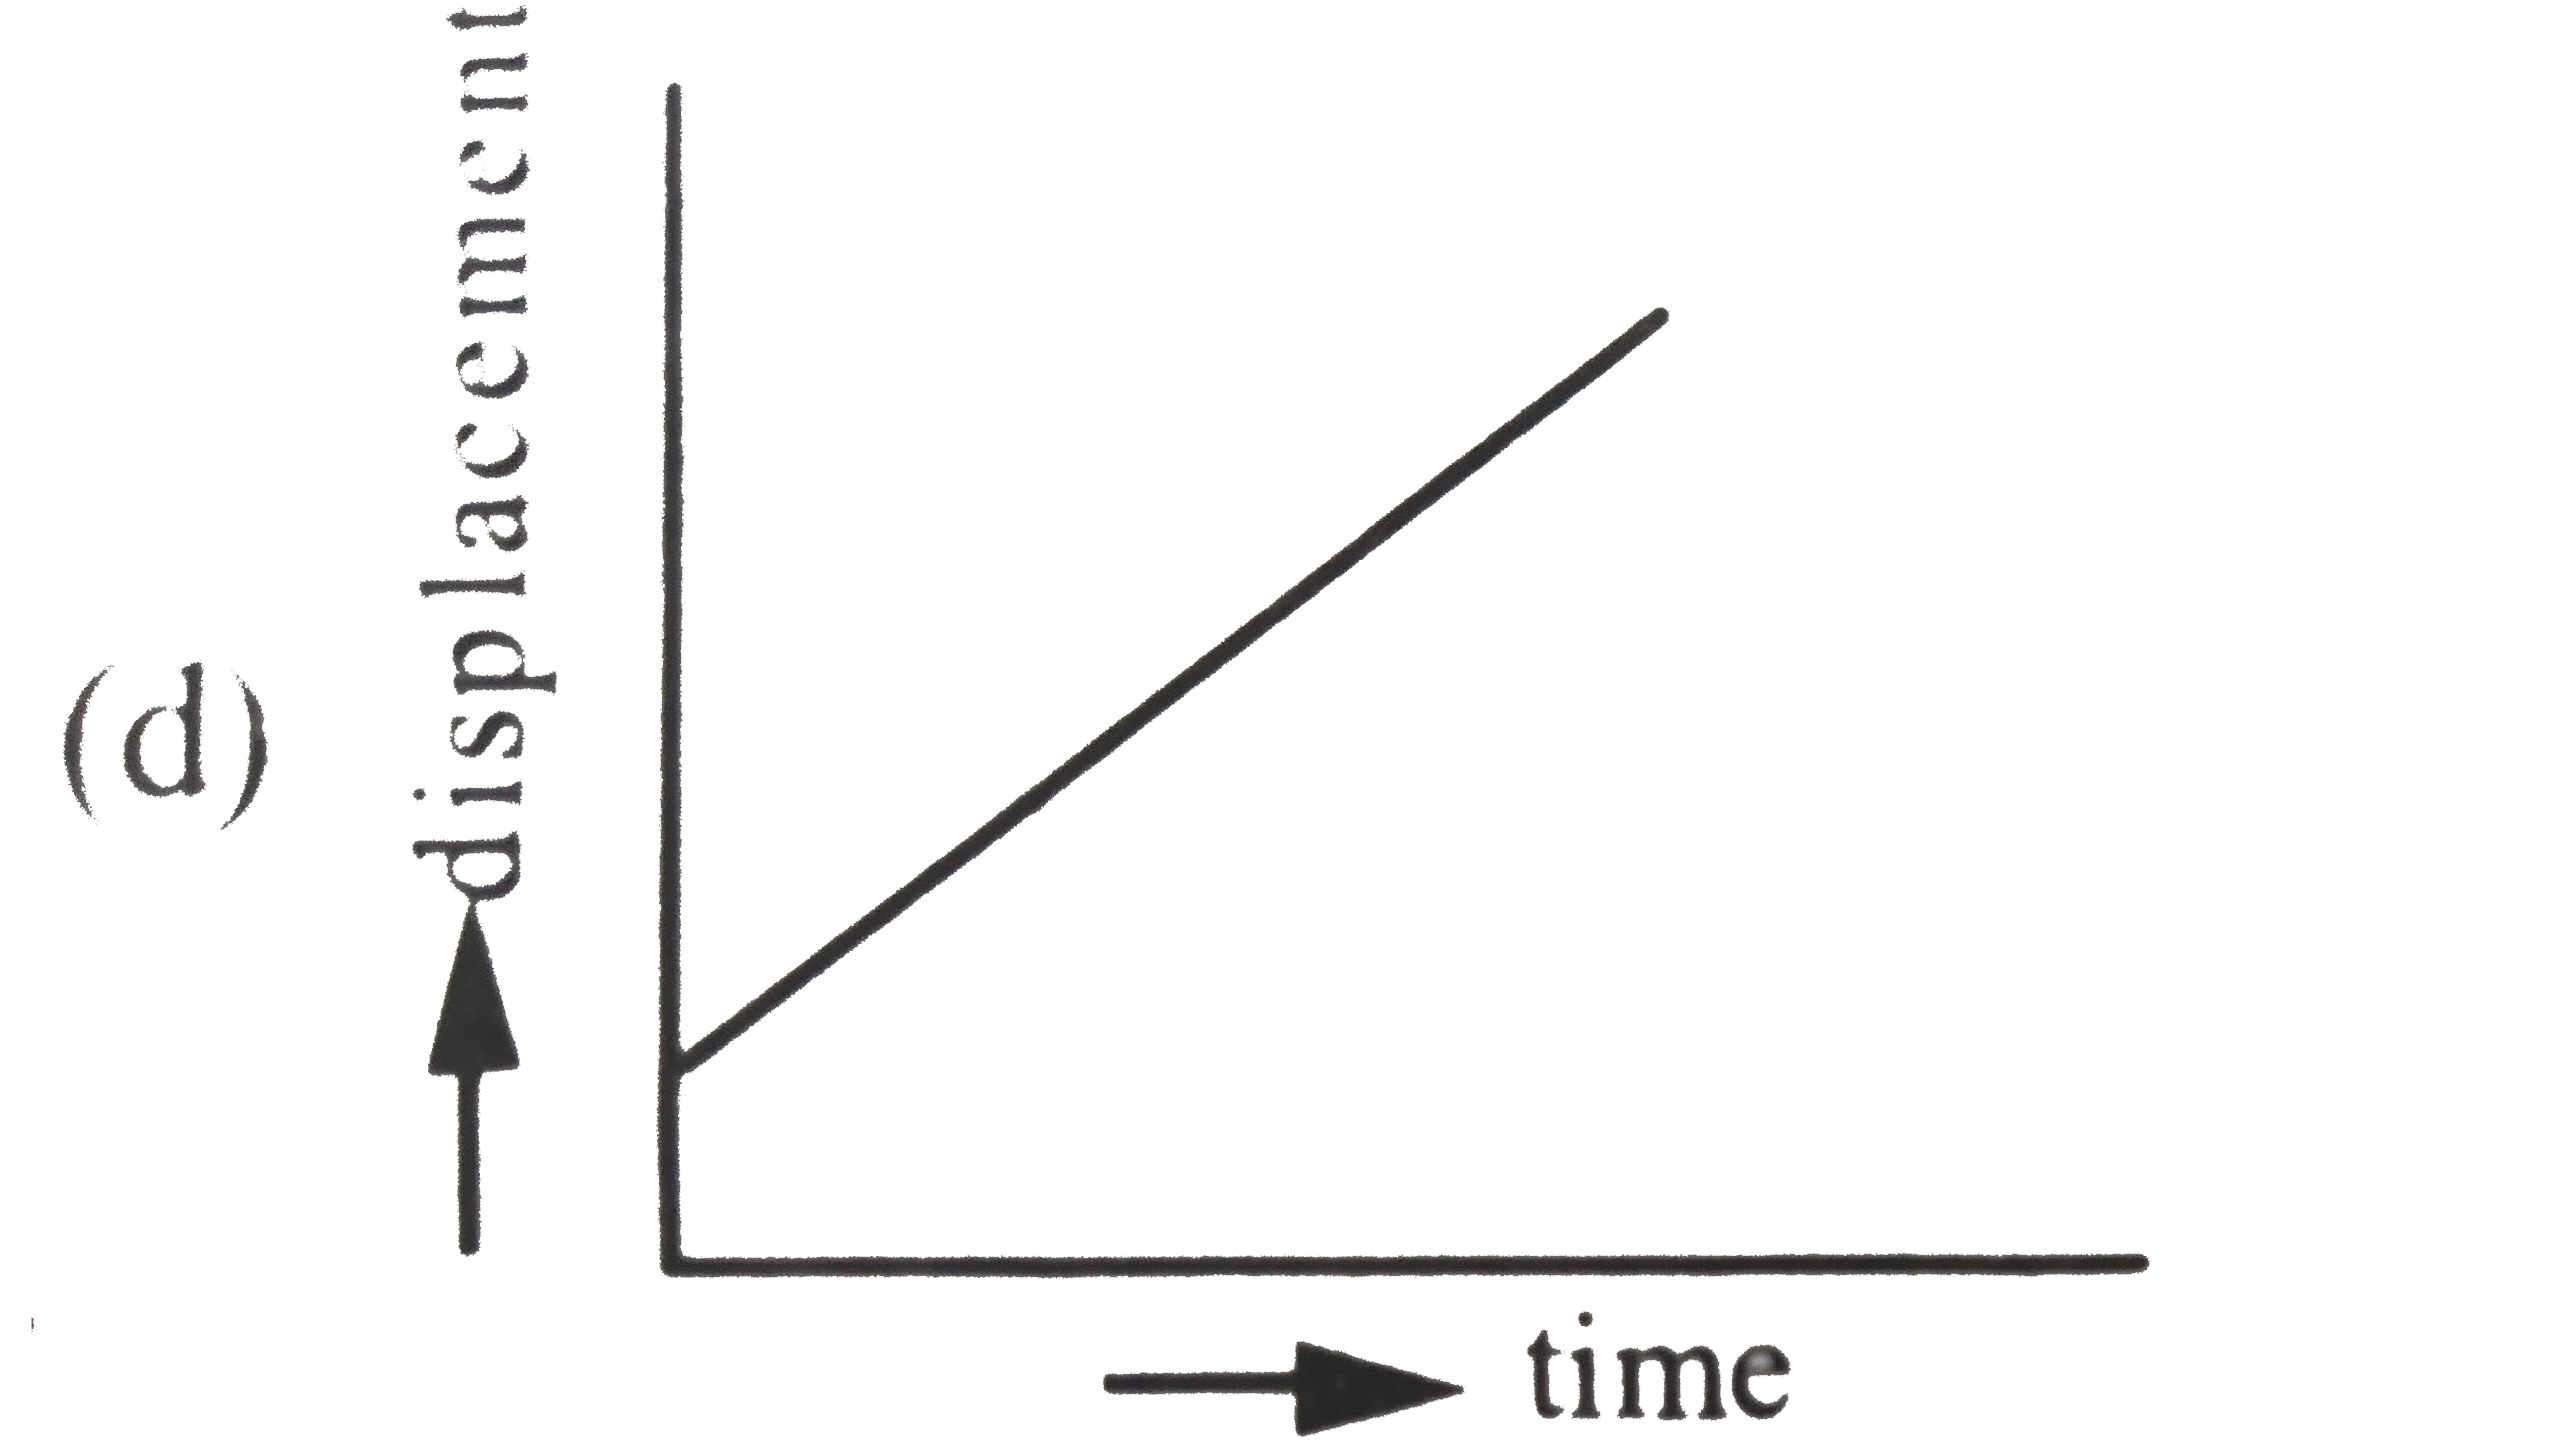
A survey asked a group of 1000 people what type of bread they like best. The table below shows their preferences.
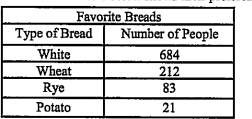
Which one of the following graphs best represents the data in this table?A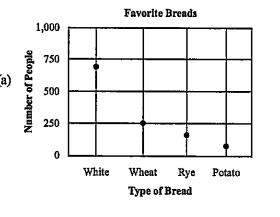 B
B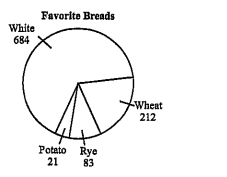 C
C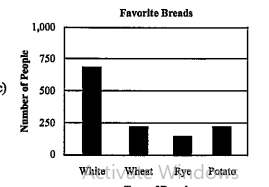 DNONE OF THESE
Which one of the following graphs best represents the ways in which the total power P radiated by a black body depends upon the thermodynamic temperature T of the body?
A B
B C
C D
D
Which one of the following best represents the graph of the function f(x)=Limn→∞2πtan−1(nx)
View Solution29. Which one of following best represents the graph of y=xlogxπ
View Solution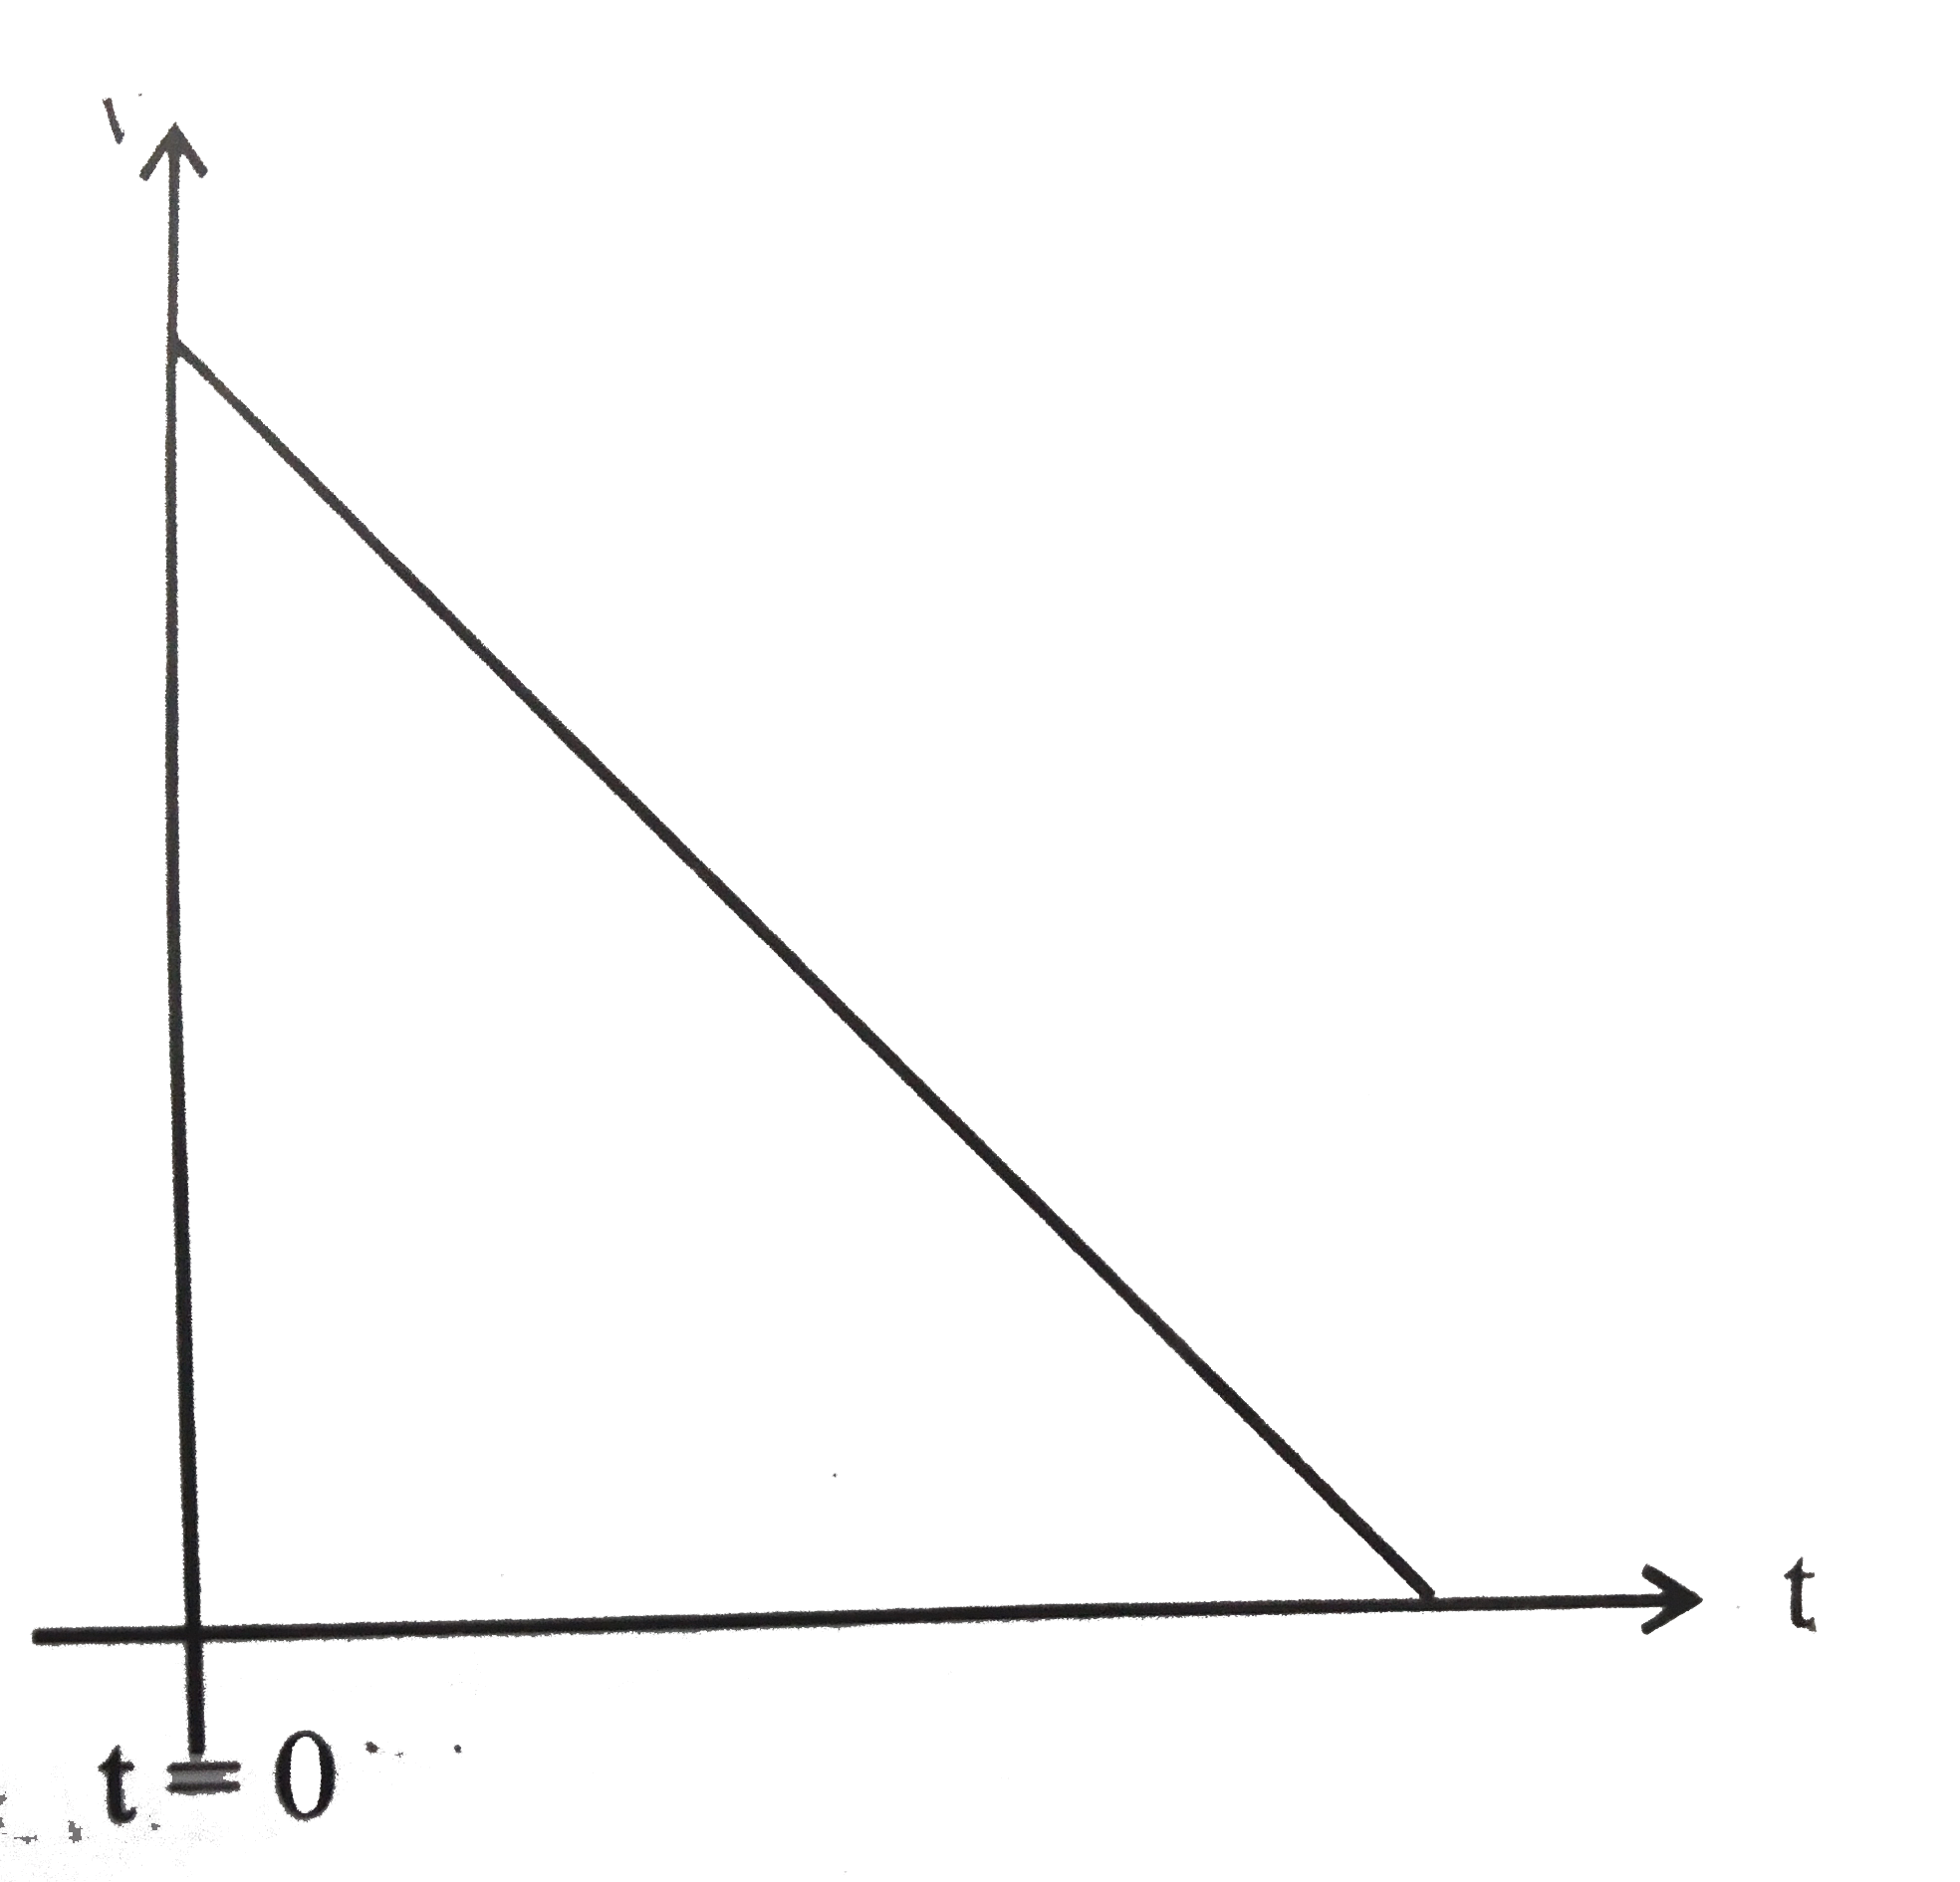
Which one among the following situation is best represented by the velocity - time plot shown above?
View SolutionThe graph shown the variation with times t of the velocity v of an object . Which one of the following graphs best represents the variation of acceleration a of the object with time t?

View SolutionIn the following questions a function is represented by the graph.
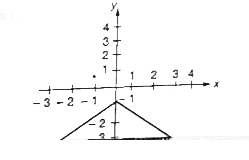
View Solution
