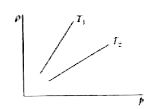
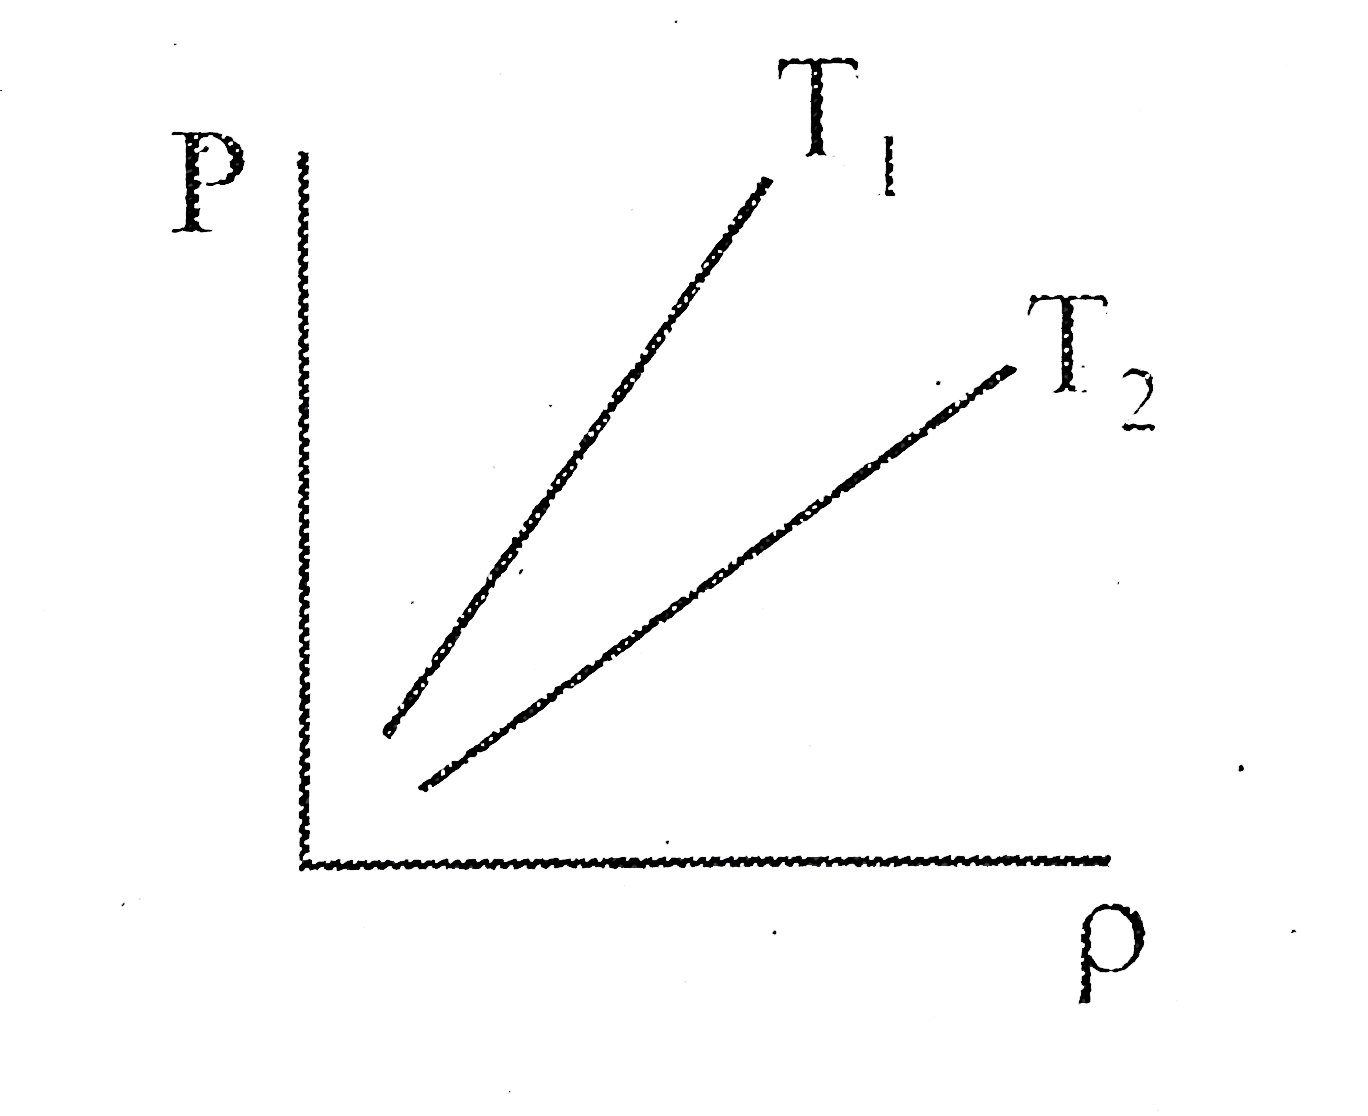
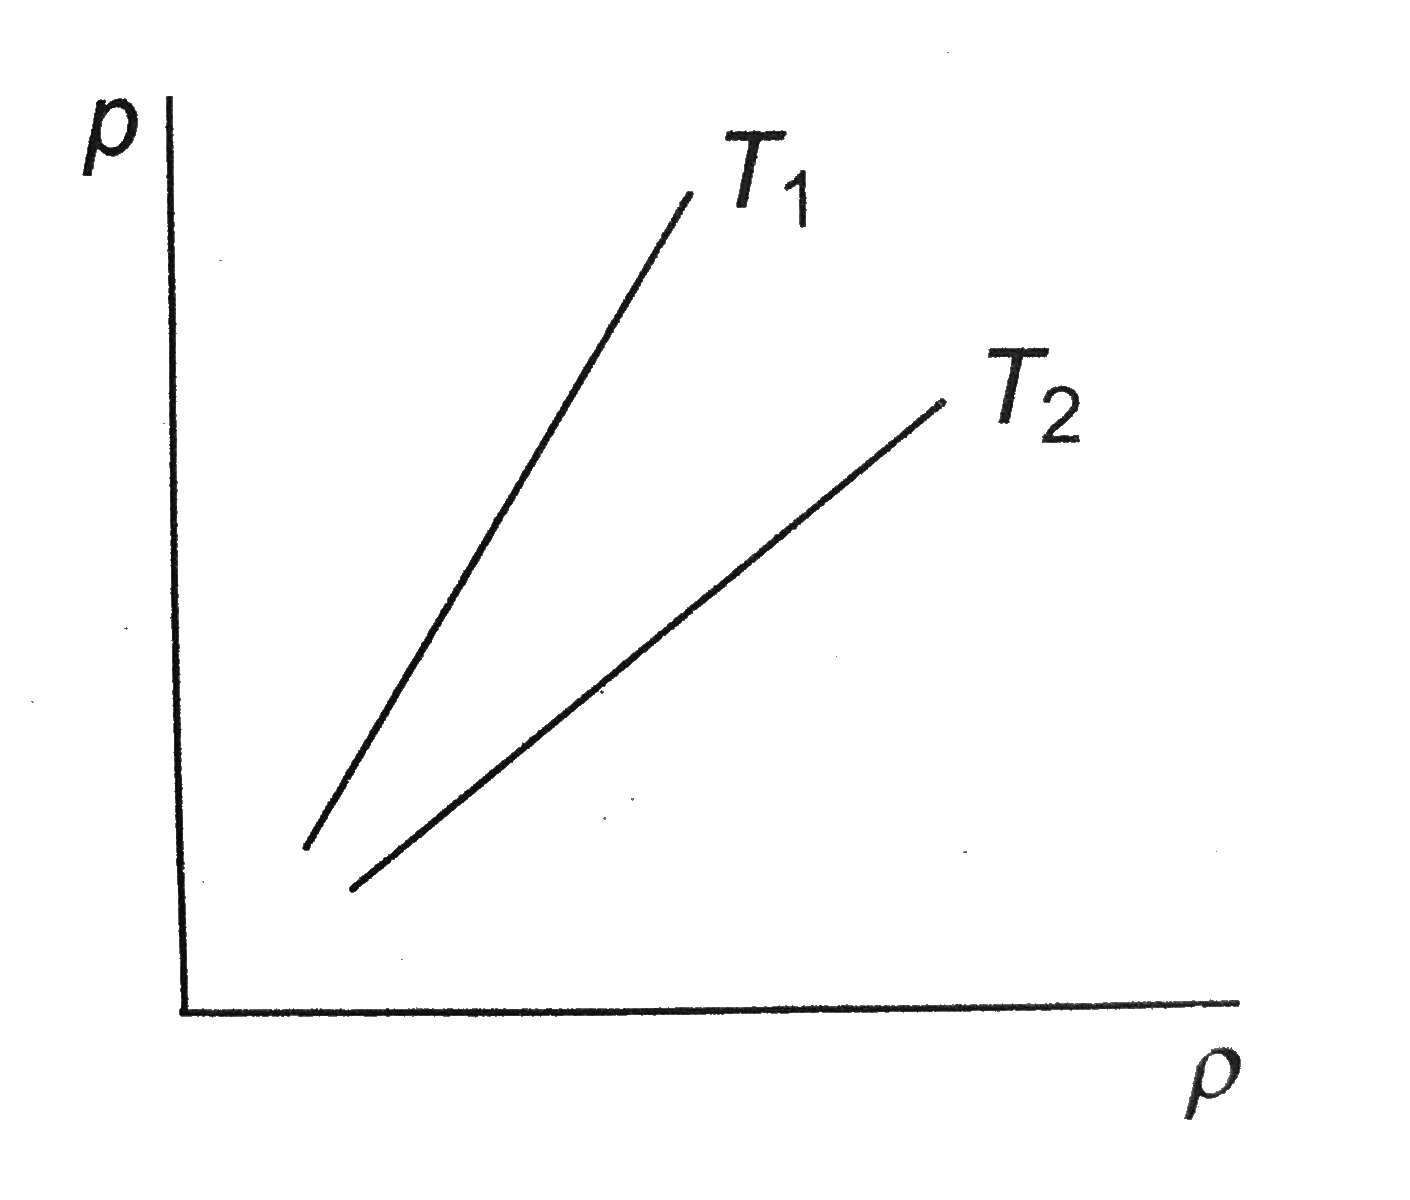
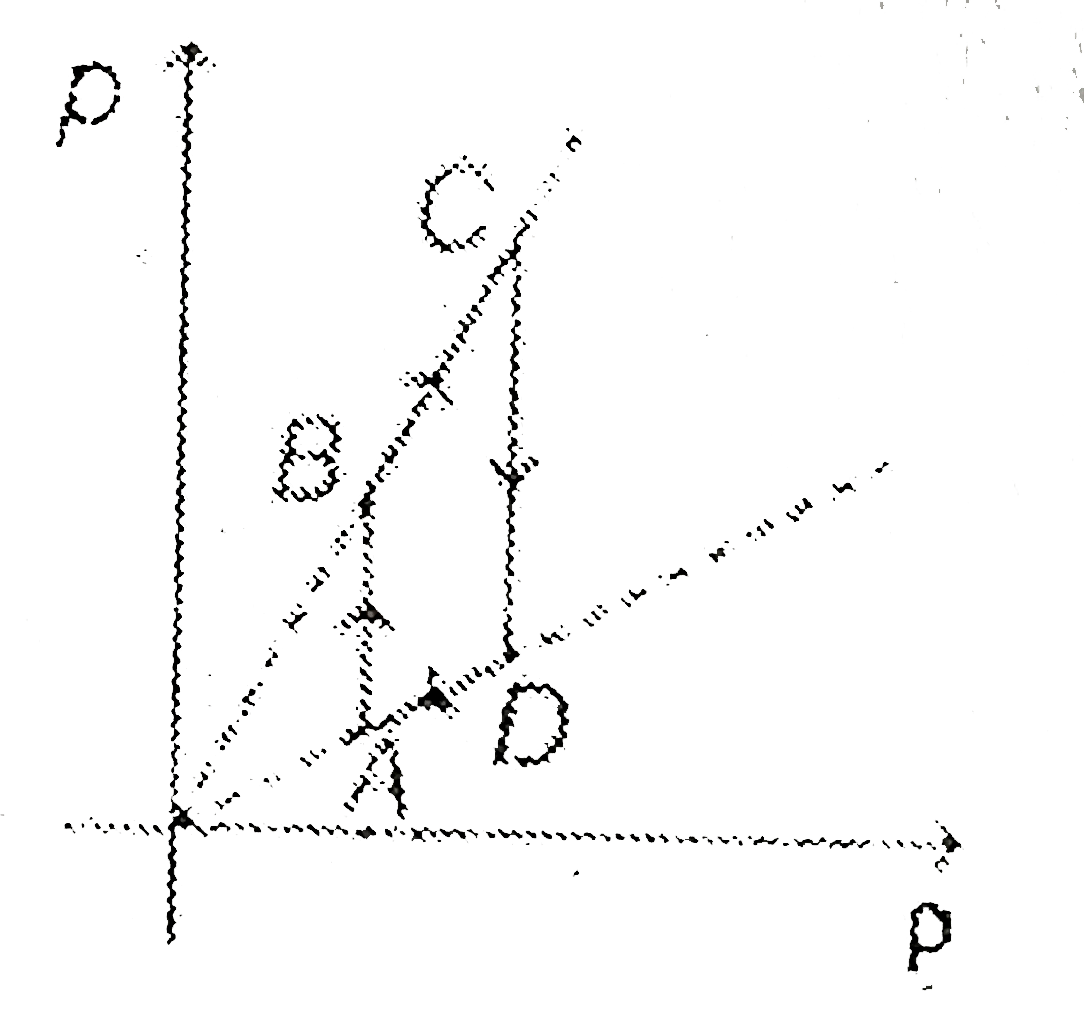
Figure shows graphs of pressure versus density for an ideal gas at two temperatures T1 and T2 Which is correct ?
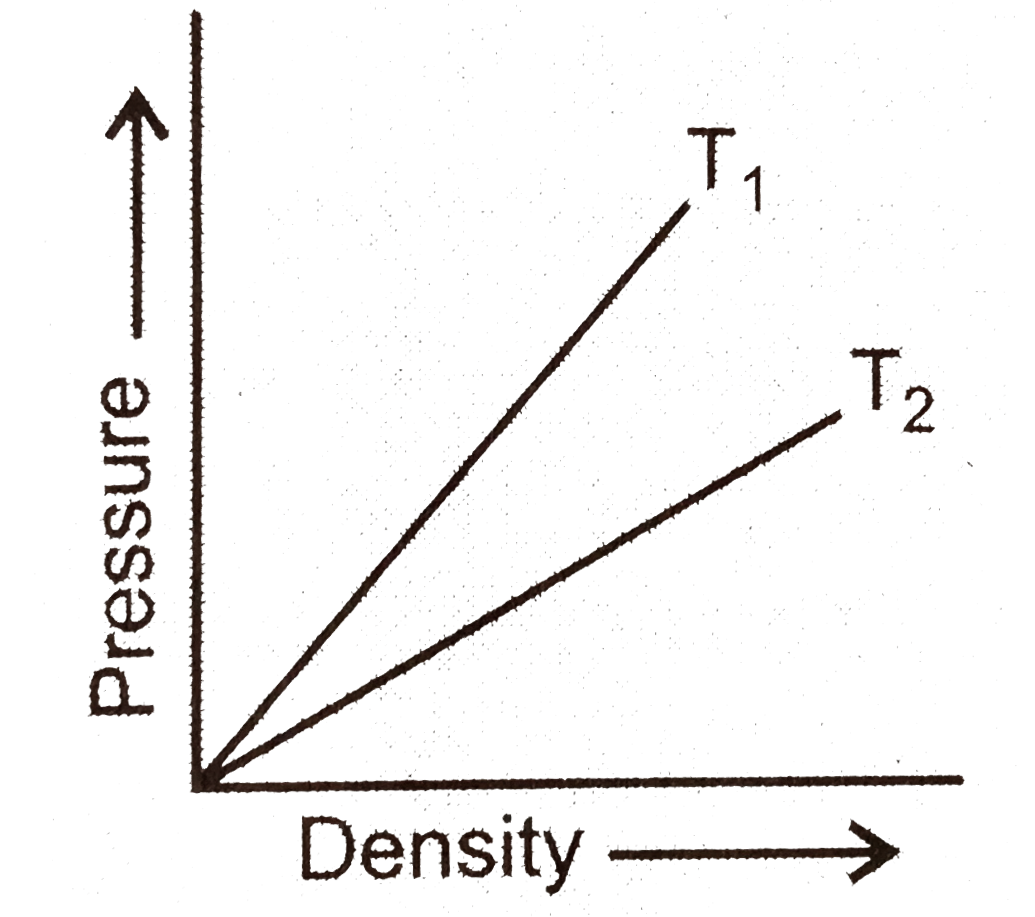 .
.
A
T1>T2
B
T2>T1
C
Both
D
None of these
Video Solution
Text Solution
UsePM=dRT .
|
Topper's Solved these Questions
- GASEOUS STATEBOOK - P BAHADURCHAPTER - GASEOUS STATEEXERCISE - Exercise B
1 Videos
- GASEOUS STATEBOOK - P BAHADURCHAPTER - GASEOUS STATEEXERCISE - Exercise 4
1 Videos
- GASEOUS STATEBOOK - P BAHADURCHAPTER - GASEOUS STATEEXERCISE - Exercise 3
1 Videos
- CHEMICAL EQUILIBRIUMBOOK - P BAHADURCHAPTER - CHEMICAL EQUILIBRIUMEXERCISE - Exercise
134 Videos
- IONIC EQUILIBRIUMBOOK - P BAHADURCHAPTER - IONIC EQUILIBRIUMEXERCISE - Exercise
85 Videos
Similar Questions
Knowledge Check
Figure shows graphs of pressure vs density for an ideal gas at two temperatures Tt and T2
AT1>T2BT1=T2CT1<T2Dany of the three is possibleShows graphs of pressure vs density for an ideal gas at two temperaturesT1andT2
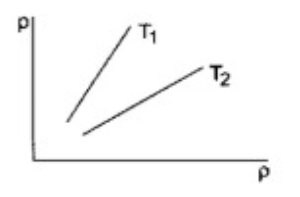 A(a)T1>T2B(b)T1=T2C(c)T1<T2D(d)Any of the three is possibe.
Figure shows graphs of pressure vs density for an ideal gas at two temperature T1andT2. Which of the following is correct?
 AT1>T2BT1=T2CT1<T2Dany of the three is possible
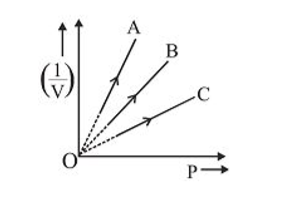
Figure shows the isotherms of fixed mass of an ideal gas at three temperatures TA.TB and TC then:-
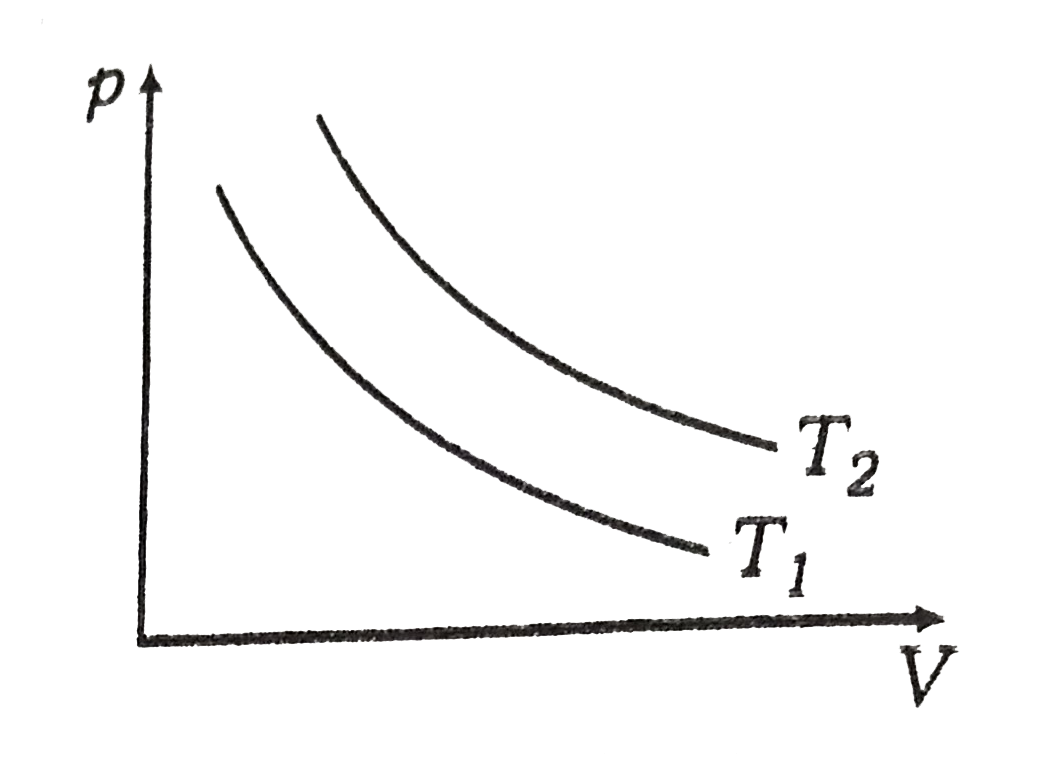
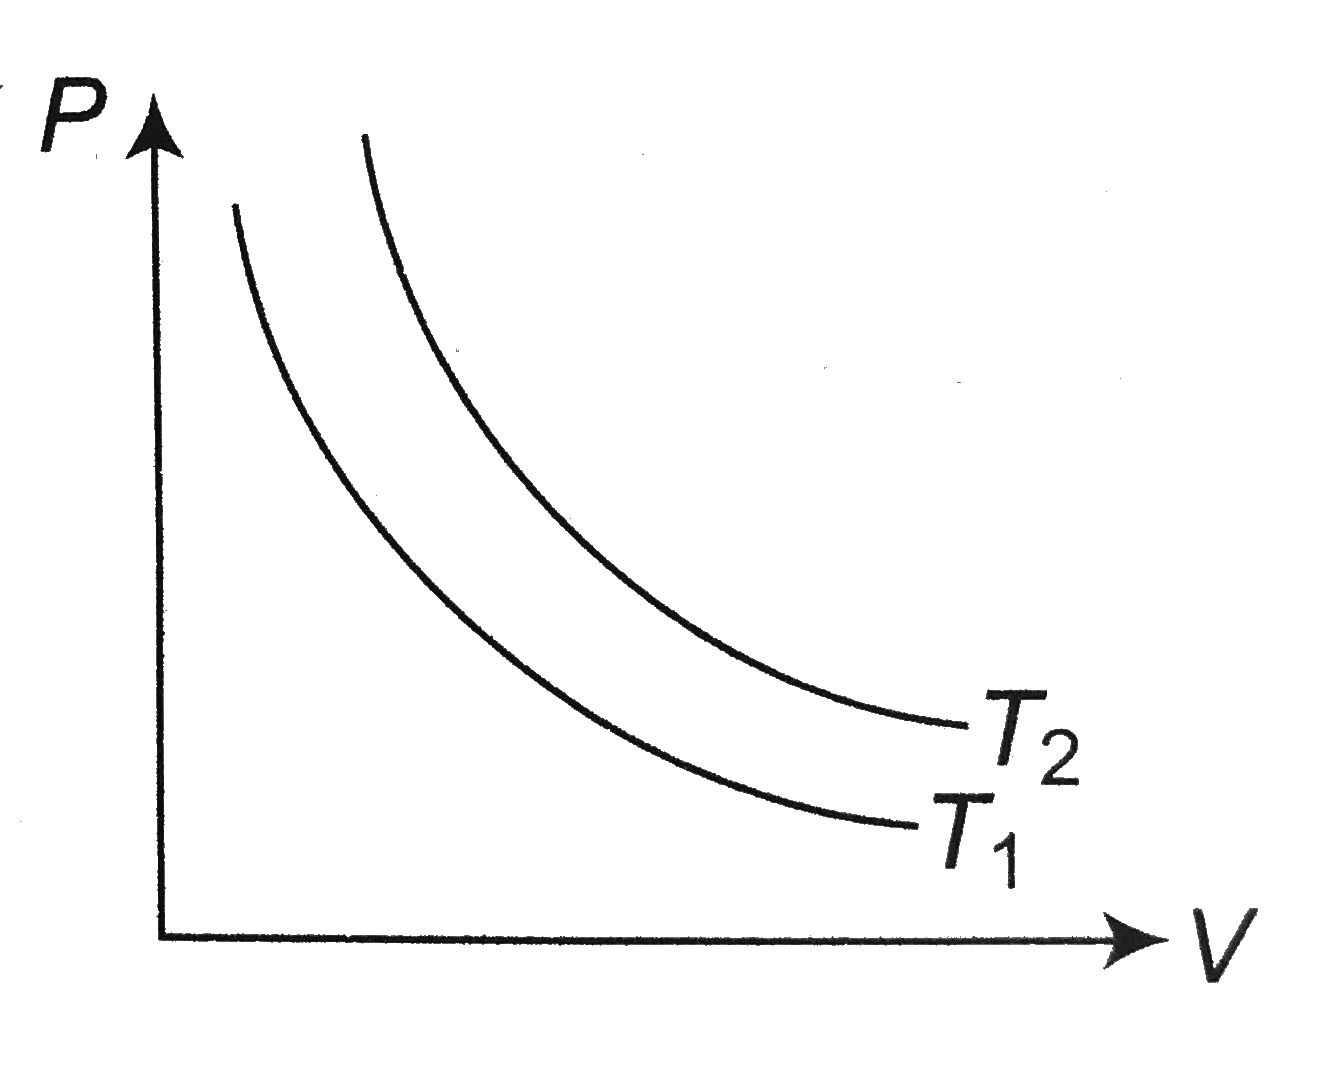
View SolutionThe adjoining fgure shows graph of pressure and volume of a gas at two temperatures T1 and T2 Which one the following is correct
View Solution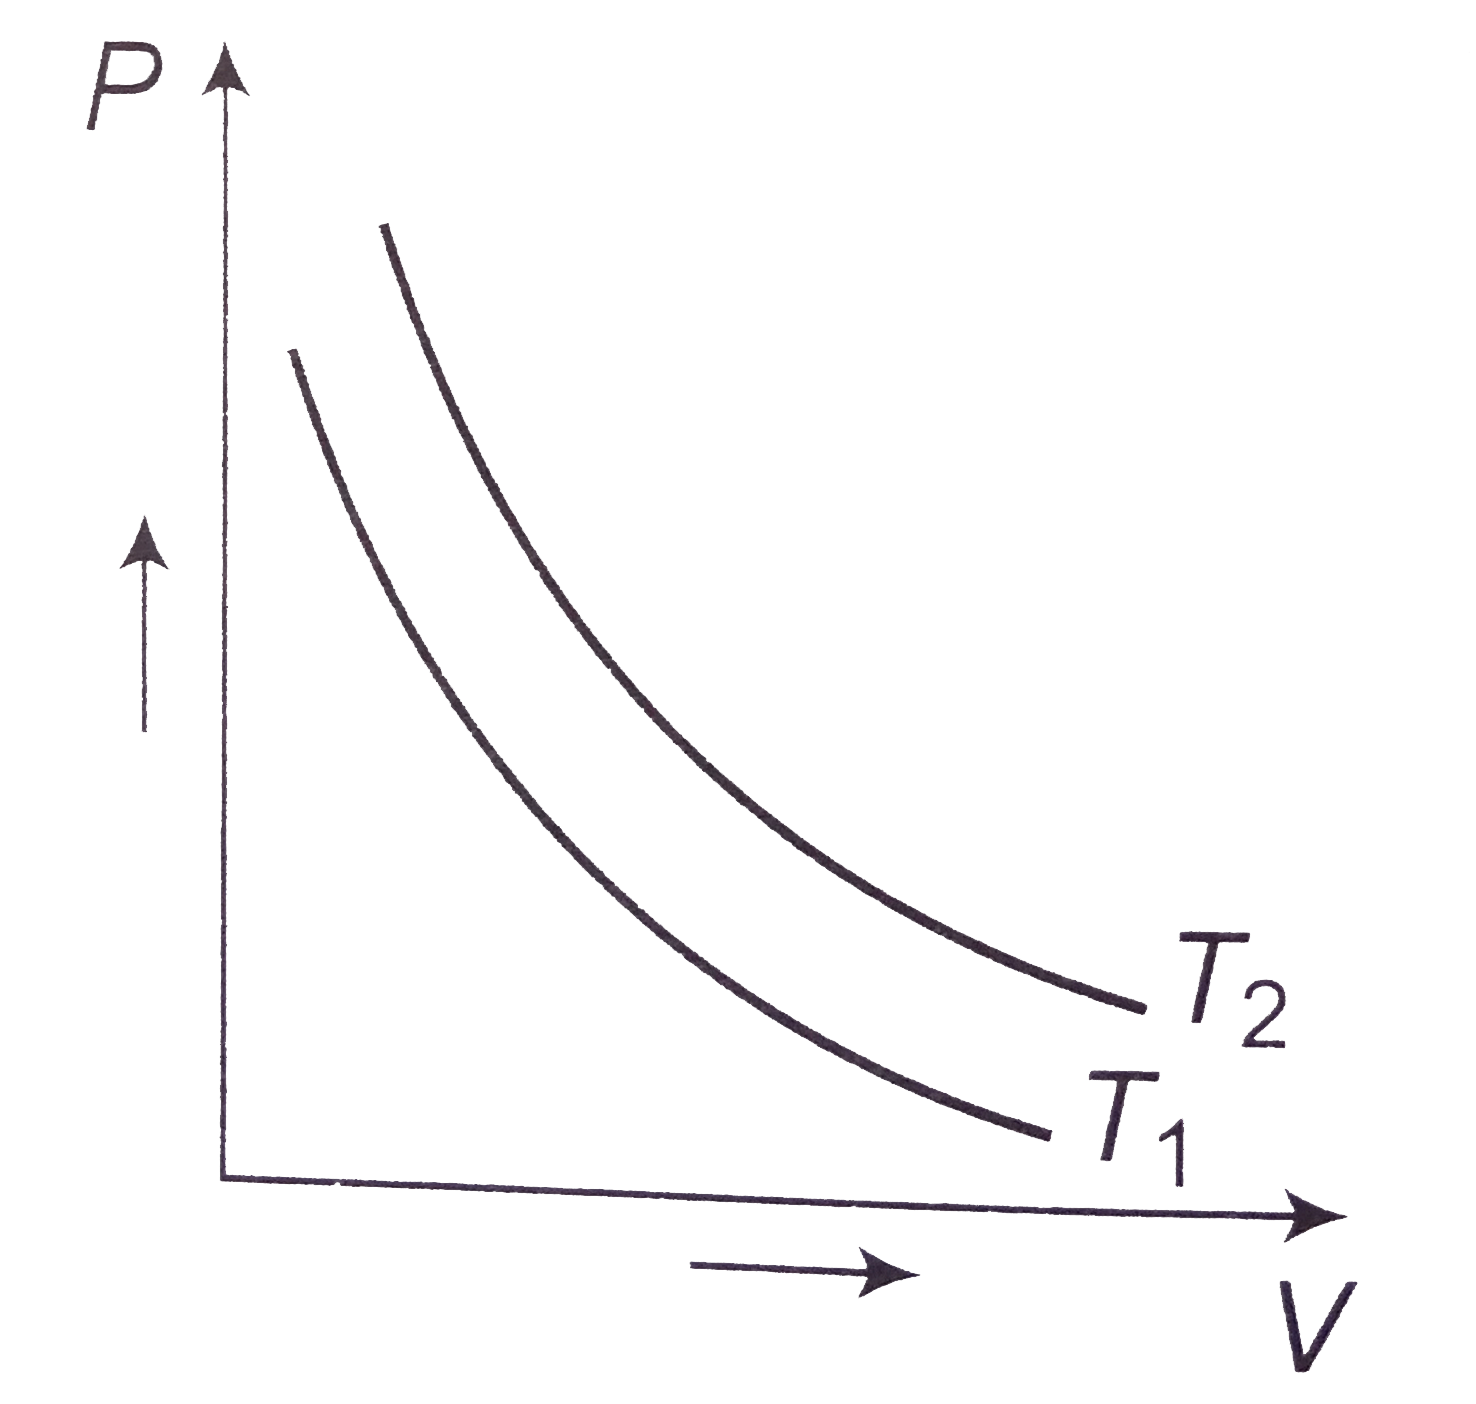
The adjoining figure shows graphs of pressure and volume of a gas at two temperature T1 and T2 Which of the following inferences is correct?
View SolutionPressure versus density graph of an ideal gas is shown in figure
View SolutionFigure shows the pressure P versus volume V graphs for a certains mass of a gas at two constant temperature T1andT2. Which of the following interface is correct?
View Solution

