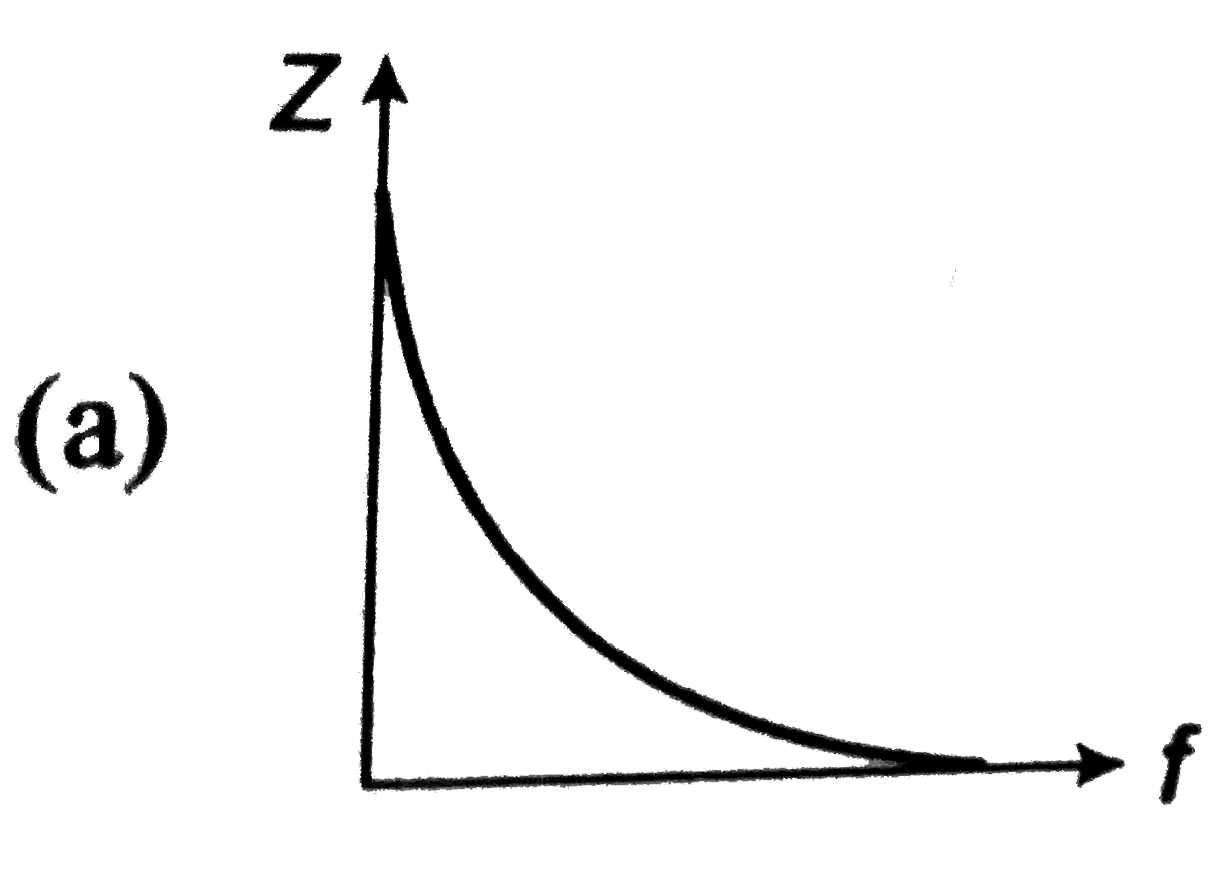
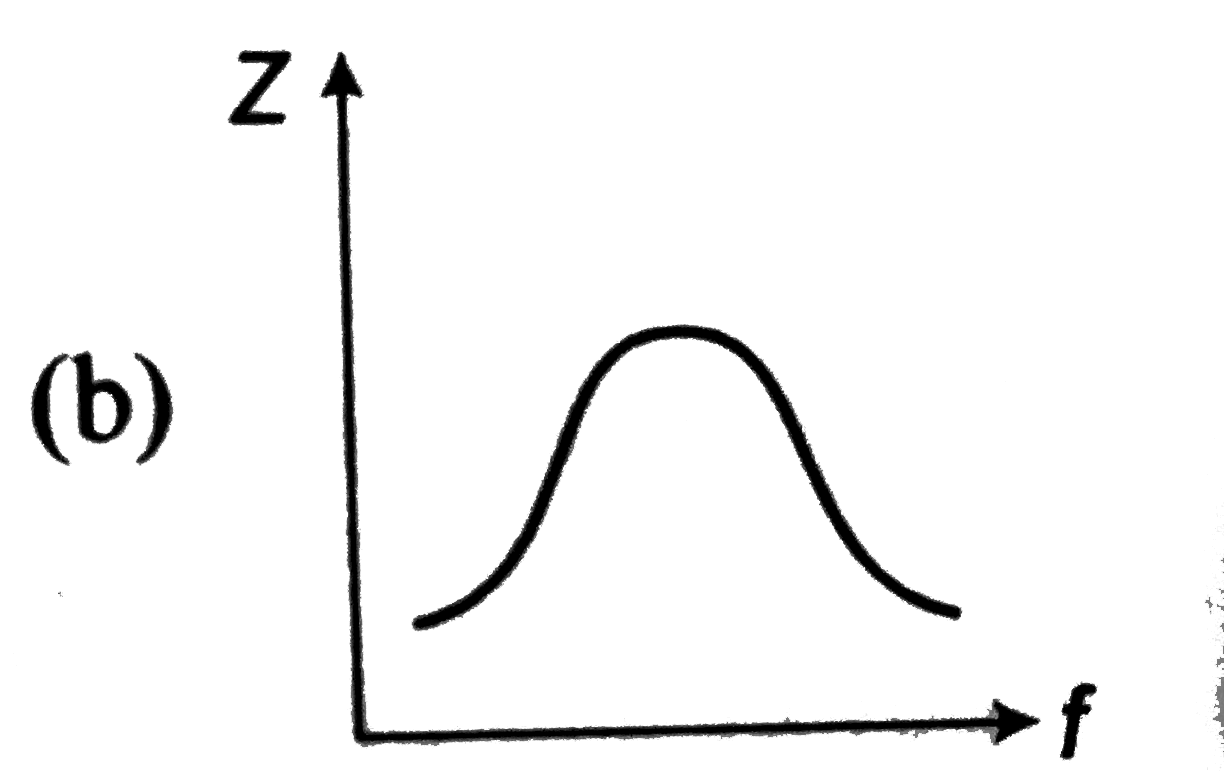
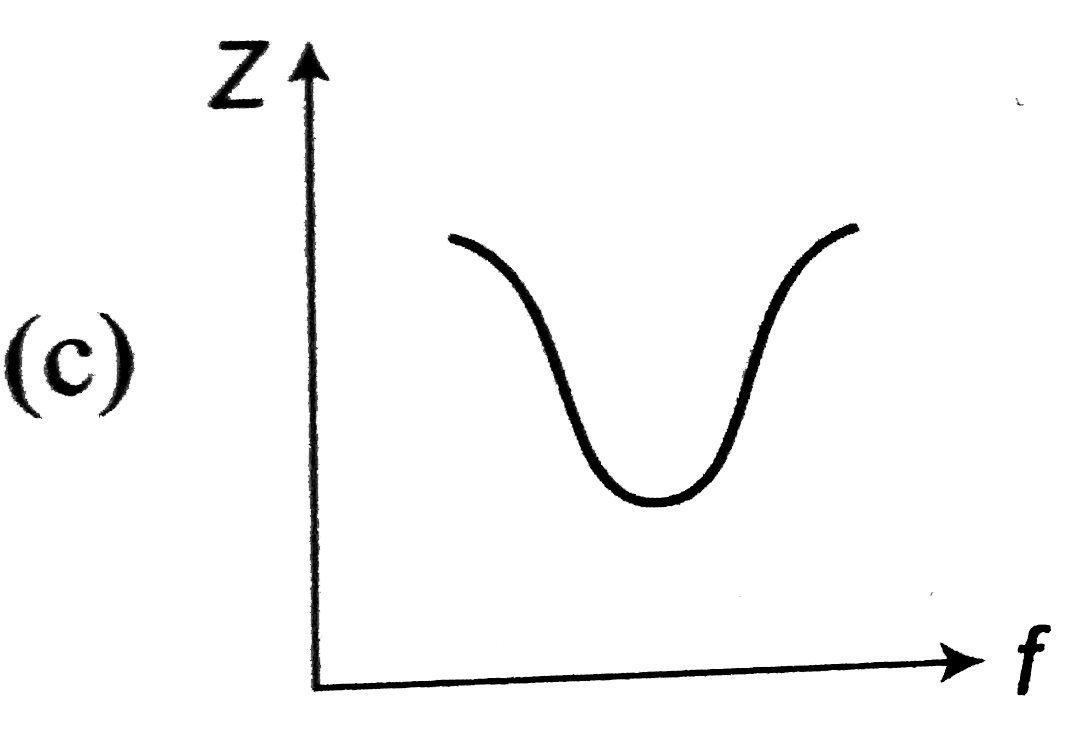
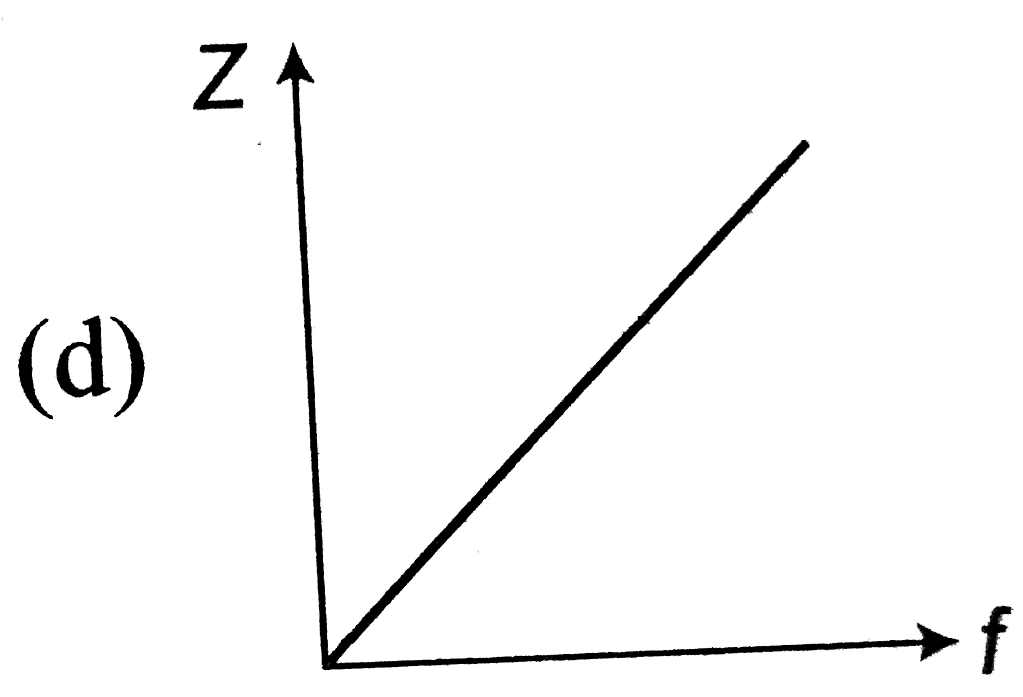
Which of the following curves represents the variation of impedance with frequency in series circuit?
A
B
C
D
Video Solution
Text Solution
The correct Answer is:C
From above equation at
When (resonant frequency)
For starts increasing.
i.e., for frequency decreases and for to increases. This is jsutified by graph .
|
Updated on:21/07/2023
Topper's Solved these Questions
- BOOK - A2ZCHAPTER - ALTERNATING CURRENTEXERCISE - Power In Ac Circuits21videos
ALTERNATING CURRENT
- BOOK - A2ZCHAPTER - ALTERNATING CURRENTEXERCISE - Problems Based On Mixed Concepts40videos
ALTERNATING CURRENT
- BOOK - A2ZCHAPTER - ALTERNATING CURRENTEXERCISE - Connected With Ac42videos
ALTERNATING CURRENT
- BOOK - A2ZCHAPTER - ATOMIC PHYSICSEXERCISE - Section D - Chapter End Test30videos
ATOMIC PHYSICS
Similar Questions
Knowledge Check
- Question 1 - Select One
Which of the following curves represents the variation of impedance (Z) with frequency f in series LCR circuit?
A B
B C
C D
D
- Question 2 - Select One
In a series LCR circuit
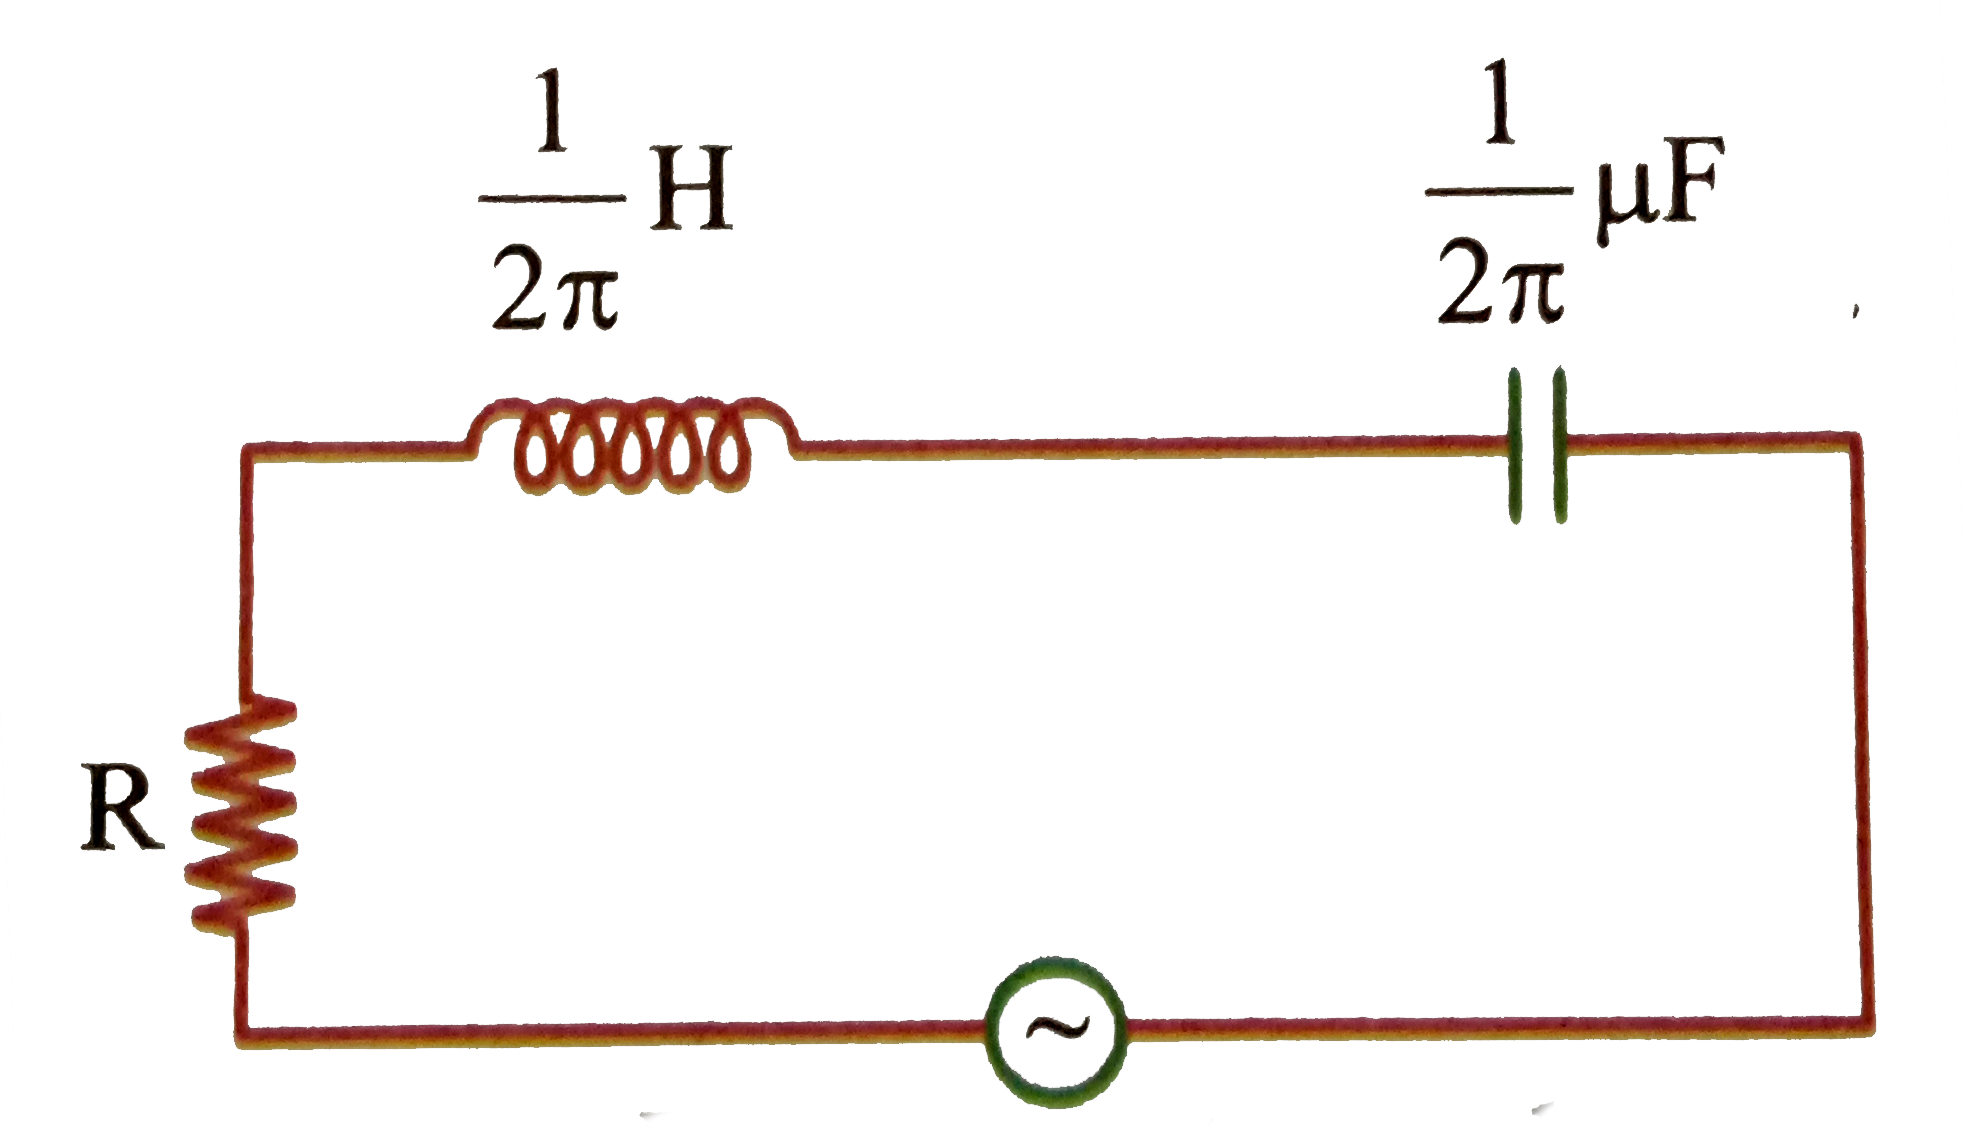 Athe voltage VL across the inductance leads the current in the circuit by a phase angle of π/2Bthe voltage VC across the capacitance lags behind the current by a phase angle of π/2Cthe voltage VR across the resistance is in phase with the currentDthe voltage across sereis combination of L, C and R is V=VL+VC+VR
 - Question 3 - Select One
Which of the following graphs represent the variation of current(I) with frequency (f) in an AC circuit containing a pure capacitor?
A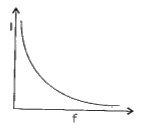 B
B C
C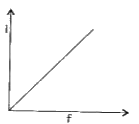 D
D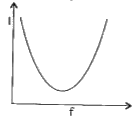
what is resonance in series LCR circuit ?
View SolutionSketch a graph that shows change in reactance with frequency of a series LCR circuit.
View SolutionAn a.c. source of variable angular frequency o is connected to an LCR series circuit. Which one of the following graphs correctly represents variation of impedance Zof a.c. circuit with angular frequency ω?
View SolutionAt resonance frequency the impedance in series LCR circuit is
View SolutionThe given curve represents the variation of temperatue as a function of volume for one mole of an ideal gas. Which of the following curves best represents the variation of pressure as a function of volume ?
(##DCP_V03_C20_E01_099_Q01##).View Solution
