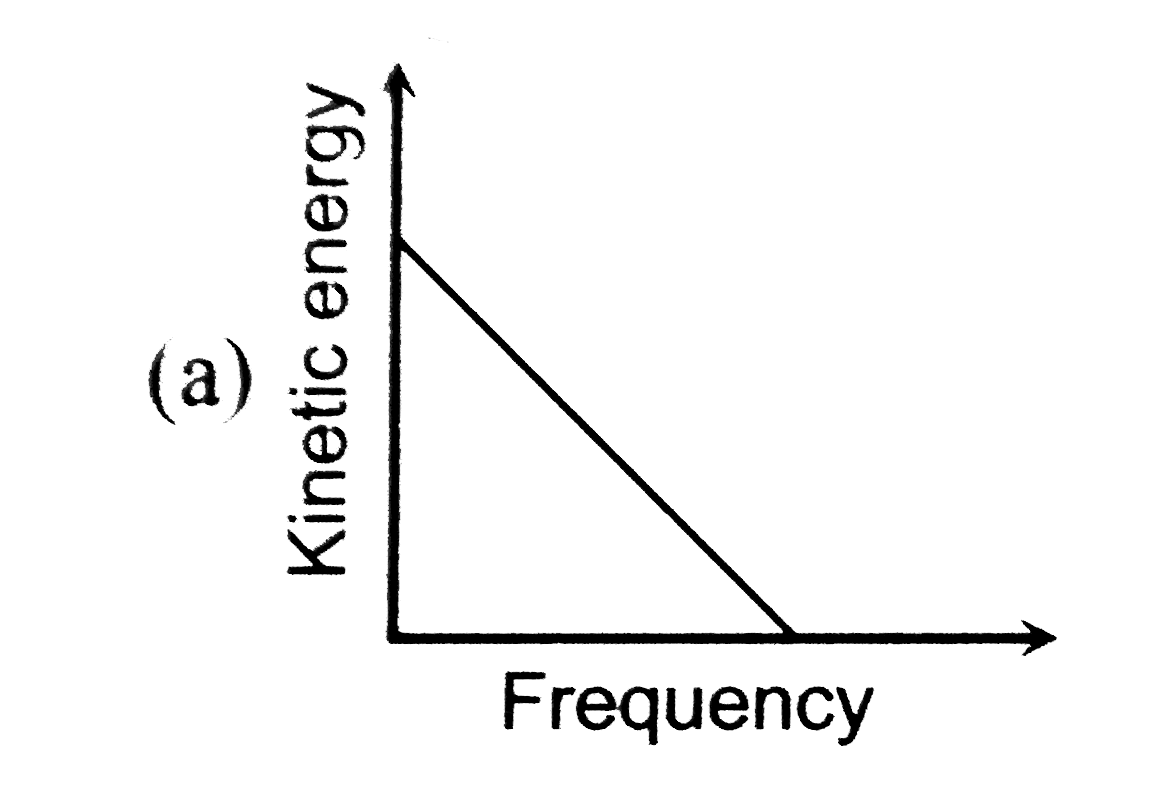
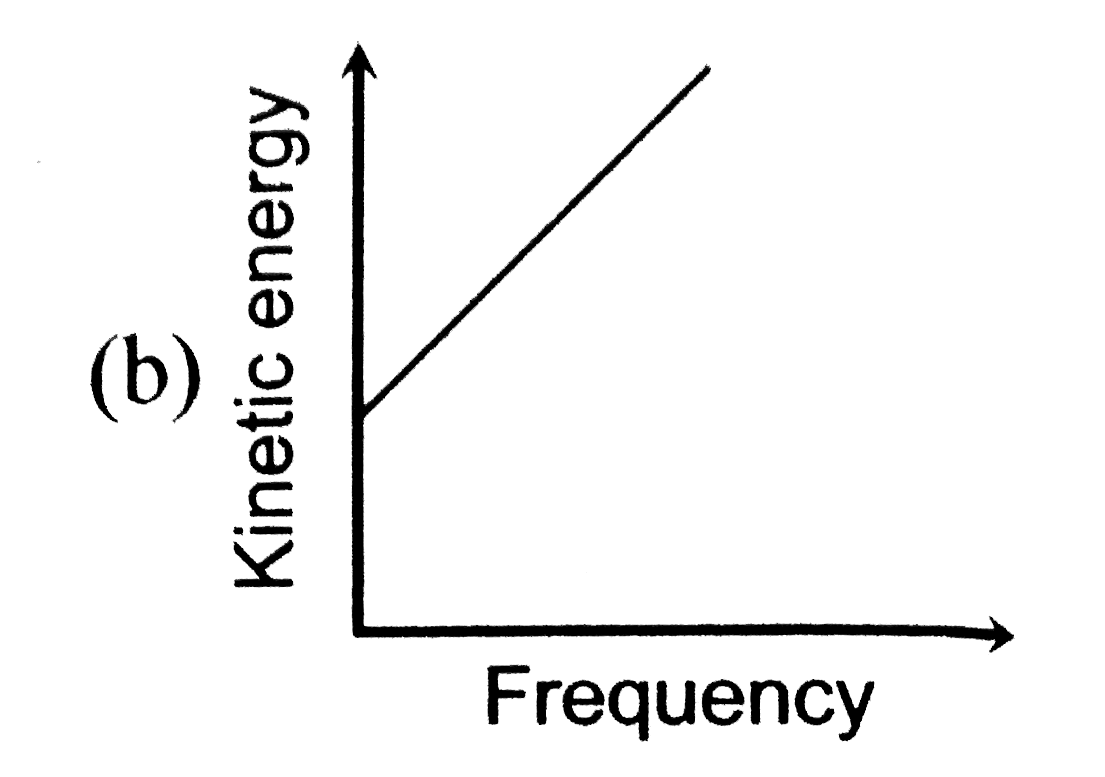
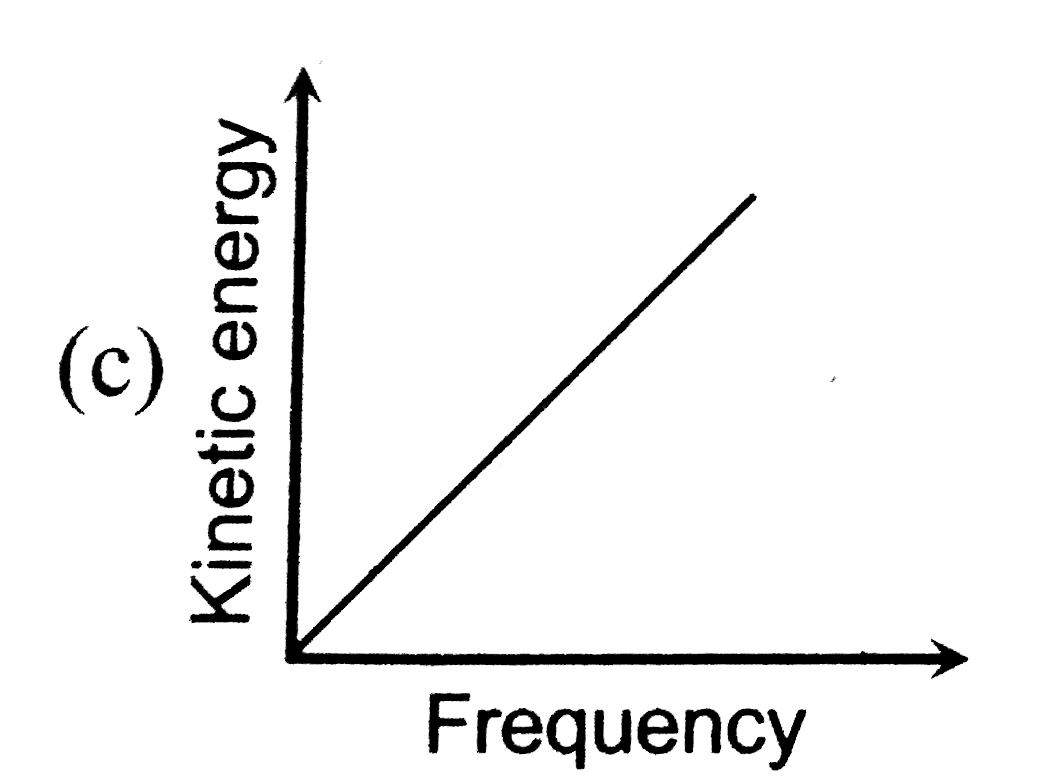
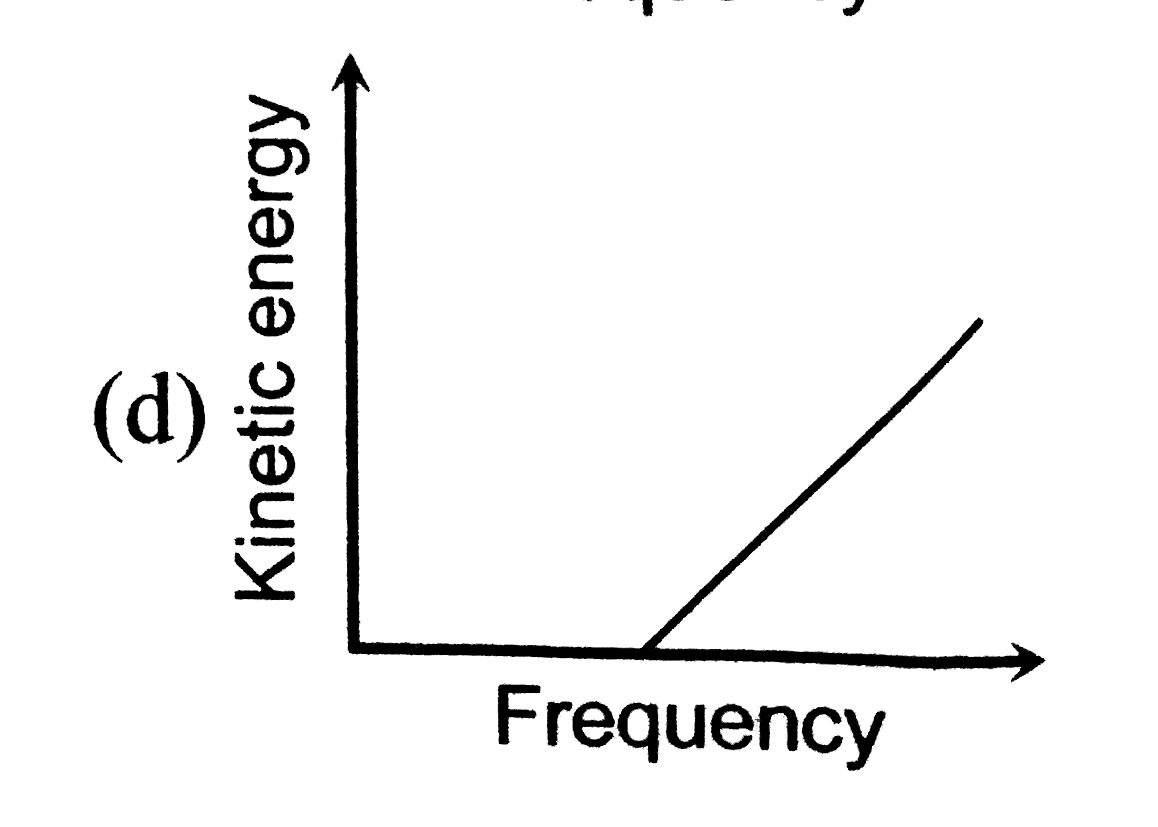
According to Einstein's photoelectric equation, the graph between the kinetic energy of photoelectrons ejected and the frequency of incident radiation is
The correct Answer is:D
To solve the problem regarding the graph between the kinetic energy of photoelectrons ejected and the frequency of incident radiation according to Einstein's photoelectric equation, we can follow these steps:
1. Understand Einstein's Photoelectric Equation:
The equation is given by:
Kmax=hν−ϕ
where Kmax is the maximum kinetic energy of the emitted photoelectrons, h is Planck's constant, ν is the frequency of the incident radiation, and ϕ is the work function of the material.
2. Rearranging the Equation:
We can rearrange the equation to express Kmax in terms of frequency:
Kmax=hν−ϕ
This shows that Kmax is directly proportional to the frequency of the incident radiation.
3. Identifying the Graph:
In the equation Kmax=hν−ϕ, we can interpret it as a linear equation of the form y=mx+c, where:
- y is Kmax
- x is ν
- m (the slope) is h
- c (the y-intercept) is −ϕ
4. Slope and Intercept:
- The slope m=h is positive since Planck's constant is a positive value.
- The y-intercept c=−ϕ is negative because the work function ϕ is a positive value representing the energy required to eject an electron.
5. Graph Characteristics:
- Since the slope is positive, the graph will be a straight line that rises as frequency increases.
- The line will intersect the y-axis below the origin due to the negative intercept.
6. Conclusion:
The graph of Kmax versus ν will be a straight line with a positive slope and a negative y-intercept. This indicates that as the frequency of the incident radiation increases, the kinetic energy of the emitted photoelectrons also increases linearly.
Final Answer:
The graph between the kinetic energy of photoelectrons ejected and the frequency of incident radiation is a straight line with a positive slope and a negative y-intercept.
---
The equation is given by:
Kmax=hν−ϕ
where Kmax is the maximum kinetic energy of the emitted photoelectrons, h is Planck's constant, ν is the frequency of the incident radiation, and ϕ is the work function of the material.
We can rearrange the equation to express Kmax in terms of frequency:
Kmax=hν−ϕ
This shows that Kmax is directly proportional to the frequency of the incident radiation.
In the equation Kmax=hν−ϕ, we can interpret it as a linear equation of the form y=mx+c, where:
- y is Kmax
- x is ν
- m (the slope) is h
- c (the y-intercept) is −ϕ
- The slope m=h is positive since Planck's constant is a positive value.
- The y-intercept c=−ϕ is negative because the work function ϕ is a positive value representing the energy required to eject an electron.
- Since the slope is positive, the graph will be a straight line that rises as frequency increases.
- The line will intersect the y-axis below the origin due to the negative intercept.
The graph of Kmax versus ν will be a straight line with a positive slope and a negative y-intercept. This indicates that as the frequency of the incident radiation increases, the kinetic energy of the emitted photoelectrons also increases linearly.
The graph between the kinetic energy of photoelectrons ejected and the frequency of incident radiation is a straight line with a positive slope and a negative y-intercept.
Topper's Solved these Questions
- DUAL NATURE OF RADIATION AND MATTERBOOK - A2ZCHAPTER - DUAL NATURE OF RADIATION AND MATTEREXERCISE - X-Rays
45 Videos
- DUAL NATURE OF RADIATION AND MATTERBOOK - A2ZCHAPTER - DUAL NATURE OF RADIATION AND MATTEREXERCISE - Problems Based On Mixed Concepts
42 Videos
- DUAL NATURE OF RADIATION AND MATTERBOOK - A2ZCHAPTER - DUAL NATURE OF RADIATION AND MATTEREXERCISE - Photo Momentum Energy
30 Videos
- CURRENT ELECTRICITYBOOK - A2ZCHAPTER - CURRENT ELECTRICITYEXERCISE - Section D - Chapter End Test
29 Videos
- ELECTRIC CHARGE, FIELD & FLUXBOOK - A2ZCHAPTER - ELECTRIC CHARGE, FIELD & FLUXEXERCISE - Section D - Chapter End Test
29 Videos
Similar Questions
Knowledge Check
The graph between the energy of photoelectrons E and the wavelength of incident light (λ) is
A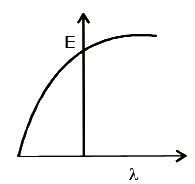 B
B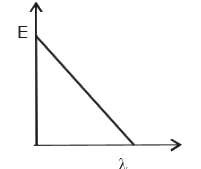 C
C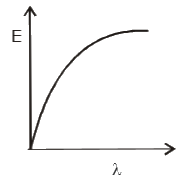 D
D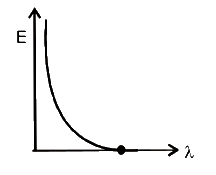
According to Einstein's photoelectric equation, the plot of the maximum kinetic energy of the emitted photoelectrons from a metal versus frequency of the incident radiation gives a straight line whose slope
Adepends on the nature of metal usedBdepends on the intensity or radiationCdepends on both intensity of radiation and the nature of metal usedDis the same for all metals and independent of the instensity or radiationAccording to Einstein's photoelectric equation (symbols have their usual meaning)
Ahv−ϕ=(KE)maxBhv>(KE)maxCϕ=hv+(KE)max2Dϕ=(KE)max−hv2
Does the kinetic energy of photoelectrons depend on the intensity of incident radiations?
View SolutionHow does kinetic energy of ejected photoelectrons depend upon the frequency of incident radiation?
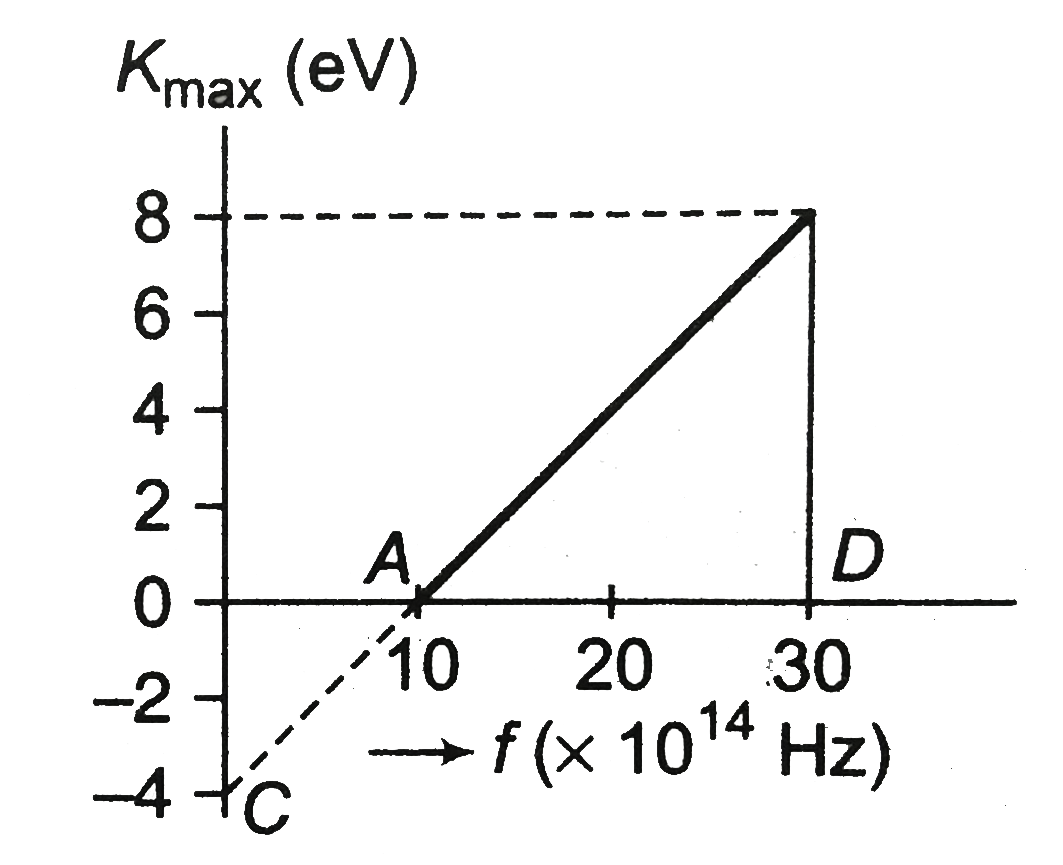
View SolutionA graph regarding photoelectric effect is shown between the maximum kinetic energy of electrons and the frequency of the incident light. On the basis of data as shown in the graph, calculate (a) threshold frequency , (b) work- function, (c ) planck constant
View SolutionMaximum kinetic energy (Ek) of a photoelectron varies with the frequency (v) of the incident radiation as
View SolutionAccording to Einstein's photoelectric equjation , the plot of the kinetic energy of the incident radaiation given as straight the whose used slope
View Solution
