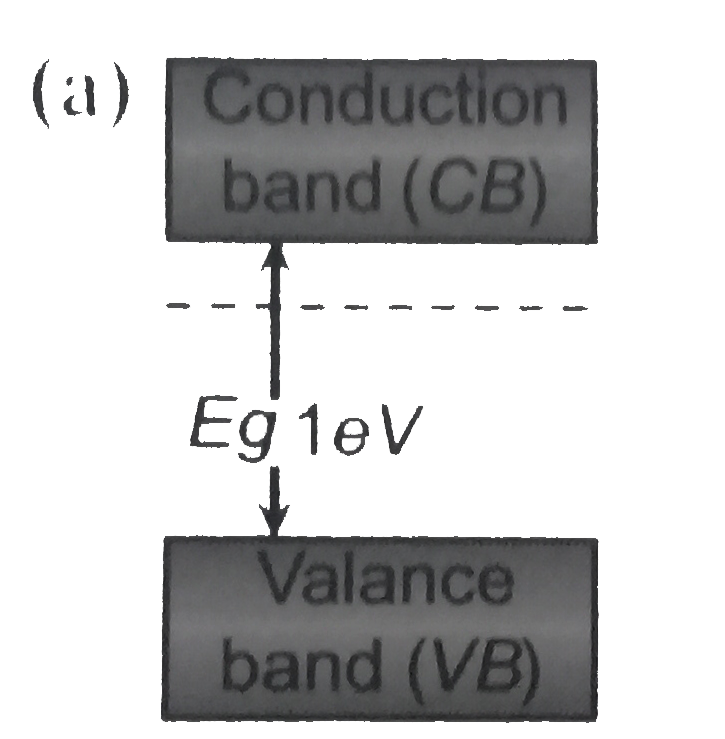
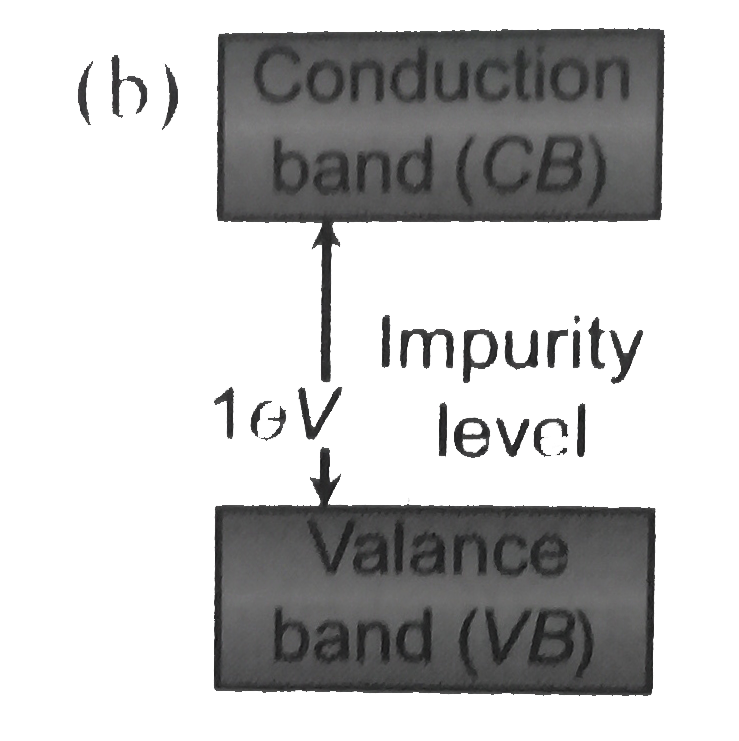
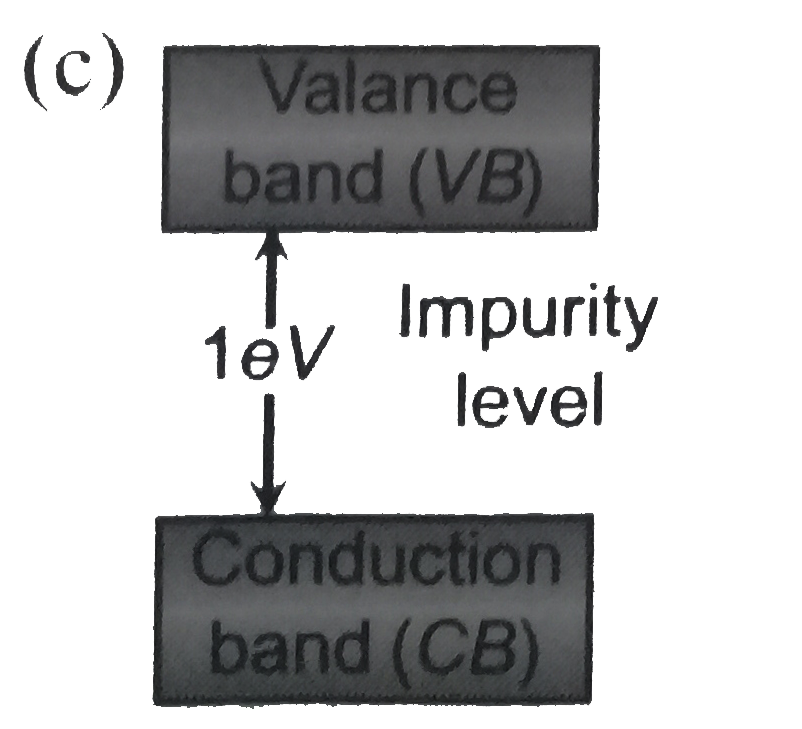
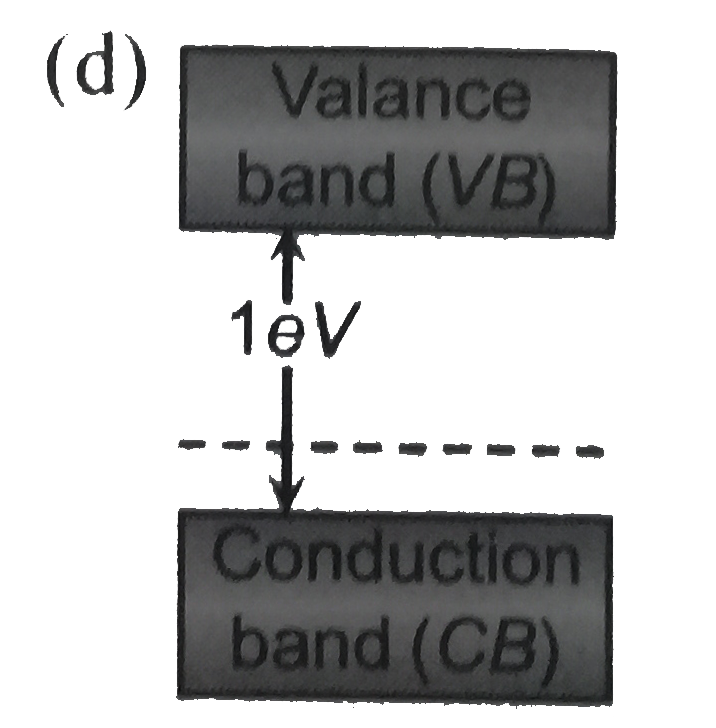
The energy band diagrams for three semiconductor samples of silicon are as shown. We can then assert that

Sample X is undopped while samples Y and Z have been dopped with the thirtd group and a fifth group impurity respectively
Sample X is undopped while both Y and Z have been dopped with the fifth group impurity
Sample X has been dopped with equal amount of third and fifth group impurities while sample Y and Z are undopped
Sample X is undopped while samples Y and Z have been dopped with the fifth group and a third group impurity respectively
The correct Answer is:D
In sample x no impurity level seen, so it is undoped. In sample y impurity energy level lies below the conduction band so it is dopped with fifth group impurity. In sample z, impurity energy level lies above the valence band so it is dopped with third group impurity.
Topper's Solved these Questions
- BOOK - A2ZCHAPTER - SEMICONDUCTOR ELECTRONICSEXERCISE - Junction Diode57videos
SEMICONDUCTOR ELECTRONICS
- BOOK - A2ZCHAPTER - SEMICONDUCTOR ELECTRONICSEXERCISE - Diode In Circuits40videos
SEMICONDUCTOR ELECTRONICS
- BOOK - A2ZCHAPTER - SEMICONDUCTOR ELECTRONICSEXERCISE - EXERCISE29videos
SEMICONDUCTOR ELECTRONICS
- BOOK - A2ZCHAPTER - NUCLEAR PHYSICSEXERCISE - Section D - Chapter End Test29videos
NUCLEAR PHYSICS
- BOOK - A2ZCHAPTER - SOURCE AND EFFECT OF MAGNETIC FIELDEXERCISE - Section D - Chapter End Test30videos
SOURCE AND EFFECT OF MAGNETIC FIELD
Similar Questions
Knowledge Check
- Question 1 - Select One
Which of the following energy band diagrams shows the N-type semiconductor?
A B
B C
C D
D
- Question 2 - Select One
The correct energy band responsible of intrinsic semiconductor at temperature 0 k is
A B
B C
C D
D
Draw the "energy bands" diagram for a (i) pure semiconductor (ii) insulator. How does the energy band, foe a pure semiconductor, get affected when this semiconductor is doped with an acceptor impurity donor impurity? Hence discuss why the 'holes' and the 'electrons' respectively, become the 'majority charge carriers' in these two cases.
View SolutionDraw the energy band diagram of a p-type semiconductor. Deduce an expression for the conductivity of a p-type semiconductor.
View SolutionDraw the energy band diagram of a n-type semiconductor. Deduce an expression for conductivity of a n-type semiconductor.
View SolutionDraw the energy band diagram of a n-type semiconductor. Deduce an expression for conductivity of a n-type semiconductor.
View SolutionDraw energy band diagram of p and n type semiconductors. Also write two difference between p and n type semiconductors.
View SolutionIn energy band diagram, the energy gap for carbon (diamond)is....... .
View Solution

