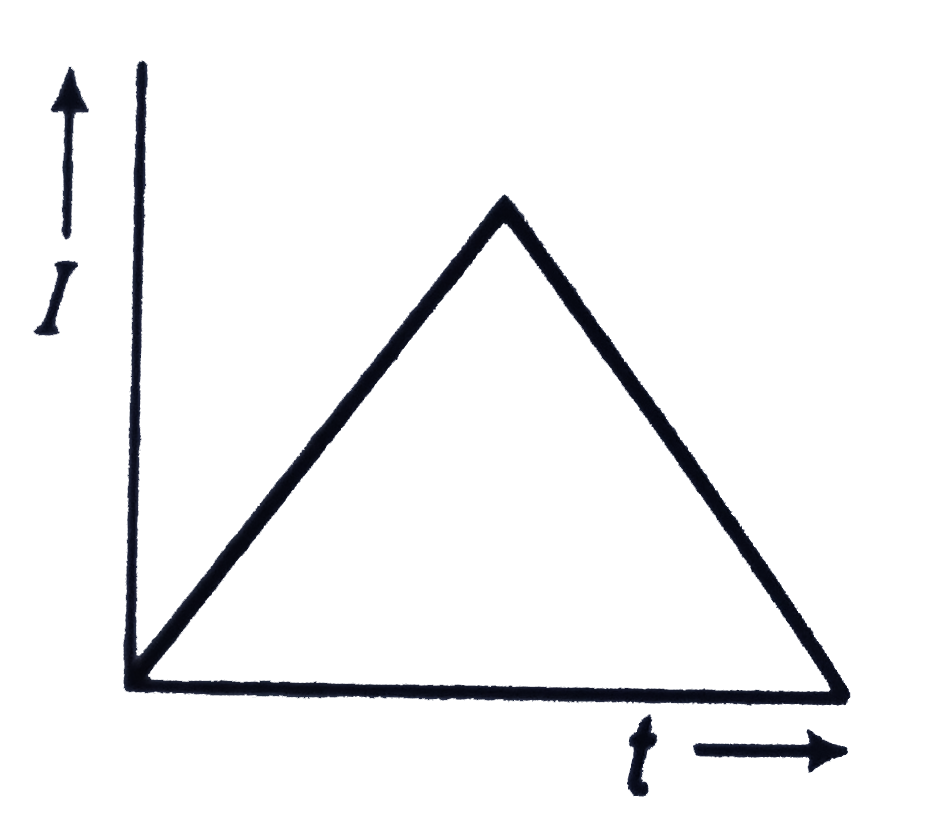
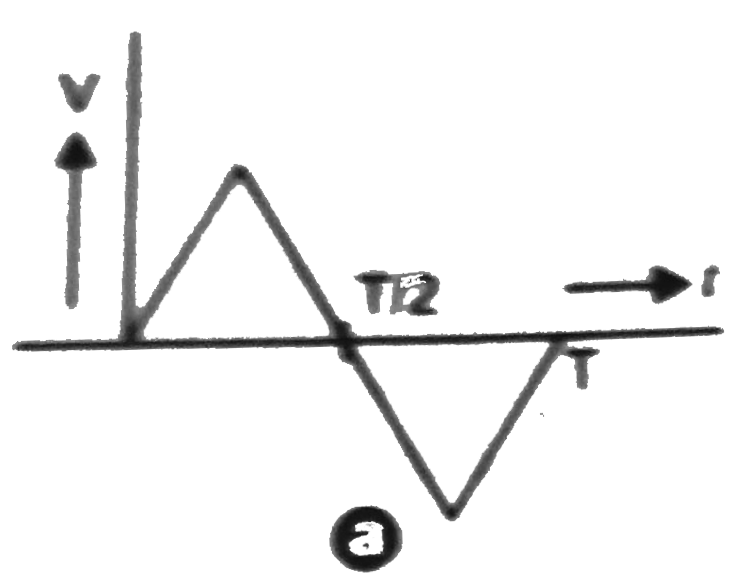
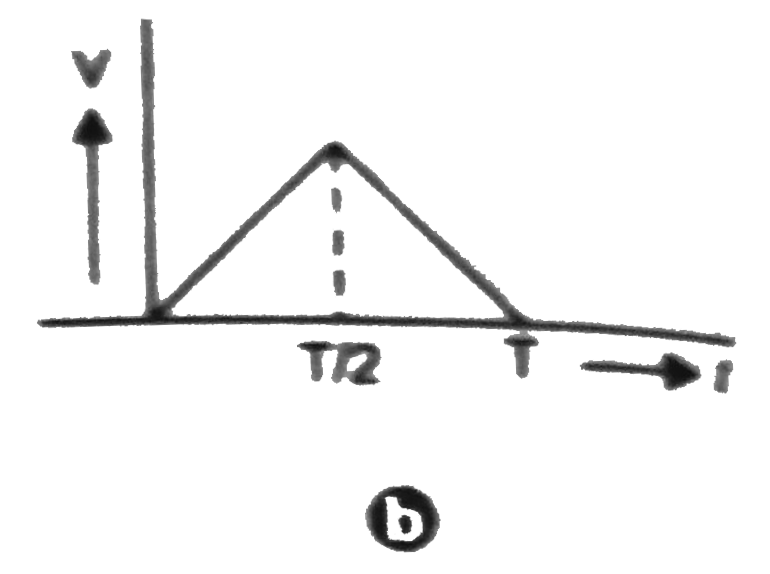
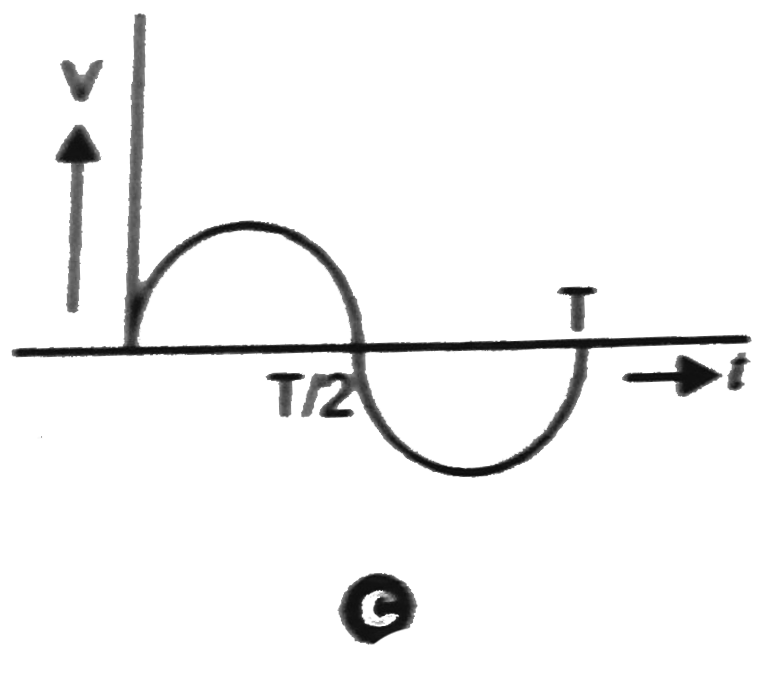
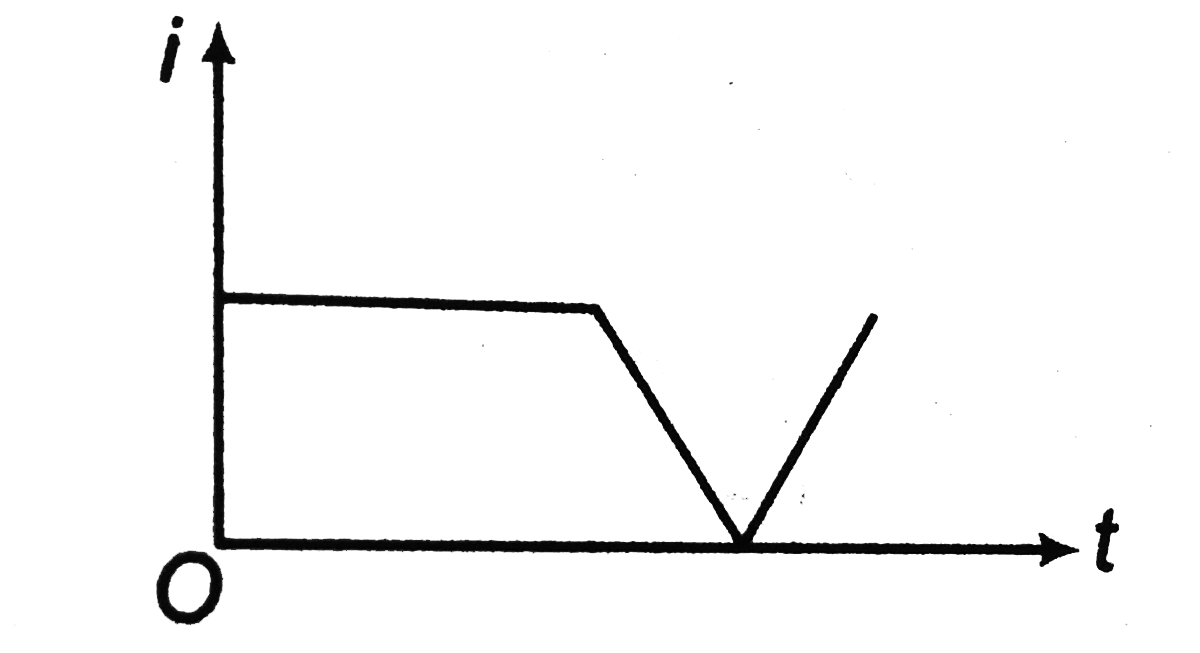
An alternating current I in an inductance coil varies with time t according to the graph as shown: Which one of the following graph gives the variation of voltage with time?
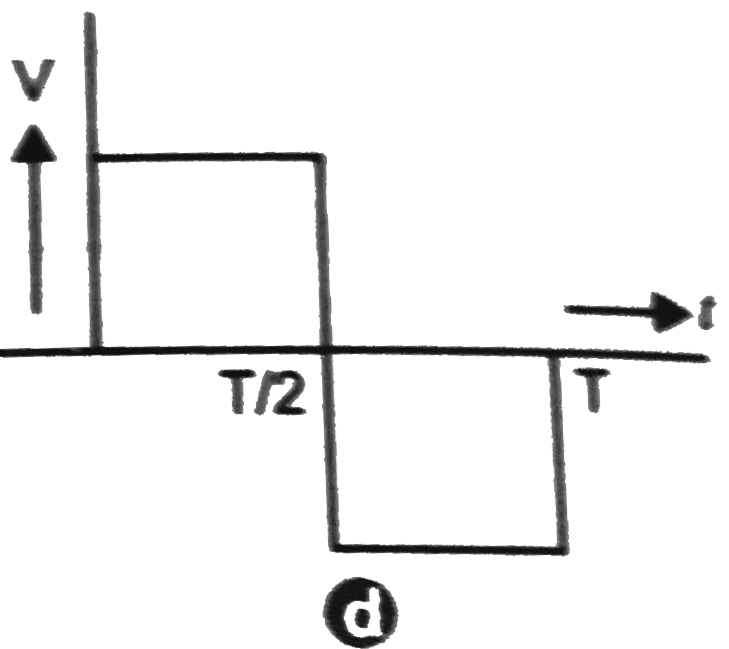
The correct Answer is:D
As is clear from fig.
current increases uniformaly form t = 0 to t=T/2 and decreases uniformaly at the same rate from
t=T/2 to t=T
∴dIdt is positive constant in the first half
(0→T/2) and dIdt is negative constant of same value in the second half (T/2→T).
As V=LdIdt= positive constant from t = 0 to
t=T/2 and V=LdIdt = negative constant form
t=T/2 to t = T
choice (d) is correcte in Fig.
Topper's Solved these Questions
- BOOK - PRADEEPCHAPTER - ELECTROMAGNETIC INDUCTION & ALTERNATING CURRENTEXERCISE - JEE Mains Ad..(Multiple Choice Question)1videos
ELECTROMAGNETIC INDUCTION & ALTERNATING CURRENT
- BOOK - PRADEEPCHAPTER - ELECTROMAGNETIC INDUCTION & ALTERNATING CURRENTEXERCISE - Multiple Choice Questions1videos
ELECTROMAGNETIC INDUCTION & ALTERNATING CURRENT
- BOOK - PRADEEPCHAPTER - ELECTROMAGNETIC INDUCTION & ALTERNATING CURRENTEXERCISE - Value Based Questions2videos
ELECTROMAGNETIC INDUCTION & ALTERNATING CURRENT
- BOOK - PRADEEPCHAPTER - DUAL NATURE OF RADIATION AND MATTEREXERCISE - Exercise191videos
DUAL NATURE OF RADIATION AND MATTER
- BOOK - PRADEEPCHAPTER - ELECTROMAGNETIC WAVESEXERCISE - II Focus multiple choice question5videos
ELECTROMAGNETIC WAVES
Similar Questions
The current (I) in the inductance is varying with time according to the plot shown in figure.
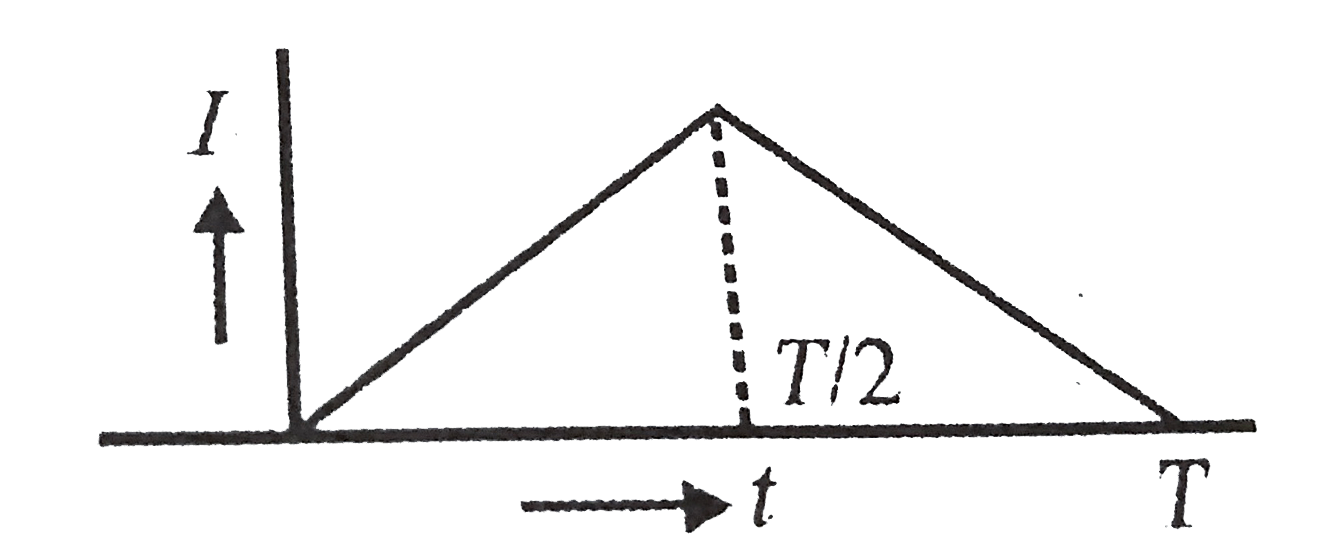
Which one of the following is the correct variation of voltage with time in the coil?View SolutionThe current i in an induction coil varies with time t according to the graph
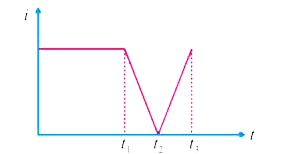
Draw the graph of induced e.m.f. with time.View Solution
Knowledge Check
- Question 1 - Select One
The current I in an inductance coil varies with time according to the graph given in the figure.
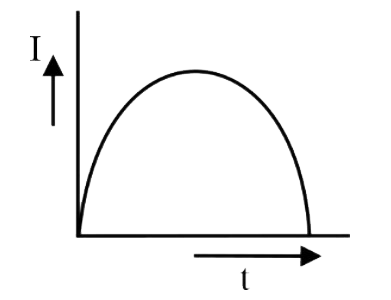
Which one of the following graphs gives the variation of voltage with time across the inductor?A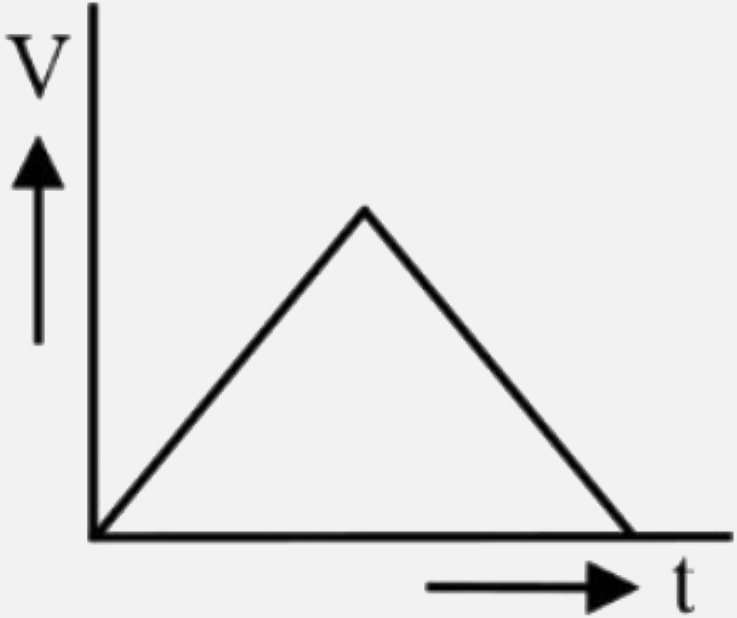 B
B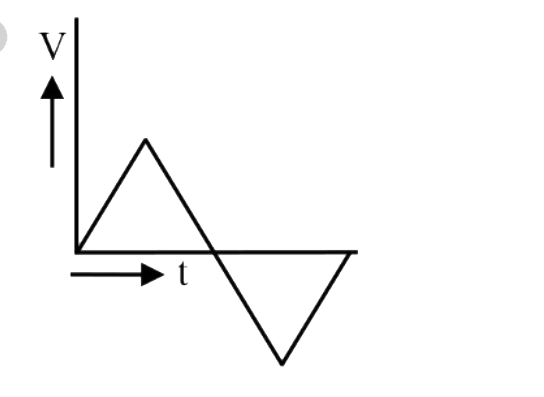 C
C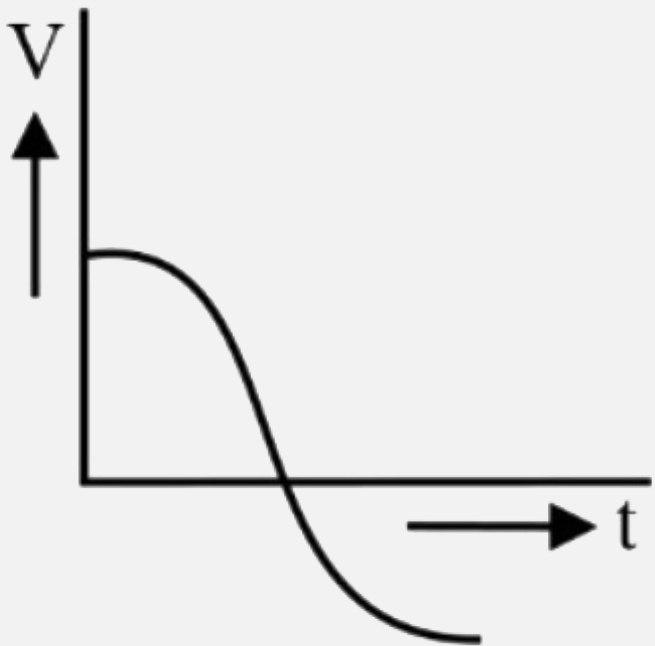 D
D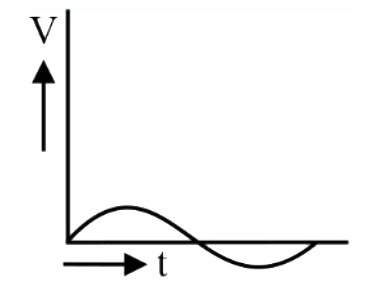
- Question 2 - Select One
The current I in a n inductance coil varies with time, t according to the graph shown in the figgure. Which one of the following plots shows the variation of voltage in the coil with time ?
 A
A B
B C
C D
D
- Question 3 - Select One
The current i in an induction coil varies with time according to the graph shown in figure. Which of the following graph shows induced emf in the coil with time:
A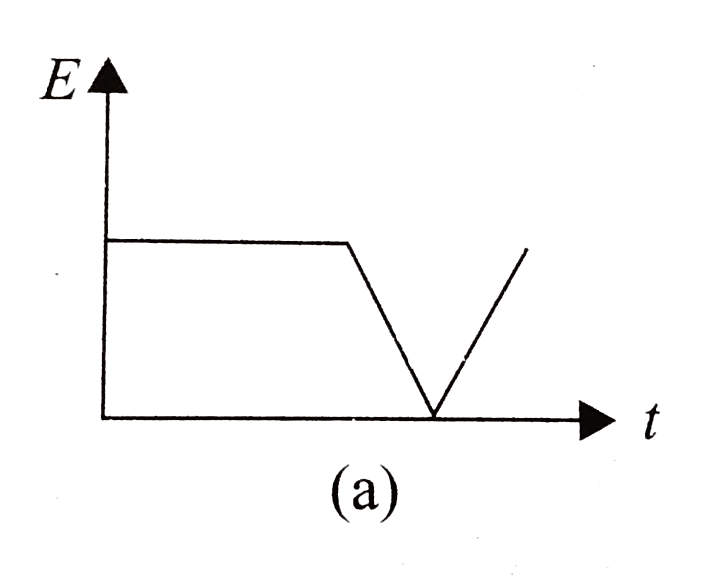 B
B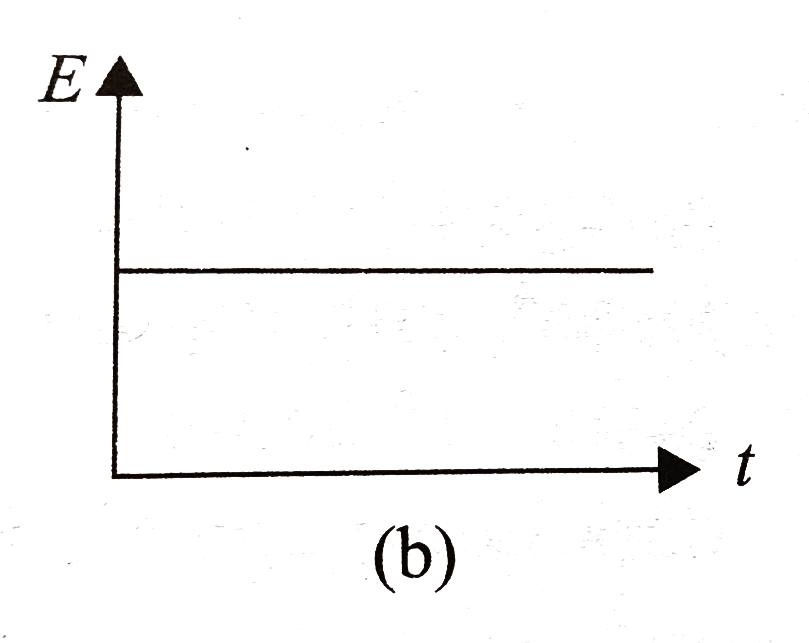 C
C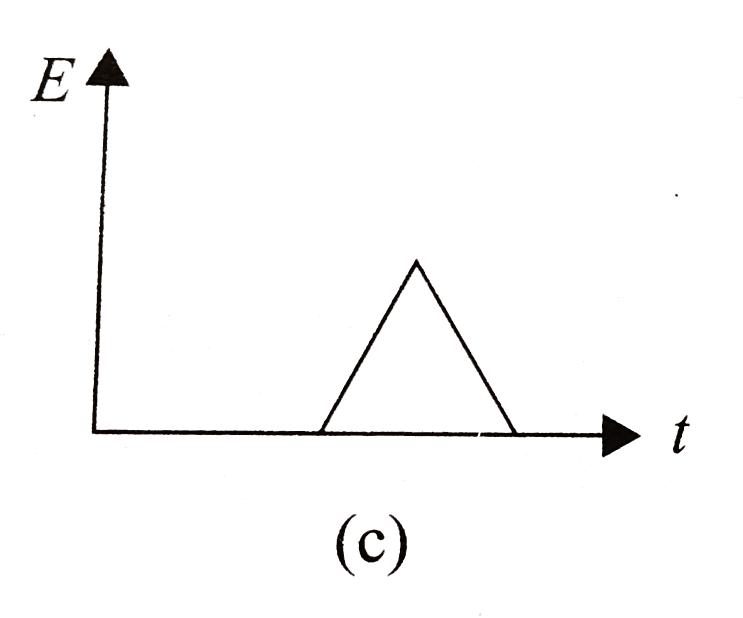 D
D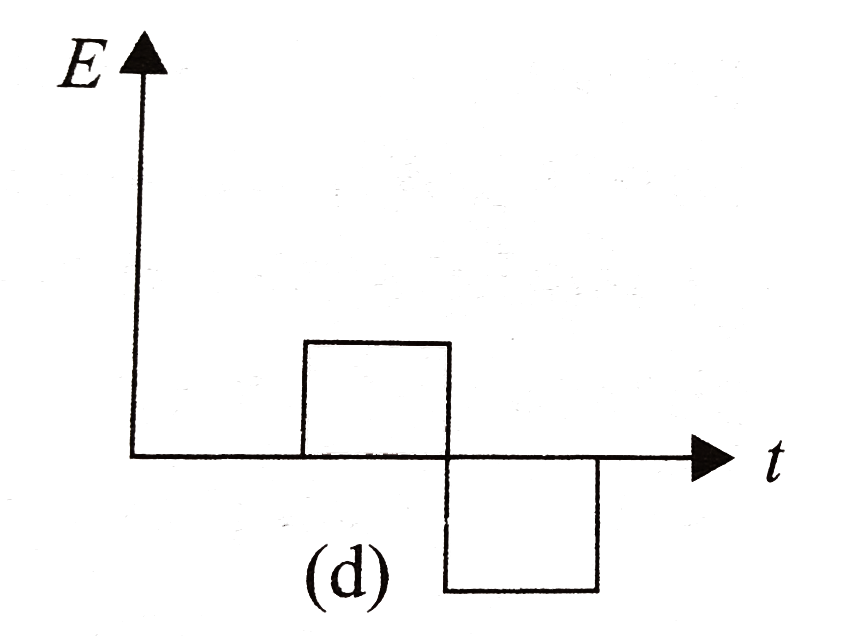
The current is an induction coil varies with time t, according to the graph shown in figure. Which of the following graphs shows the induced emf (e) in the coil with time.
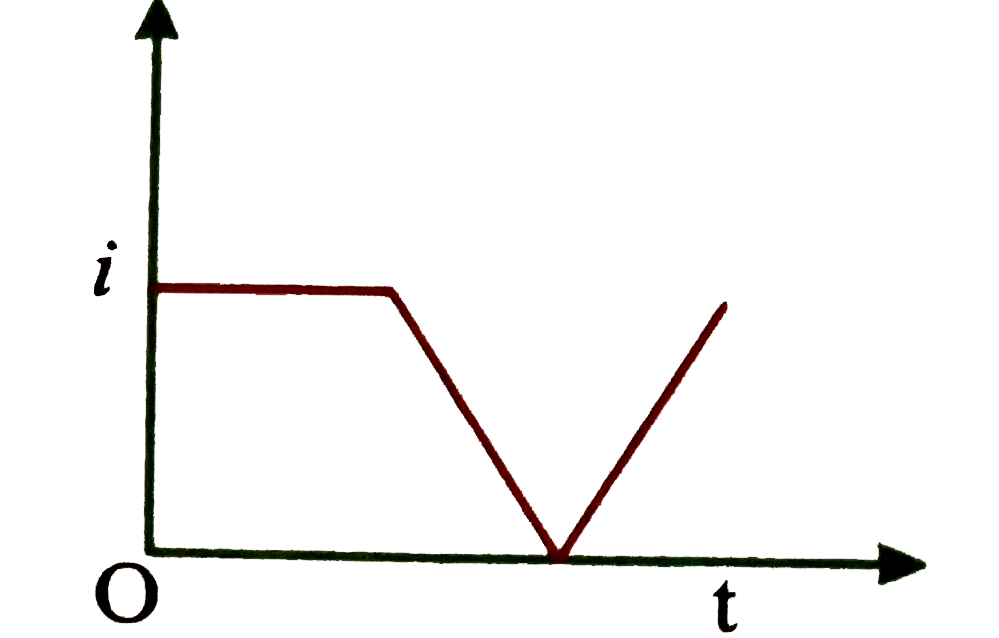 View Solution
The current (I) in the inductance is varying with time according to the plot shown in figure
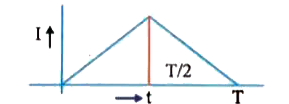
Which one of the following is the correct variation of voltage with time in the coil ?View SolutionThe current (I) in the inductance is varying with time acroding to the plot shown in figure.
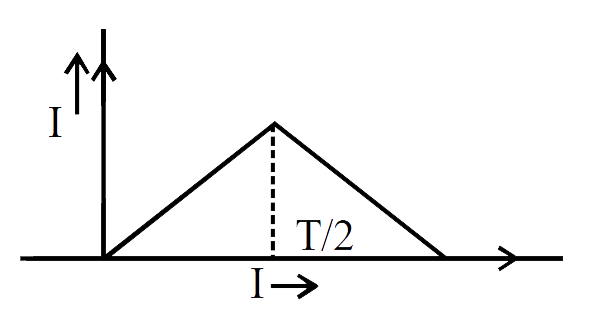
Which one of thhe following is the correct variation of voltage with time in the coil ?View SolutionThe current i in an induction coil varies with time t according to the graph shown in the figure-5.250. Which of the following graphs shows the induced EMF in the coil with time ?
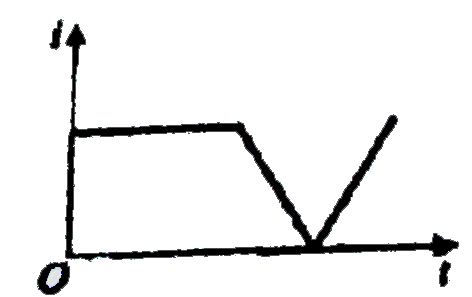 View Solution
The current i in an inductionn coil varies with time t according to the graph shown in the figure. Which of the following grahs shows athe induced emf (ε) in the coil with time?
 View Solution
