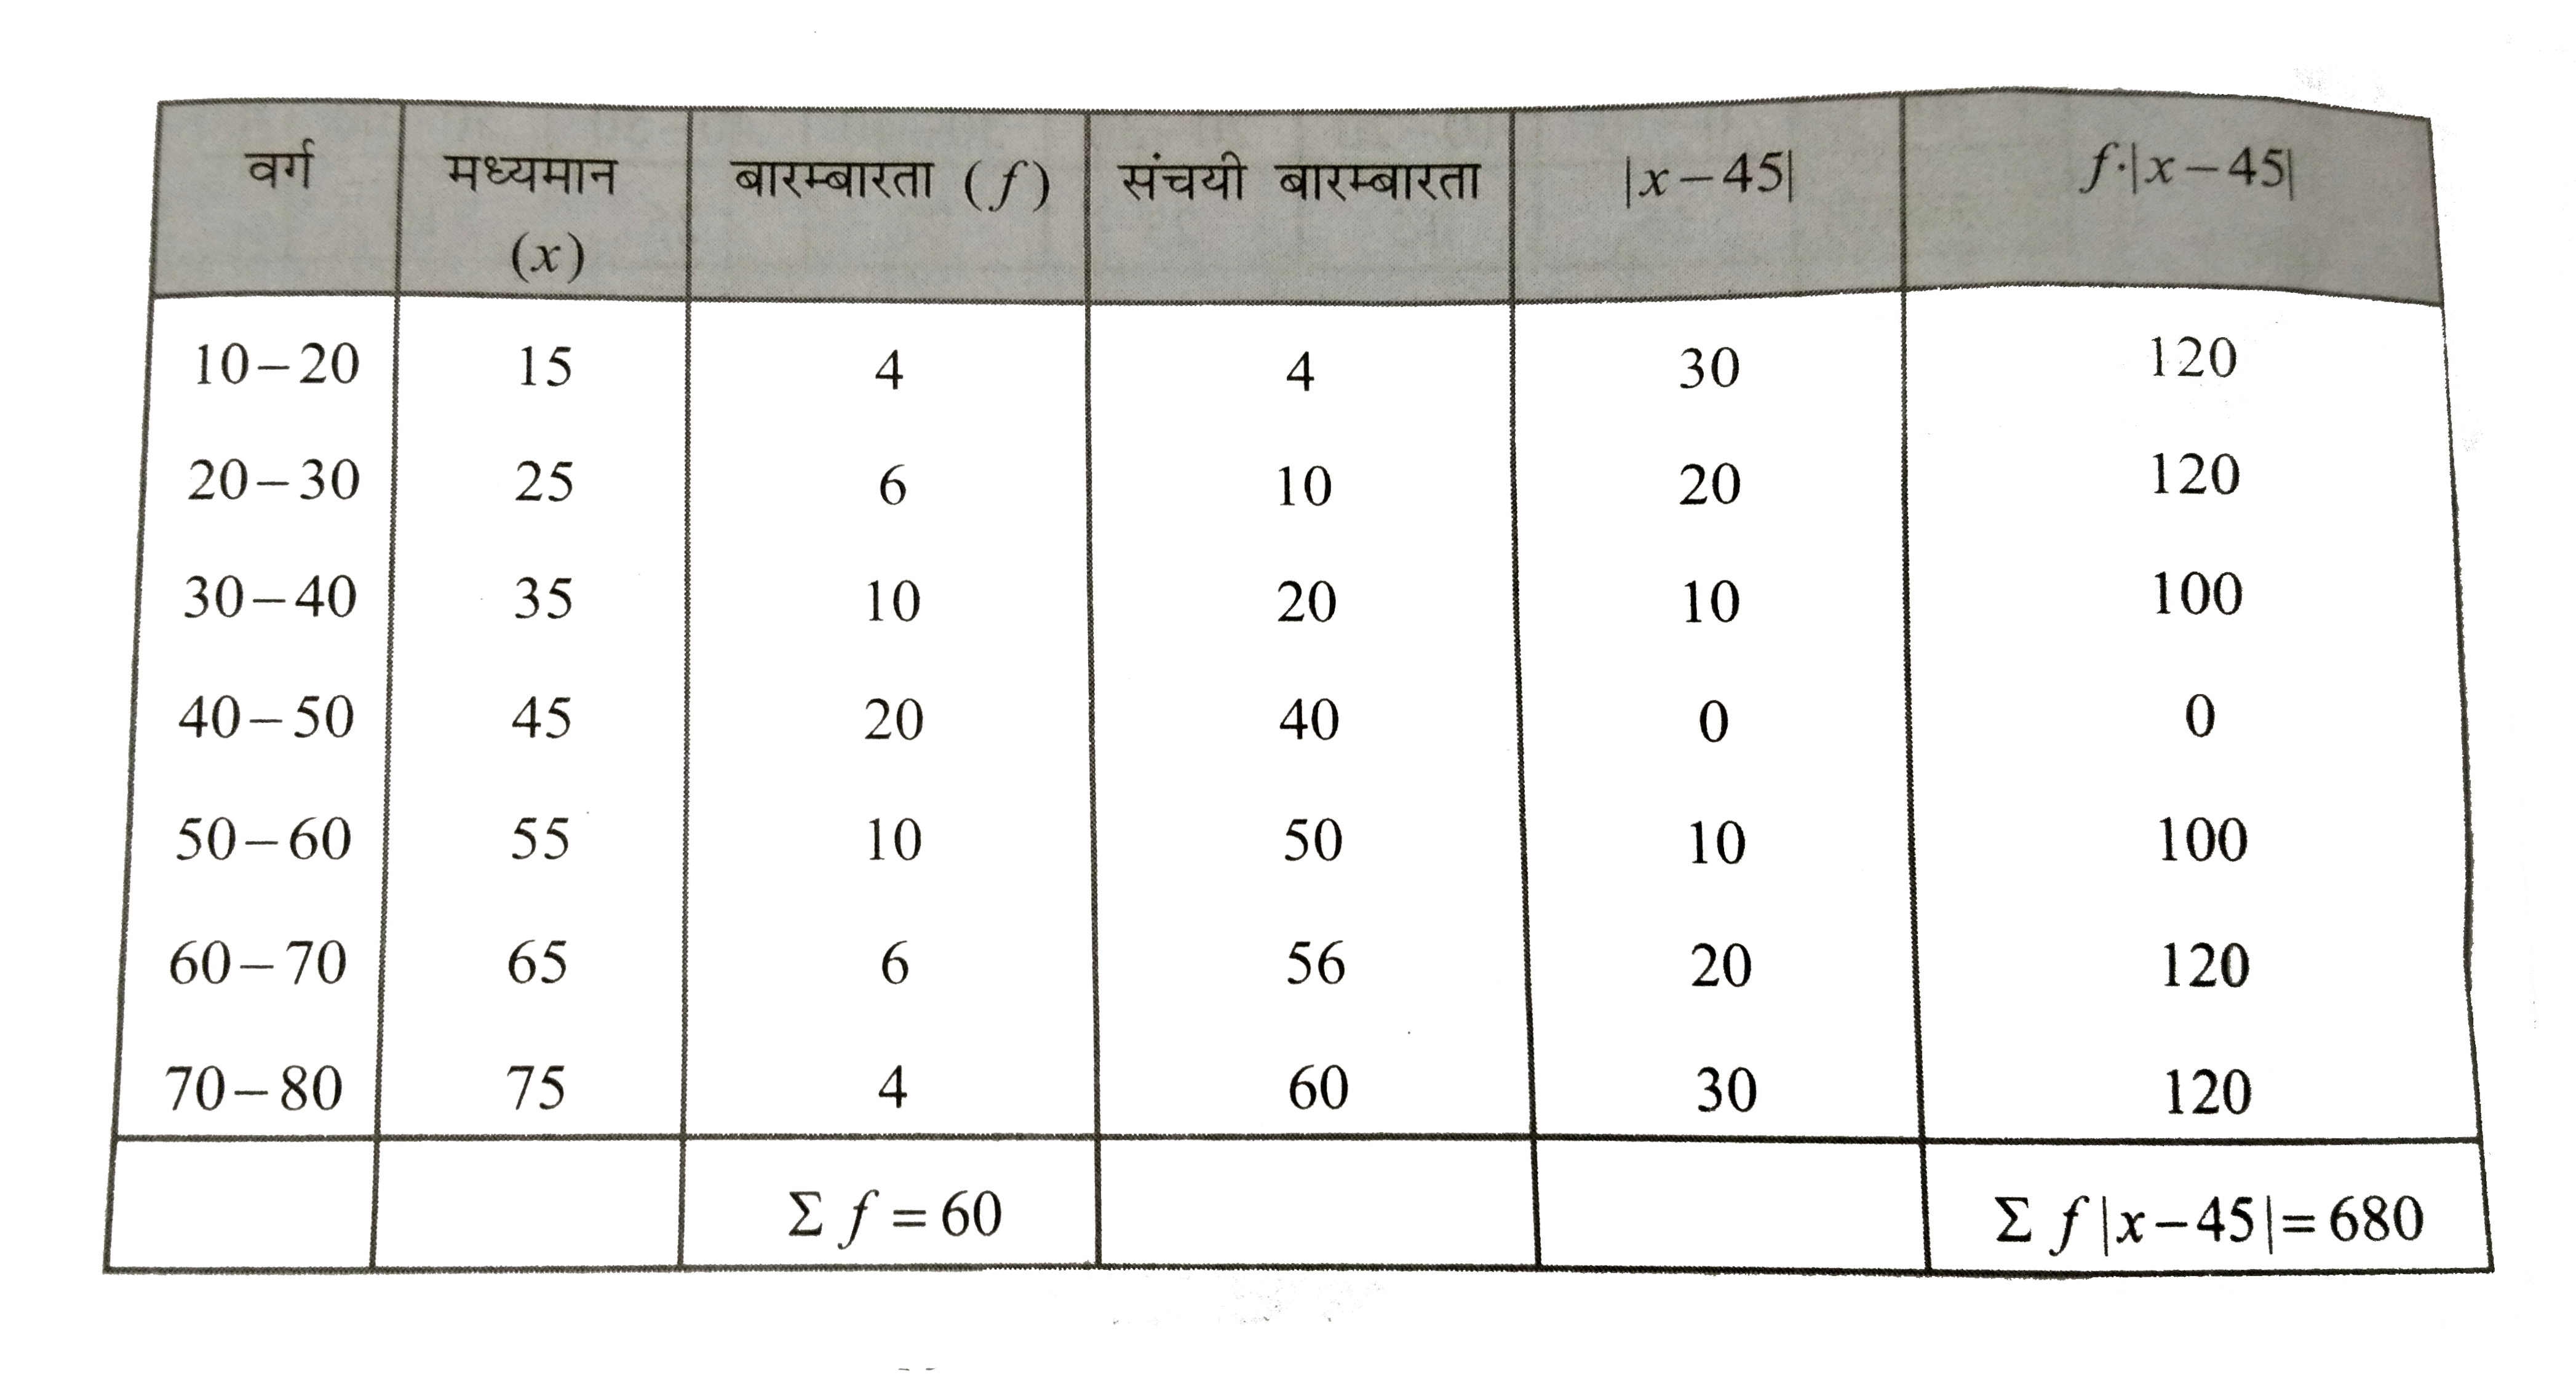
निम्नलिखित बारम्बारता बंटन के लिए माध्यिका के सापेक्ष माध्य विचलन ज्ञात कीजिए |


स्पष्टतः N=60⇒N2=30
⇒ संगत ''माध्यिका वर्ग'' = 40-50
∴ l=40,F=20,h=10,f=20
अब माध्यिका =l+N2−Ff×h
=40+30−2020×10
=45
∴ माध्यिका के सापेक्ष अभीष्ट माध्य विचलन =Σfi|xi−45|Σfi
=68060=11.33
Topper's Solved these Questions
- सांख्यिकी : प्रकीर्णन की मापBOOK - BALAJI PUBLICATIONCHAPTER - सांख्यिकी : प्रकीर्णन की मापEXERCISE - अभ्यास प्रश्न 23.1
12 Videos
- सांख्यिकी : प्रकीर्णन की मापBOOK - BALAJI PUBLICATIONCHAPTER - सांख्यिकी : प्रकीर्णन की मापEXERCISE - अभ्यास प्रश्न 23.2
15 Videos
- सरल रेखाएं BOOK - BALAJI PUBLICATIONCHAPTER - सरल रेखाएं EXERCISE - (B ) विवेचनात्मक सोच वाले प्रश्न
3 Videos
Similar Questions
निम्नलिखित आँकड़ों का माध्य के सापेक्ष माध्य विचलन ज्ञात कीजिए |
(i) 4,7,8,9,10,12,13,17
(ii) 30,40,70,60,20,10,50
View Solutionनिम्नलिखित आँकड़ों का प्रसरण तथा मानक विचलन ज्ञात कीजिए |
5,9,10,12,8,13,6
View Solutiona व b के किस मान के लिए रेखा ax+by+8=0 द्वारा अक्षों पर कटा गया अन्तः खंड रेखा 2x−3y+6=0 द्वारा काटे गए अन्तः खंडो के लम्बाई में बराबर तथा चिन्हो में विपरीत है?
View SolutionIdentify the cell organelle 'A' :-
ltimg src="https://d10lpgp6xz60nq.cloudfront.net/physics_images/ALN_BIO_C10_E08_018_Q01.png" width="80%"gt
View SolutionHow many lines of symmetry does the above figure have ?
View SolutionWhich of the following are correct chain isomers of butane ? (i)
View SolutionDetermine the point of symmetry of a regular hexagon.
View SolutionDtermine the images of the following figure about the given line :
View SolutionMatch the following Column A to Column B

View SolutionMatch the following Column A to Column B

View SolutionMatch the following Column A to Column B

View SolutionFind the area of the figure given below.

View SolutionThe area of the shaded part in the figure given below is ______.

View SolutionThe inequation represented by the graph given below is :
View SolutionThe inequation that best describes the graph given below is _________
View SolutionThe inequation that best describes the following graph is _________
View Solution
