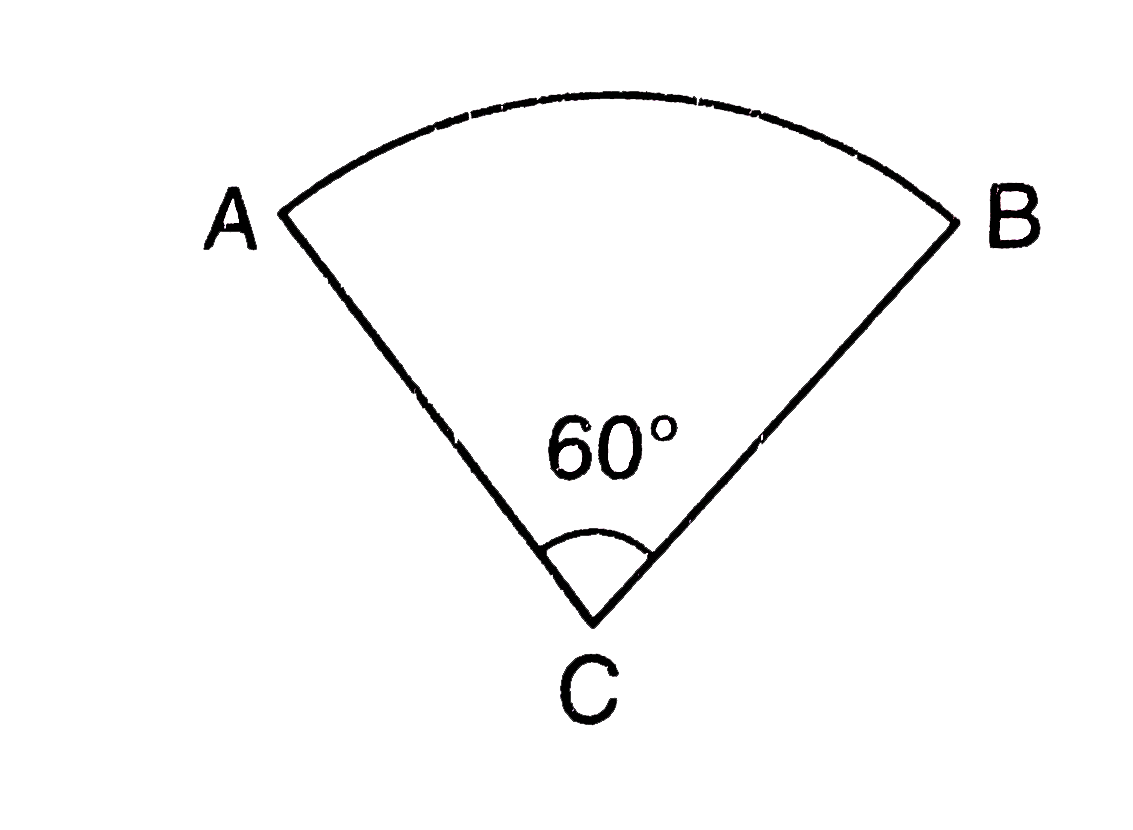
संलग्न चित्र में, एक वृत्त का त्रिज्यखण्ड जिसकी त्रिज्या 10.5 सेमी. है, तो त्रिज्यखण्ड का परिमाप क्या है ?

The correct Answer is:32 सेमी.
Step by step video & image solution for संलग्न चित्र में, एक वृत्त का त्रिज्यखण्ड जिसकी त्रिज्या 10.5 सेमी. है, तो त्रिज्यखण्ड का परिमाप क्या है ? by Maths experts to help you in doubts & scoring excellent marks in Class 10 exams.
Topper's Solved these Questions
- BOOK - RD SHARMACHAPTER - वृत्तों से सम्बन्धित क्षेत्रफल EXERCISE - बहु विकल्पीय प्रश्न45videos
वृत्तों से सम्बन्धित क्षेत्रफल
- BOOK - RD SHARMACHAPTER - वृत्तों से सम्बन्धित क्षेत्रफल EXERCISE - पुनरावृत्ति प्रश्नावली43videos
वृत्तों से सम्बन्धित क्षेत्रफल
- BOOK - RD SHARMACHAPTER - वृत्त EXERCISE - बहु विकल्पीय प्रश्न15videos
वृत्त
- BOOK - RD SHARMACHAPTER - समान्तर श्रेढ़ी EXERCISE - बहु विकल्पीय प्रश्न35videos
समान्तर श्रेढ़ी
Similar Questions
एक वृत्त की परिधि तथा क्षेत्रफल रूप से समान हों, तो वृत्त का व्यास है :
01:37View Solutionएक समतल में तीन वृत्त इस प्रकार स्थित हैं कि प्रत्येक वृत्त अन्य दो को स्पर्श करता है | प्रत्येक वृत्त की त्रिज्या 10 सेमी. है | वृत्तों के बीच में घिरे हुए भाग का क्षेत्रफल ज्ञात कीजिये |
06:07View Solutionएक 5 सेमी त्रिज्या वाले वृत्त बिंदु पर स्पर्श रेखा PQ वृत्त के केंद्र O से जाने वाली रेखा को Q पर इस प्रकार काटती है कि OQ=12 सेमी है। PQ=
02:11View Solutionयदि एक समांतर श्रेढ़ी का 7 वाँ तथा 13 वाँ पद क्रमश : 34 तथा 64 है , तो इसका 18 वाँ पद है :
01:31View SolutionHow many lines of symmetry does the above figure have ?
02:45View SolutionWhich of the following are correct chain isomers of butane ? (i)
02:17View SolutionDetermine the point of symmetry of a regular hexagon.
05:41View SolutionDtermine the images of the following figure about the given line :
02:21View SolutionMatch the following Column A to Column B
 02:03View Solution
Match the following Column A to Column B
 02:10View Solution
Match the following Column A to Column B
 02:17View Solution
Find the area of the figure given below.
 02:10View Solution
The area of the shaded part in the figure given below is ______.
 04:23View Solution
The inequation represented by the graph given below is :
01:13View SolutionThe inequation that best describes the graph given below is _________
03:12View SolutionThe inequation that best describes the following graph is _________
05:46View Solution

