Which of the following plots represents correctly variation of equivalent conductance (Λ) with dilution for a strong electrolyte ?
A
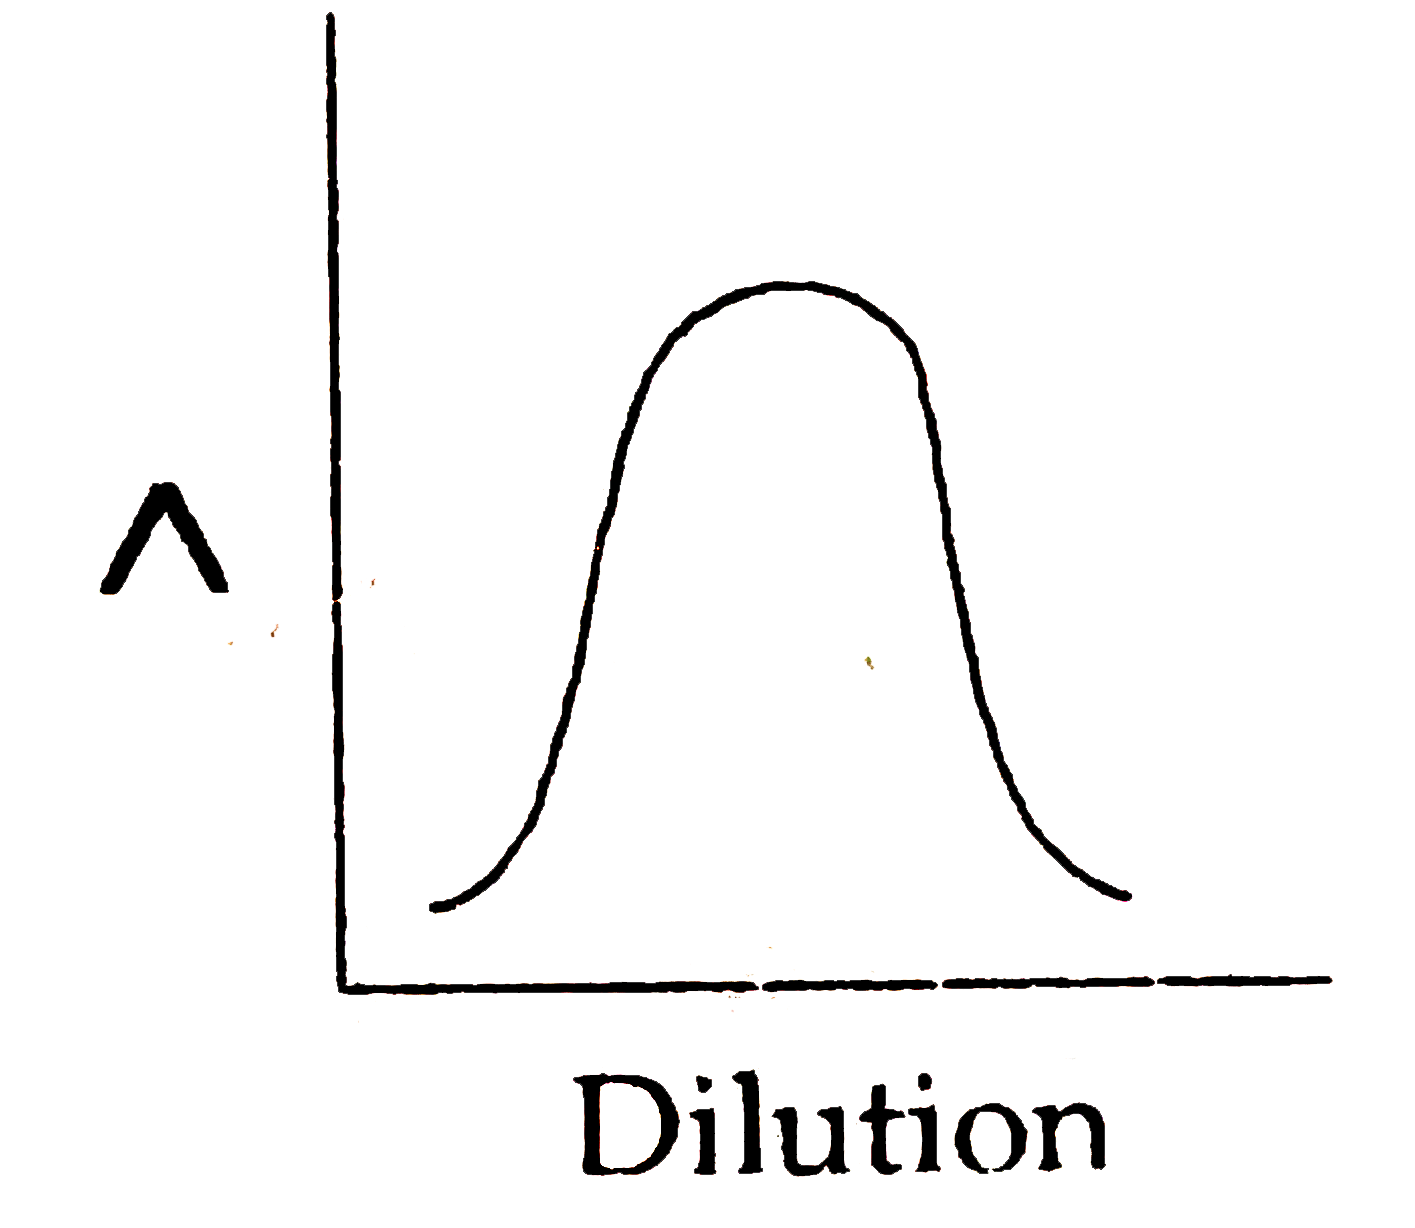
B
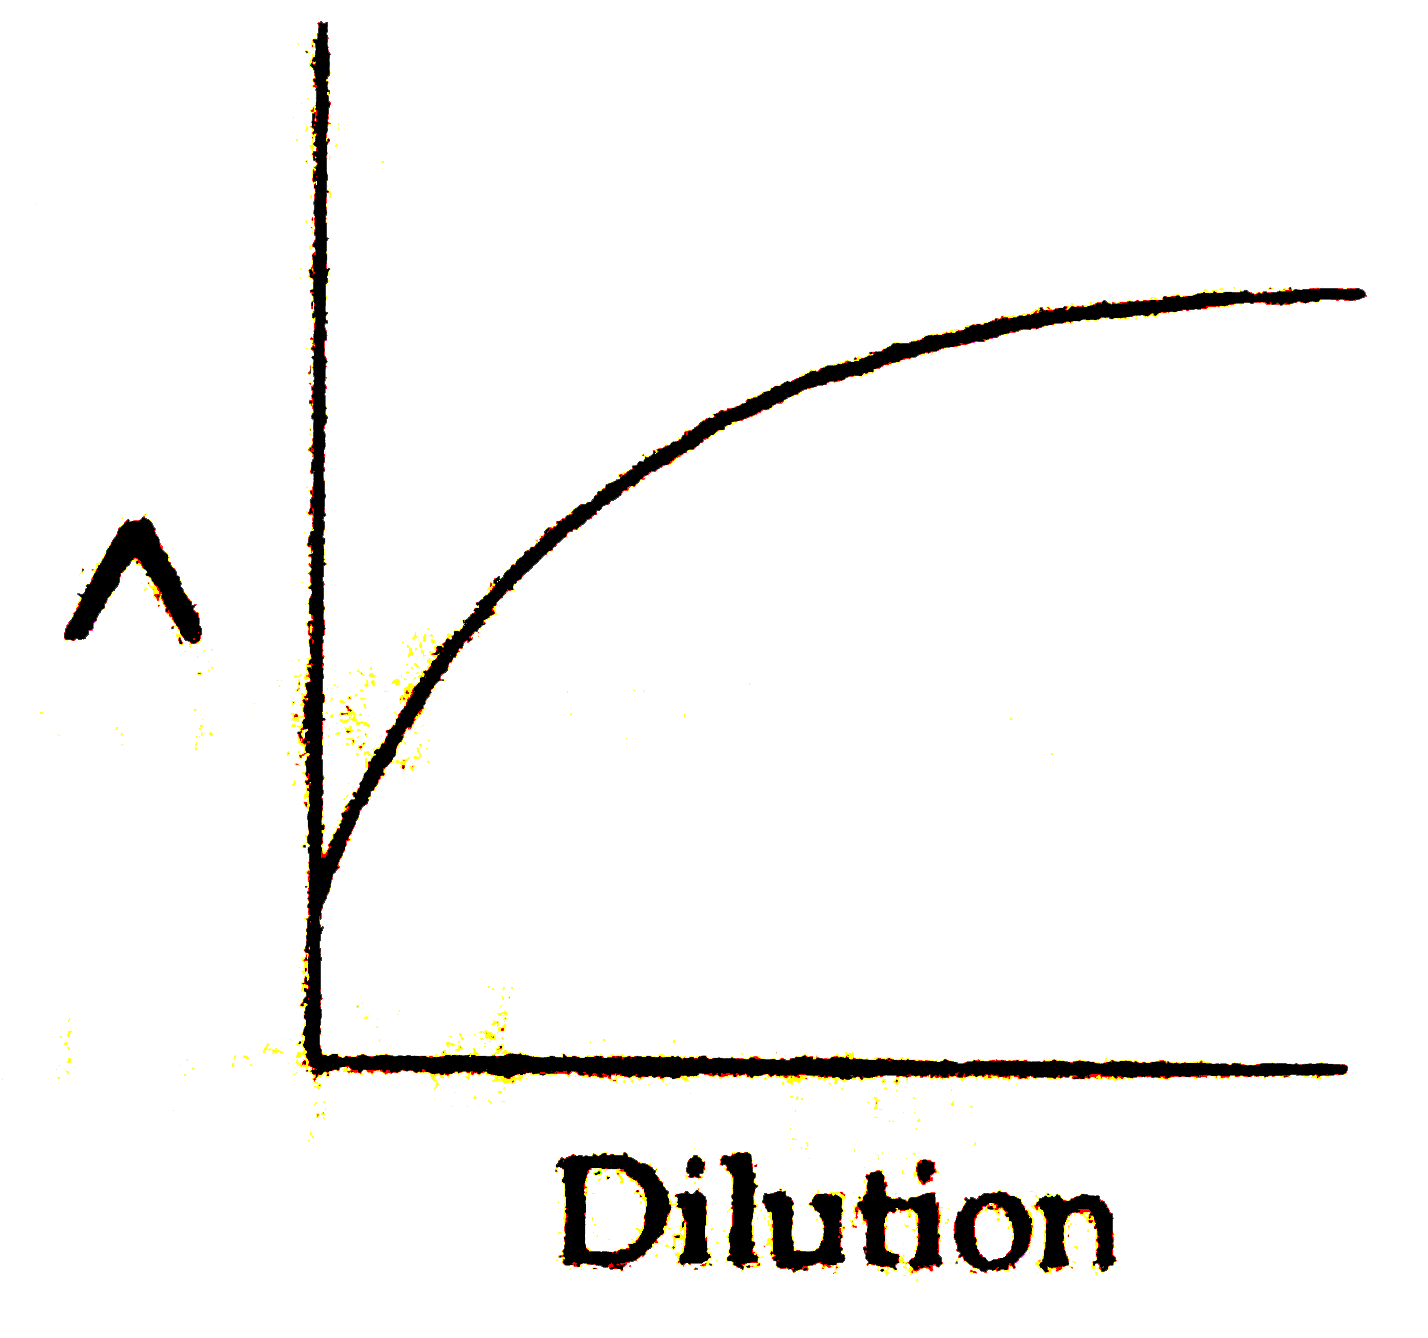
C
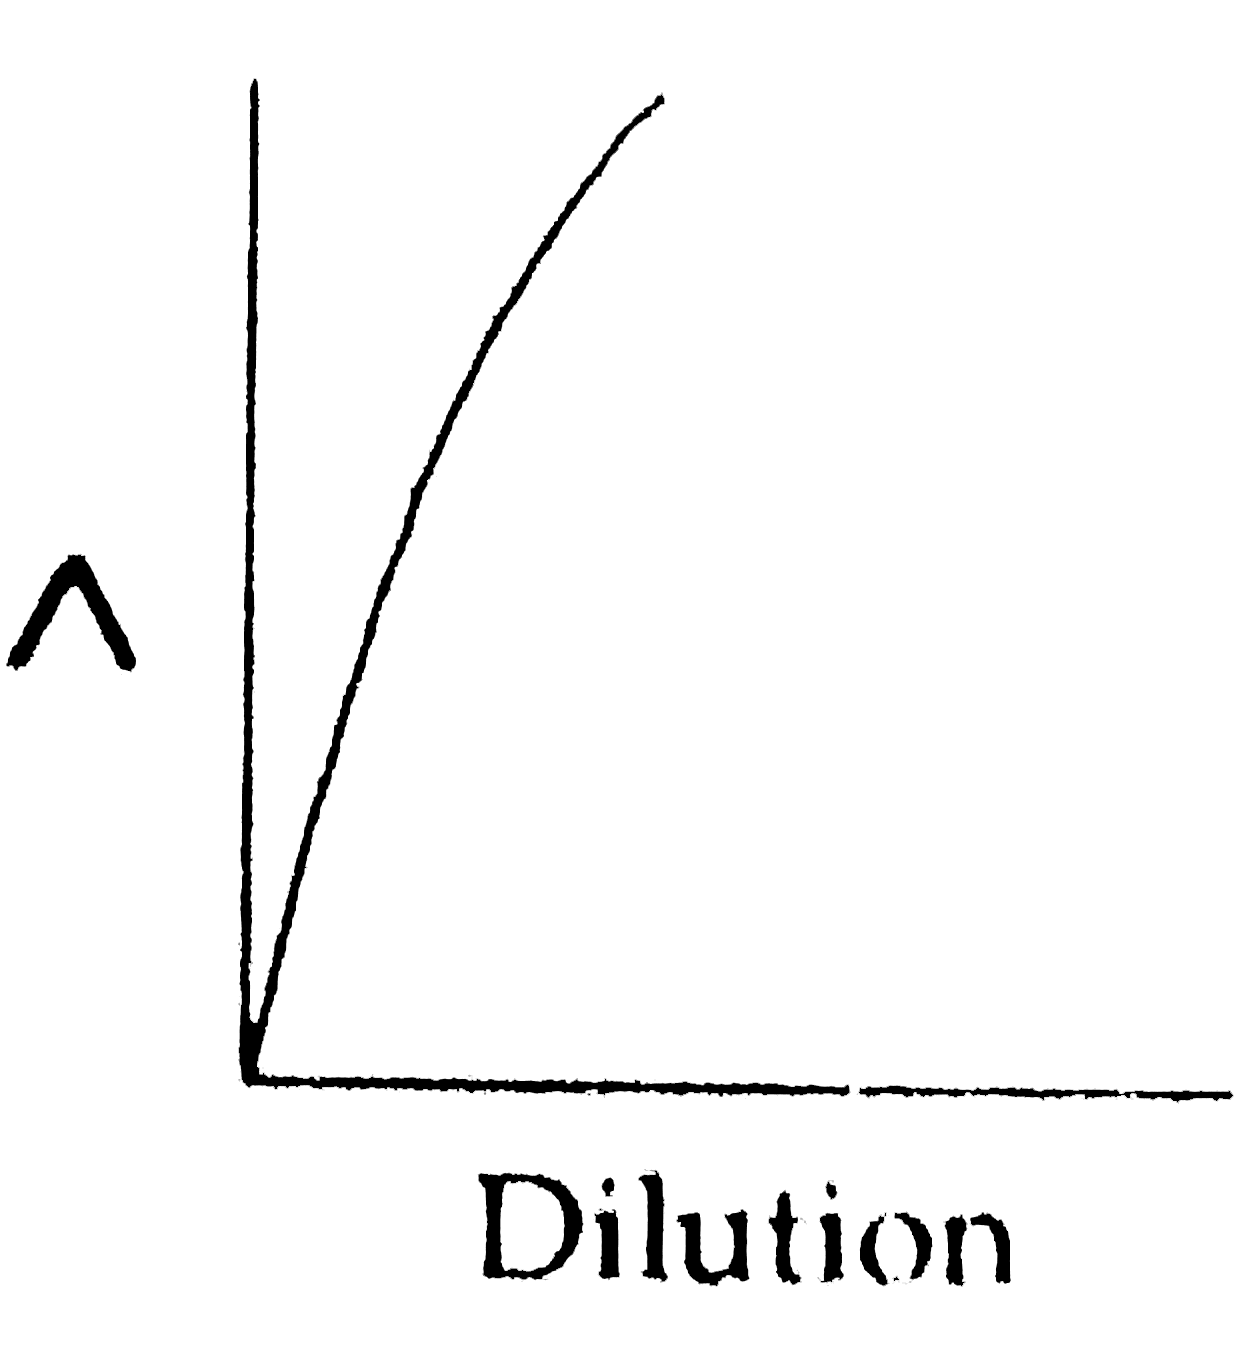
D
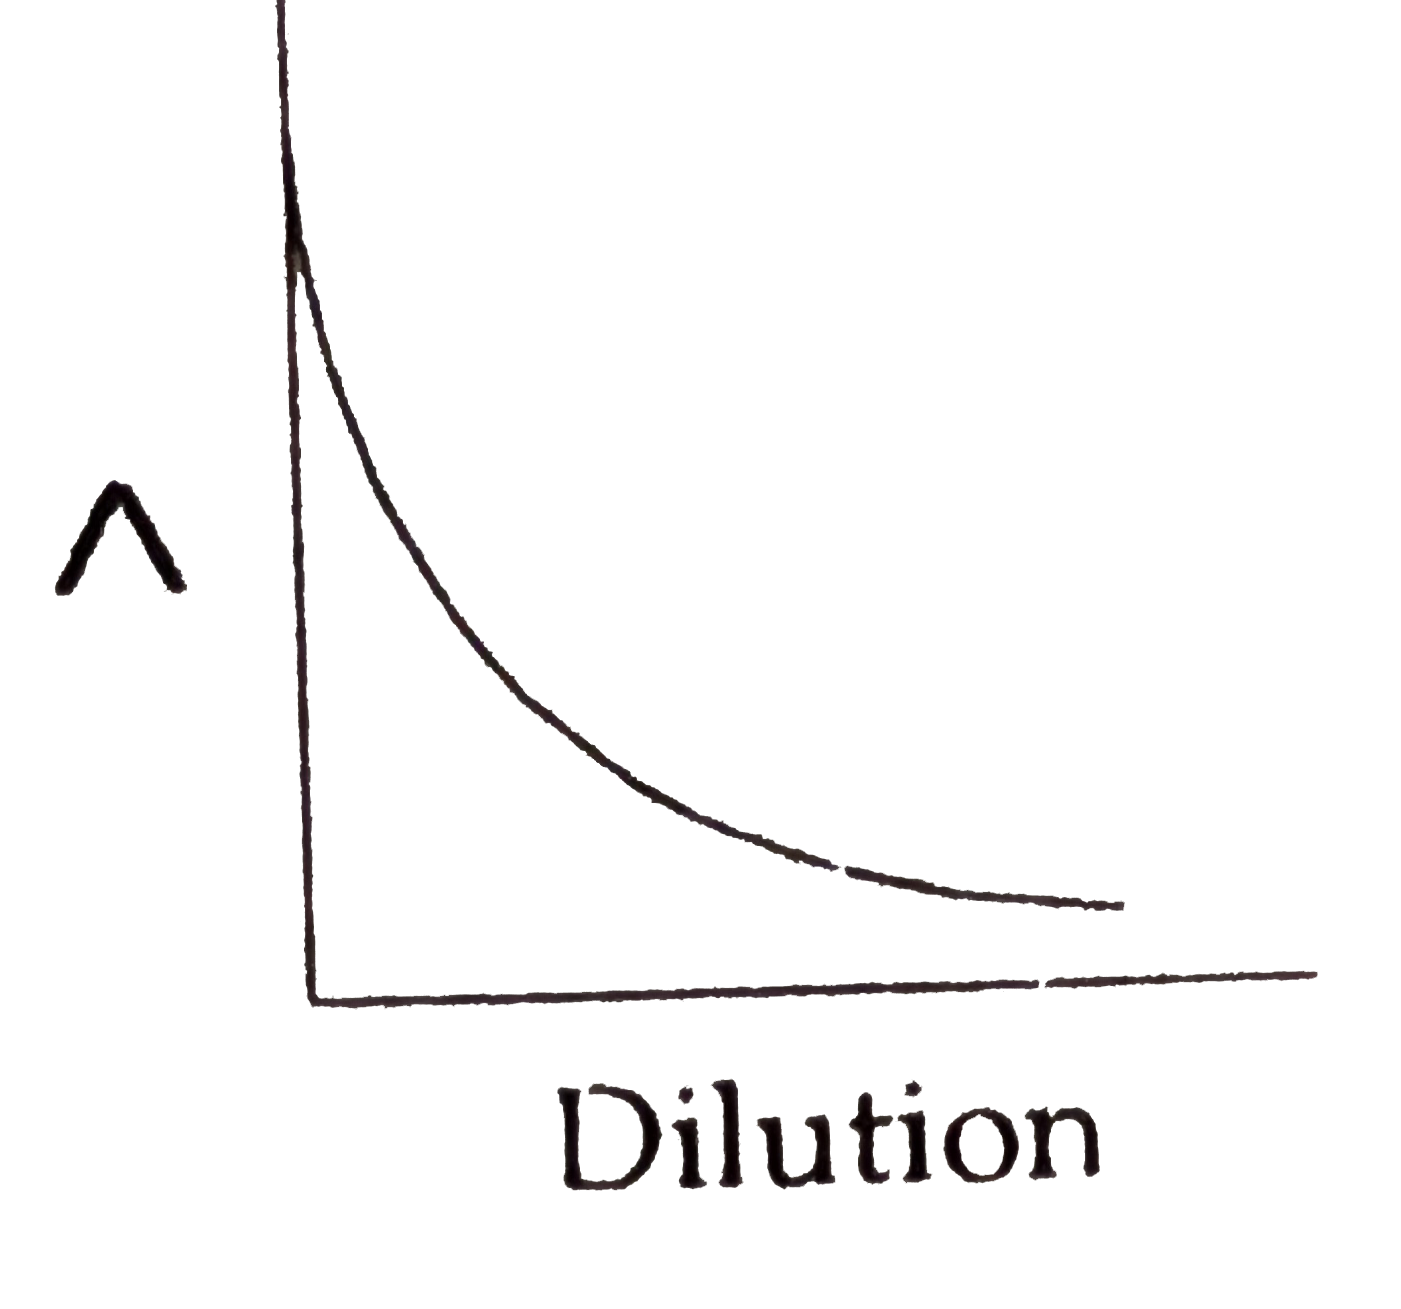
Video Solution
Text Solution
The correct Answer is:B
Eq. conductance increases with dilution and ultimately becomes constant .
|
Topper's Solved these Questions
- ELECTROCHEMISTRY BOOK - NIKITA PUBLICATIONCHAPTER - ELECTROCHEMISTRY EXERCISE - Questions From Competitive Exam
46 Videos
- D-AND F-BLOCK ELEMENTSBOOK - NIKITA PUBLICATIONCHAPTER - D-AND F-BLOCK ELEMENTSEXERCISE - MULTIPLE CHOICE QUESTIONS
515 Videos
- GENERAL PRINCIPLES & PROCESSES OF ISOLATION OF ELEMENTSBOOK - NIKITA PUBLICATIONCHAPTER - GENERAL PRINCIPLES & PROCESSES OF ISOLATION OF ELEMENTSEXERCISE - Multiple choice questions
117 Videos
Similar Questions
Knowledge Check
Which of the following plots correctly represents variation of equivalent conductance (∧eq) with dilution for a strong electrolyte ?
A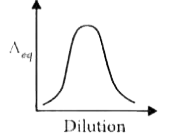 B
B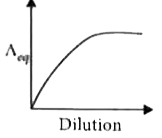 C
C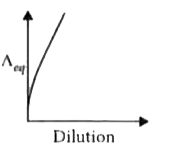 D
D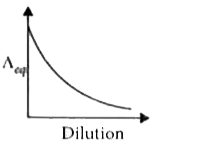
Which of the following plots represents correctly the variation of molar conductivity with dilution for a strong electrolyte?
A B
B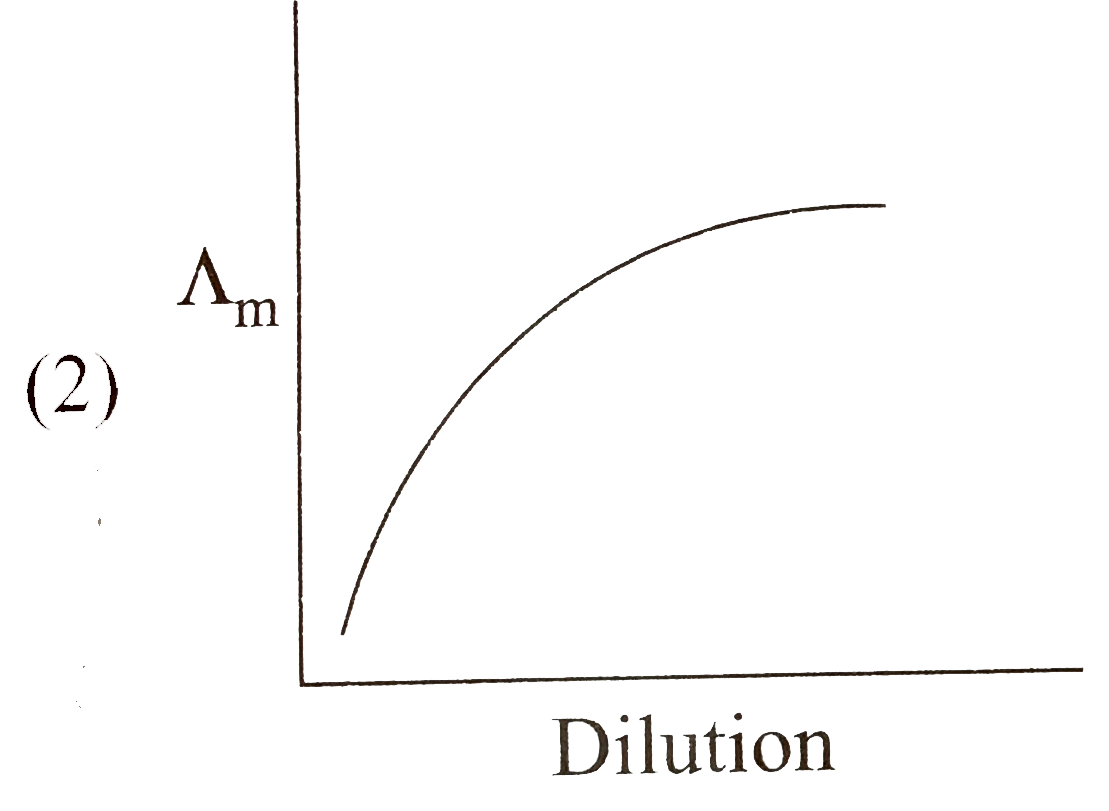 C
C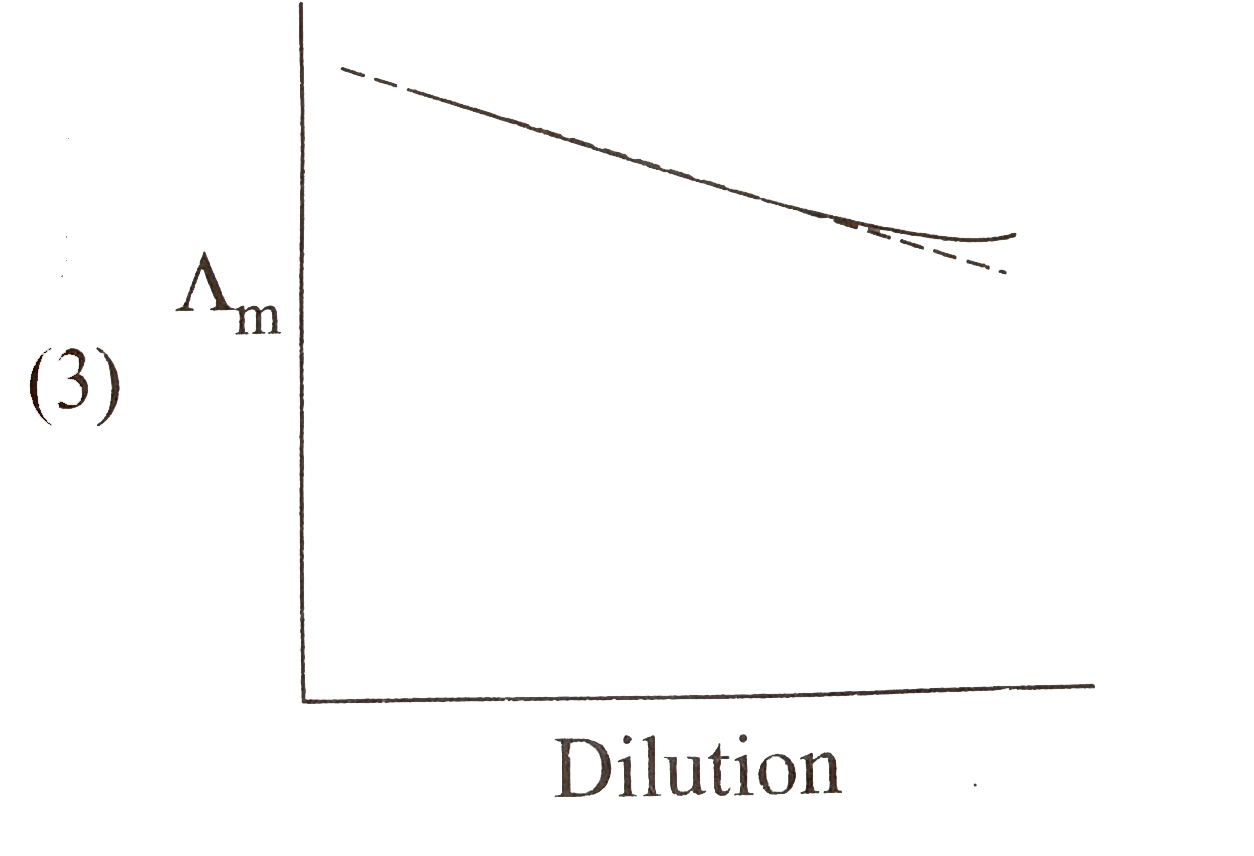 D
D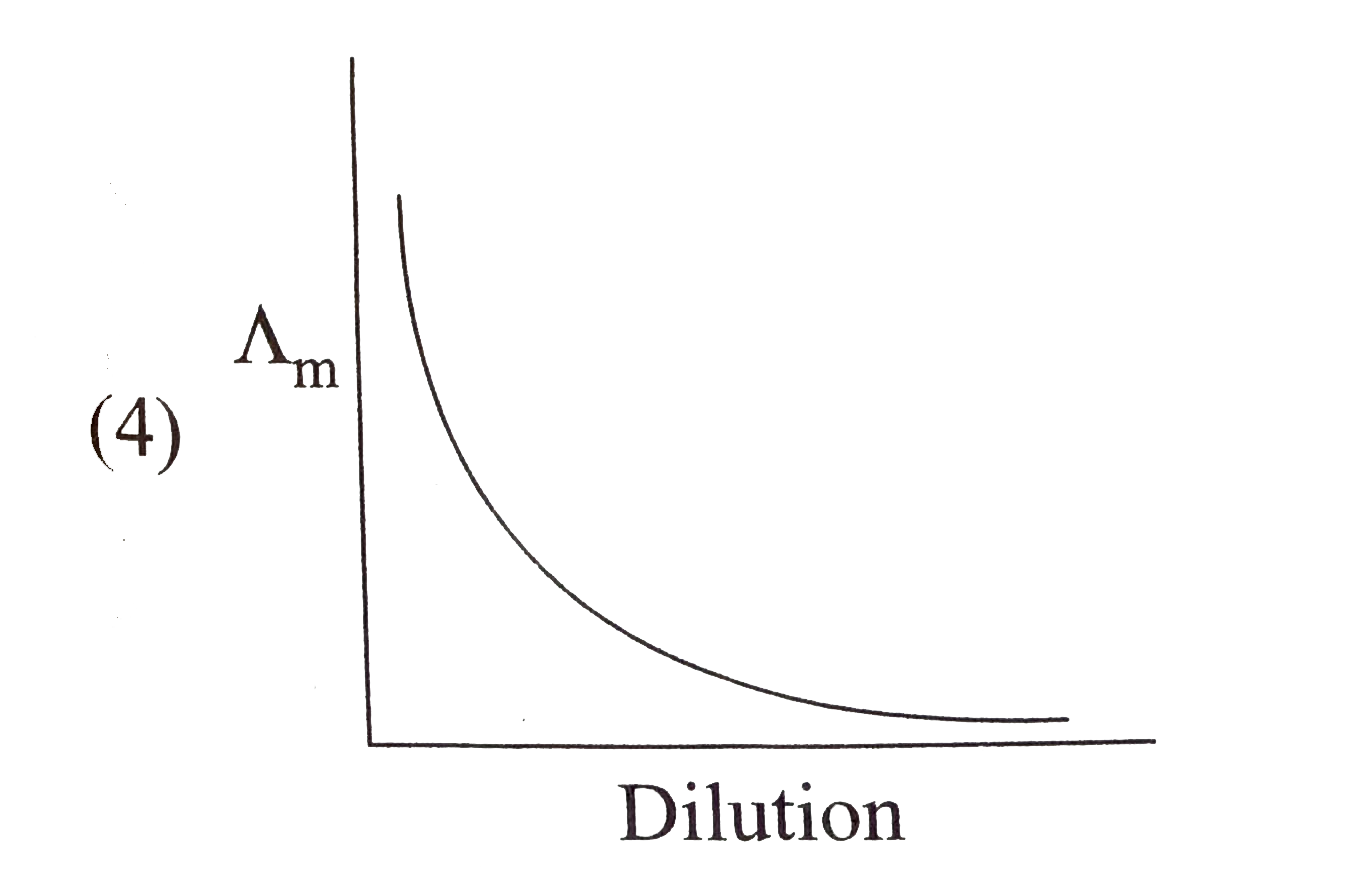
Which of the following graph correctly represents the variation of molar conductance (Δm) with dilution for a strong electrolyte ?
A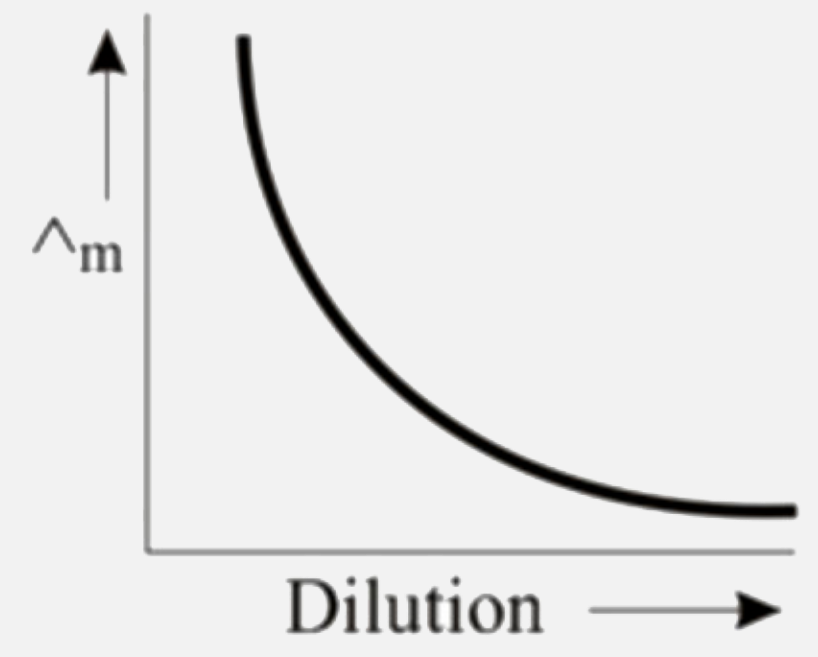 B
B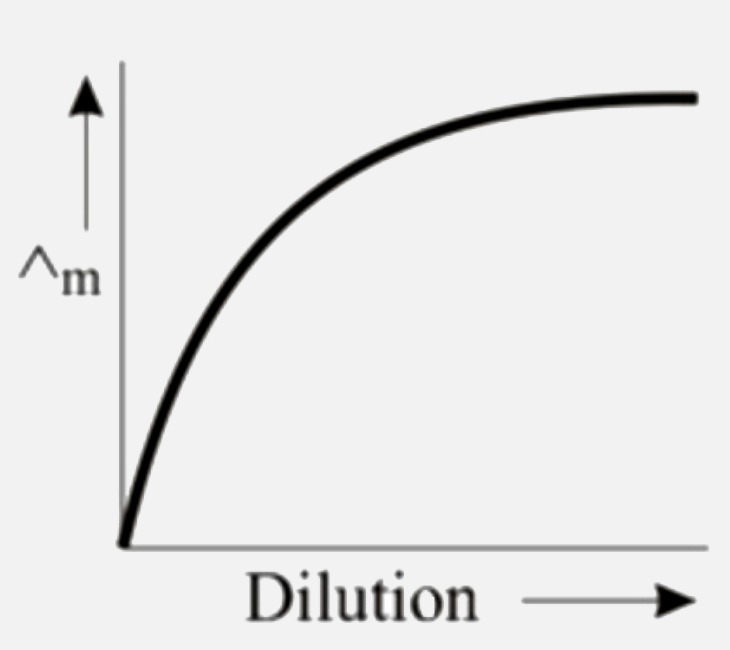 C
C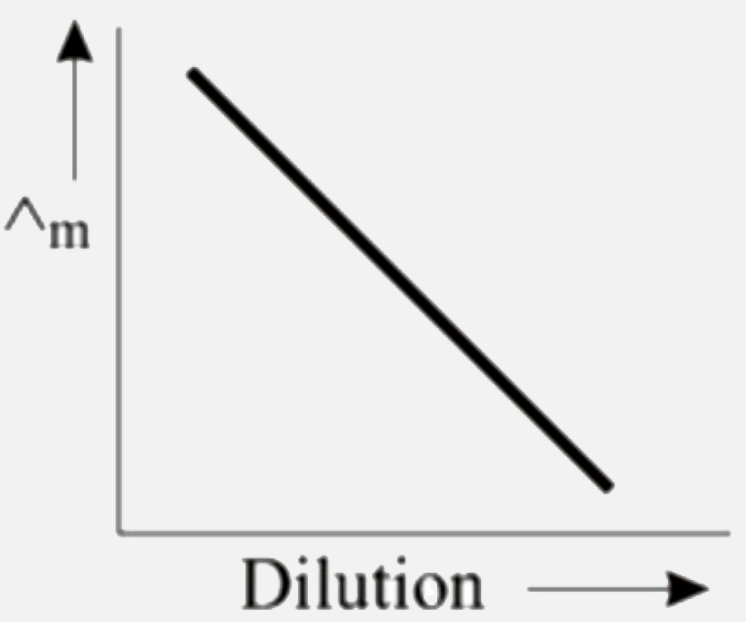 D
D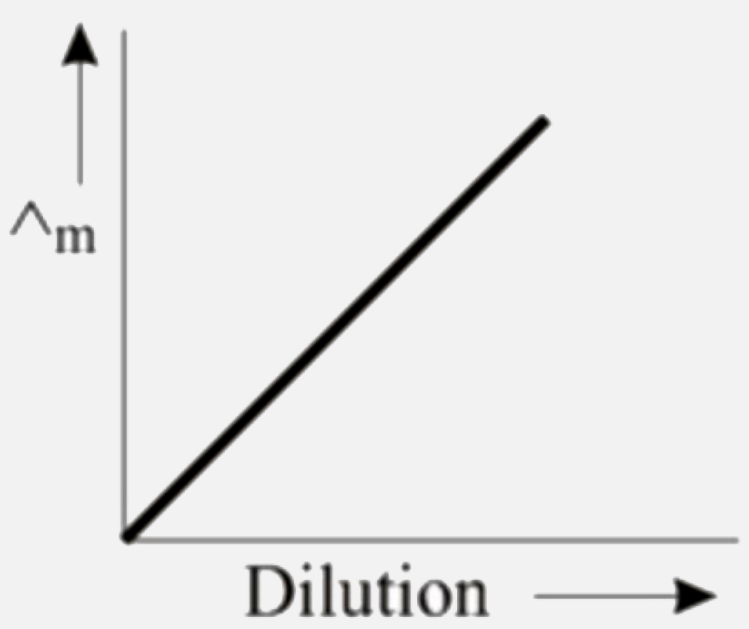
The conductivity of a strong electrolyte:
View SolutionThe conductivity of a strong electrolyte:
View SolutionWhich one of the following represents correctly the variations of surface tension with temperature θ ?
View SolutionWhich of the following is a strong electrolyte ?
View SolutionWhich of the following is a strong electrolyte ?
View Solution
