The profits & loss of a particular firm during the years 1989-1993 are given in the following table:

Represent the above statistical data by a bar diagram. Solution in Bengali
Step by step video & image solution for The profits & loss of a particular firm during the years 1989-1993 are given in the following table: Represent the above statistical data by a bar diagram. by Maths experts to help you in doubts & scoring excellent marks in Class 11 exams.
Topper's Solved these Questions
- BOOK - CHHAYA PUBLICATIONCHAPTER - DIAGRAMMATIC REPRESENTATION OF DATAEXERCISE - EXERCISE (Very short Answer Type Question)7videos
DIAGRAMMATIC REPRESENTATION OF DATA
- BOOK - CHHAYA PUBLICATIONCHAPTER - DIAGRAMMATIC REPRESENTATION OF DATAEXERCISE - EXERCISE (Very short Answer Type Question)7videos
DIAGRAMMATIC REPRESENTATION OF DATA
- BOOK - CHHAYA PUBLICATIONCHAPTER - HYPERBOLAEXERCISE - SAMPLE QUESTIONS FOR COMPETITIVE EXAMS12videos
HYPERBOLA
Similar Questions
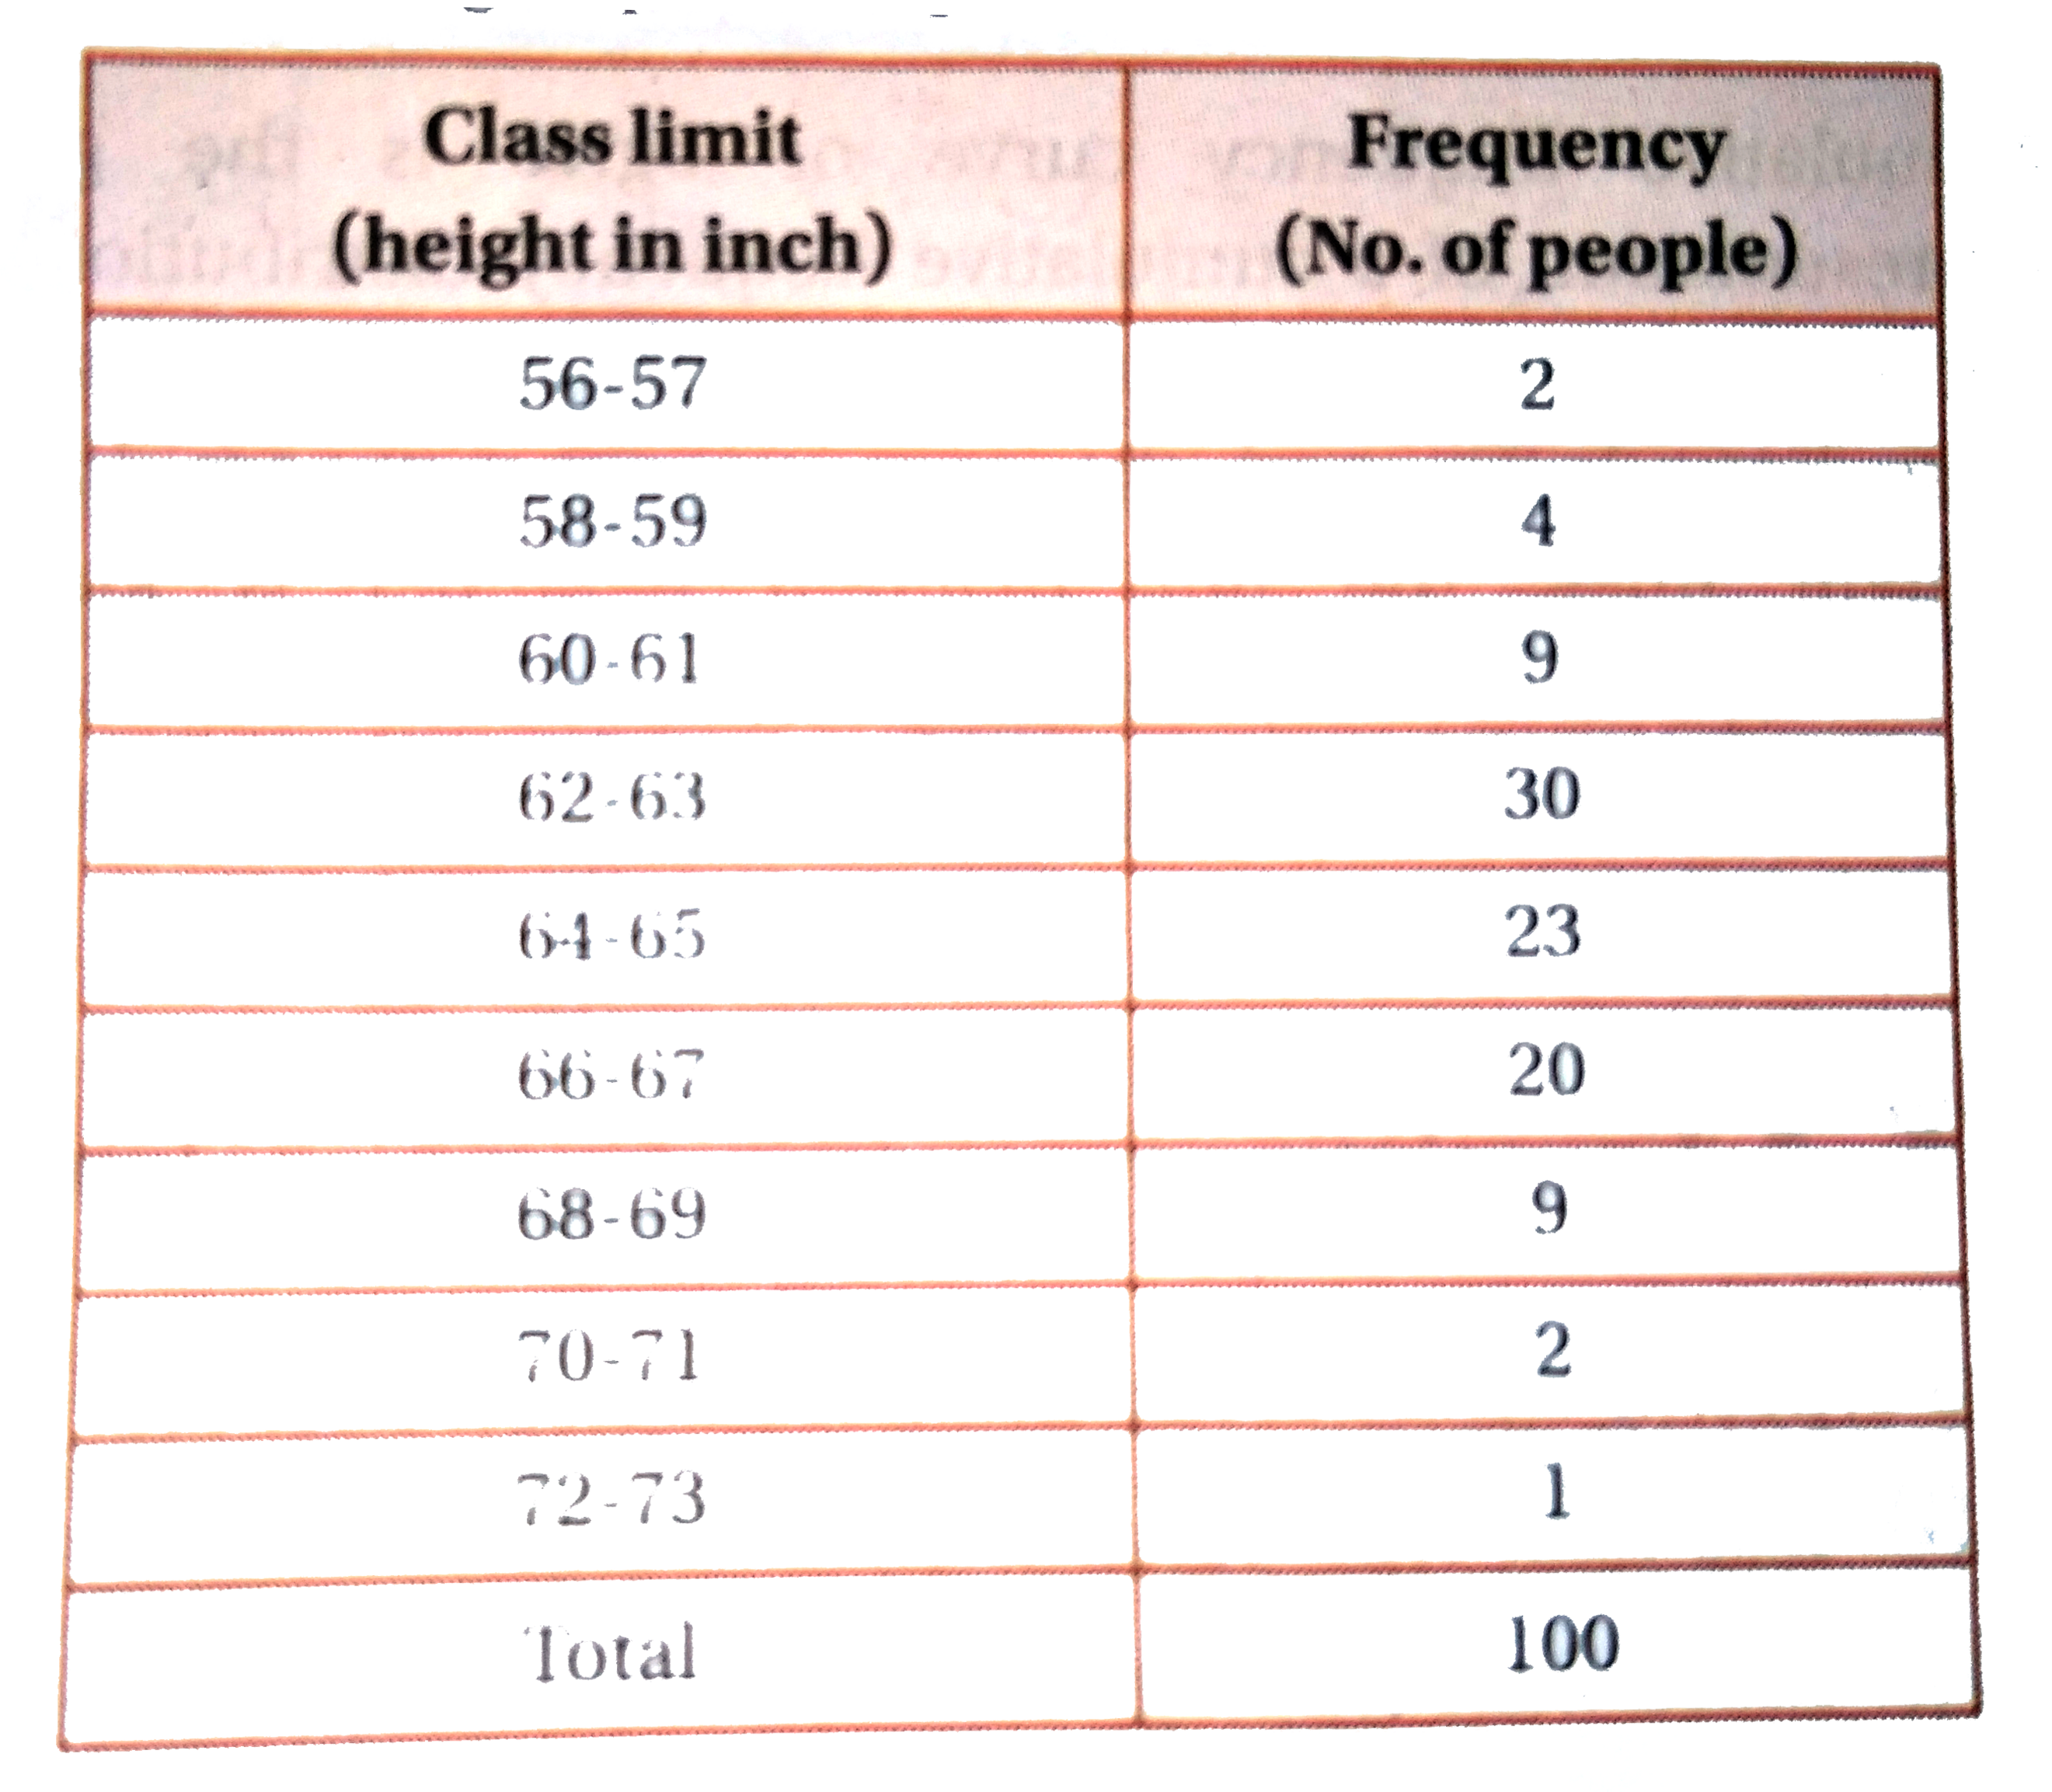
The following table gives the frequency distribution of heights in inches of a group of 100 peple:
 Draw a histogram for height distribution. Shade the portion of the histogram which will represent the total number of people whose heights lie between 60.5 and 66.5 inches. 01:37View Solution
The following table gives the frequency distribution of heights in inches of a group of 100 peple:
 Draw a histogram for height distribution. Shade the portion of the histogram which will represent the total number of people whose heights lie between 60.5 and 66.5 inches. 06:07View Solution
The equation px2+2qxy+ry2+2sx+2ty+u=0 (where p≠q≠r and p,q,r,s,t and u are constants ) represents-
02:11View SolutionHow many lines of symmetry does the above figure have ?
01:31View SolutionWhich of the following are correct chain isomers of butane ? (i)
02:45View SolutionDetermine the point of symmetry of a regular hexagon.
02:17View SolutionDtermine the images of the following figure about the given line :
05:41View SolutionMatch the following Column A to Column B
 02:21View Solution
Match the following Column A to Column B
 02:03View Solution
Match the following Column A to Column B
 02:10View Solution
Find the area of the figure given below.
 02:17View Solution
The area of the shaded part in the figure given below is ______.
 02:10View Solution
The inequation represented by the graph given below is :
04:23View SolutionThe inequation that best describes the graph given below is _________
03:02View SolutionThe inequation that best describes the following graph is _________
06:00View SolutionWhich inequations represent the shaded region in the given figure
01:52View Solution

