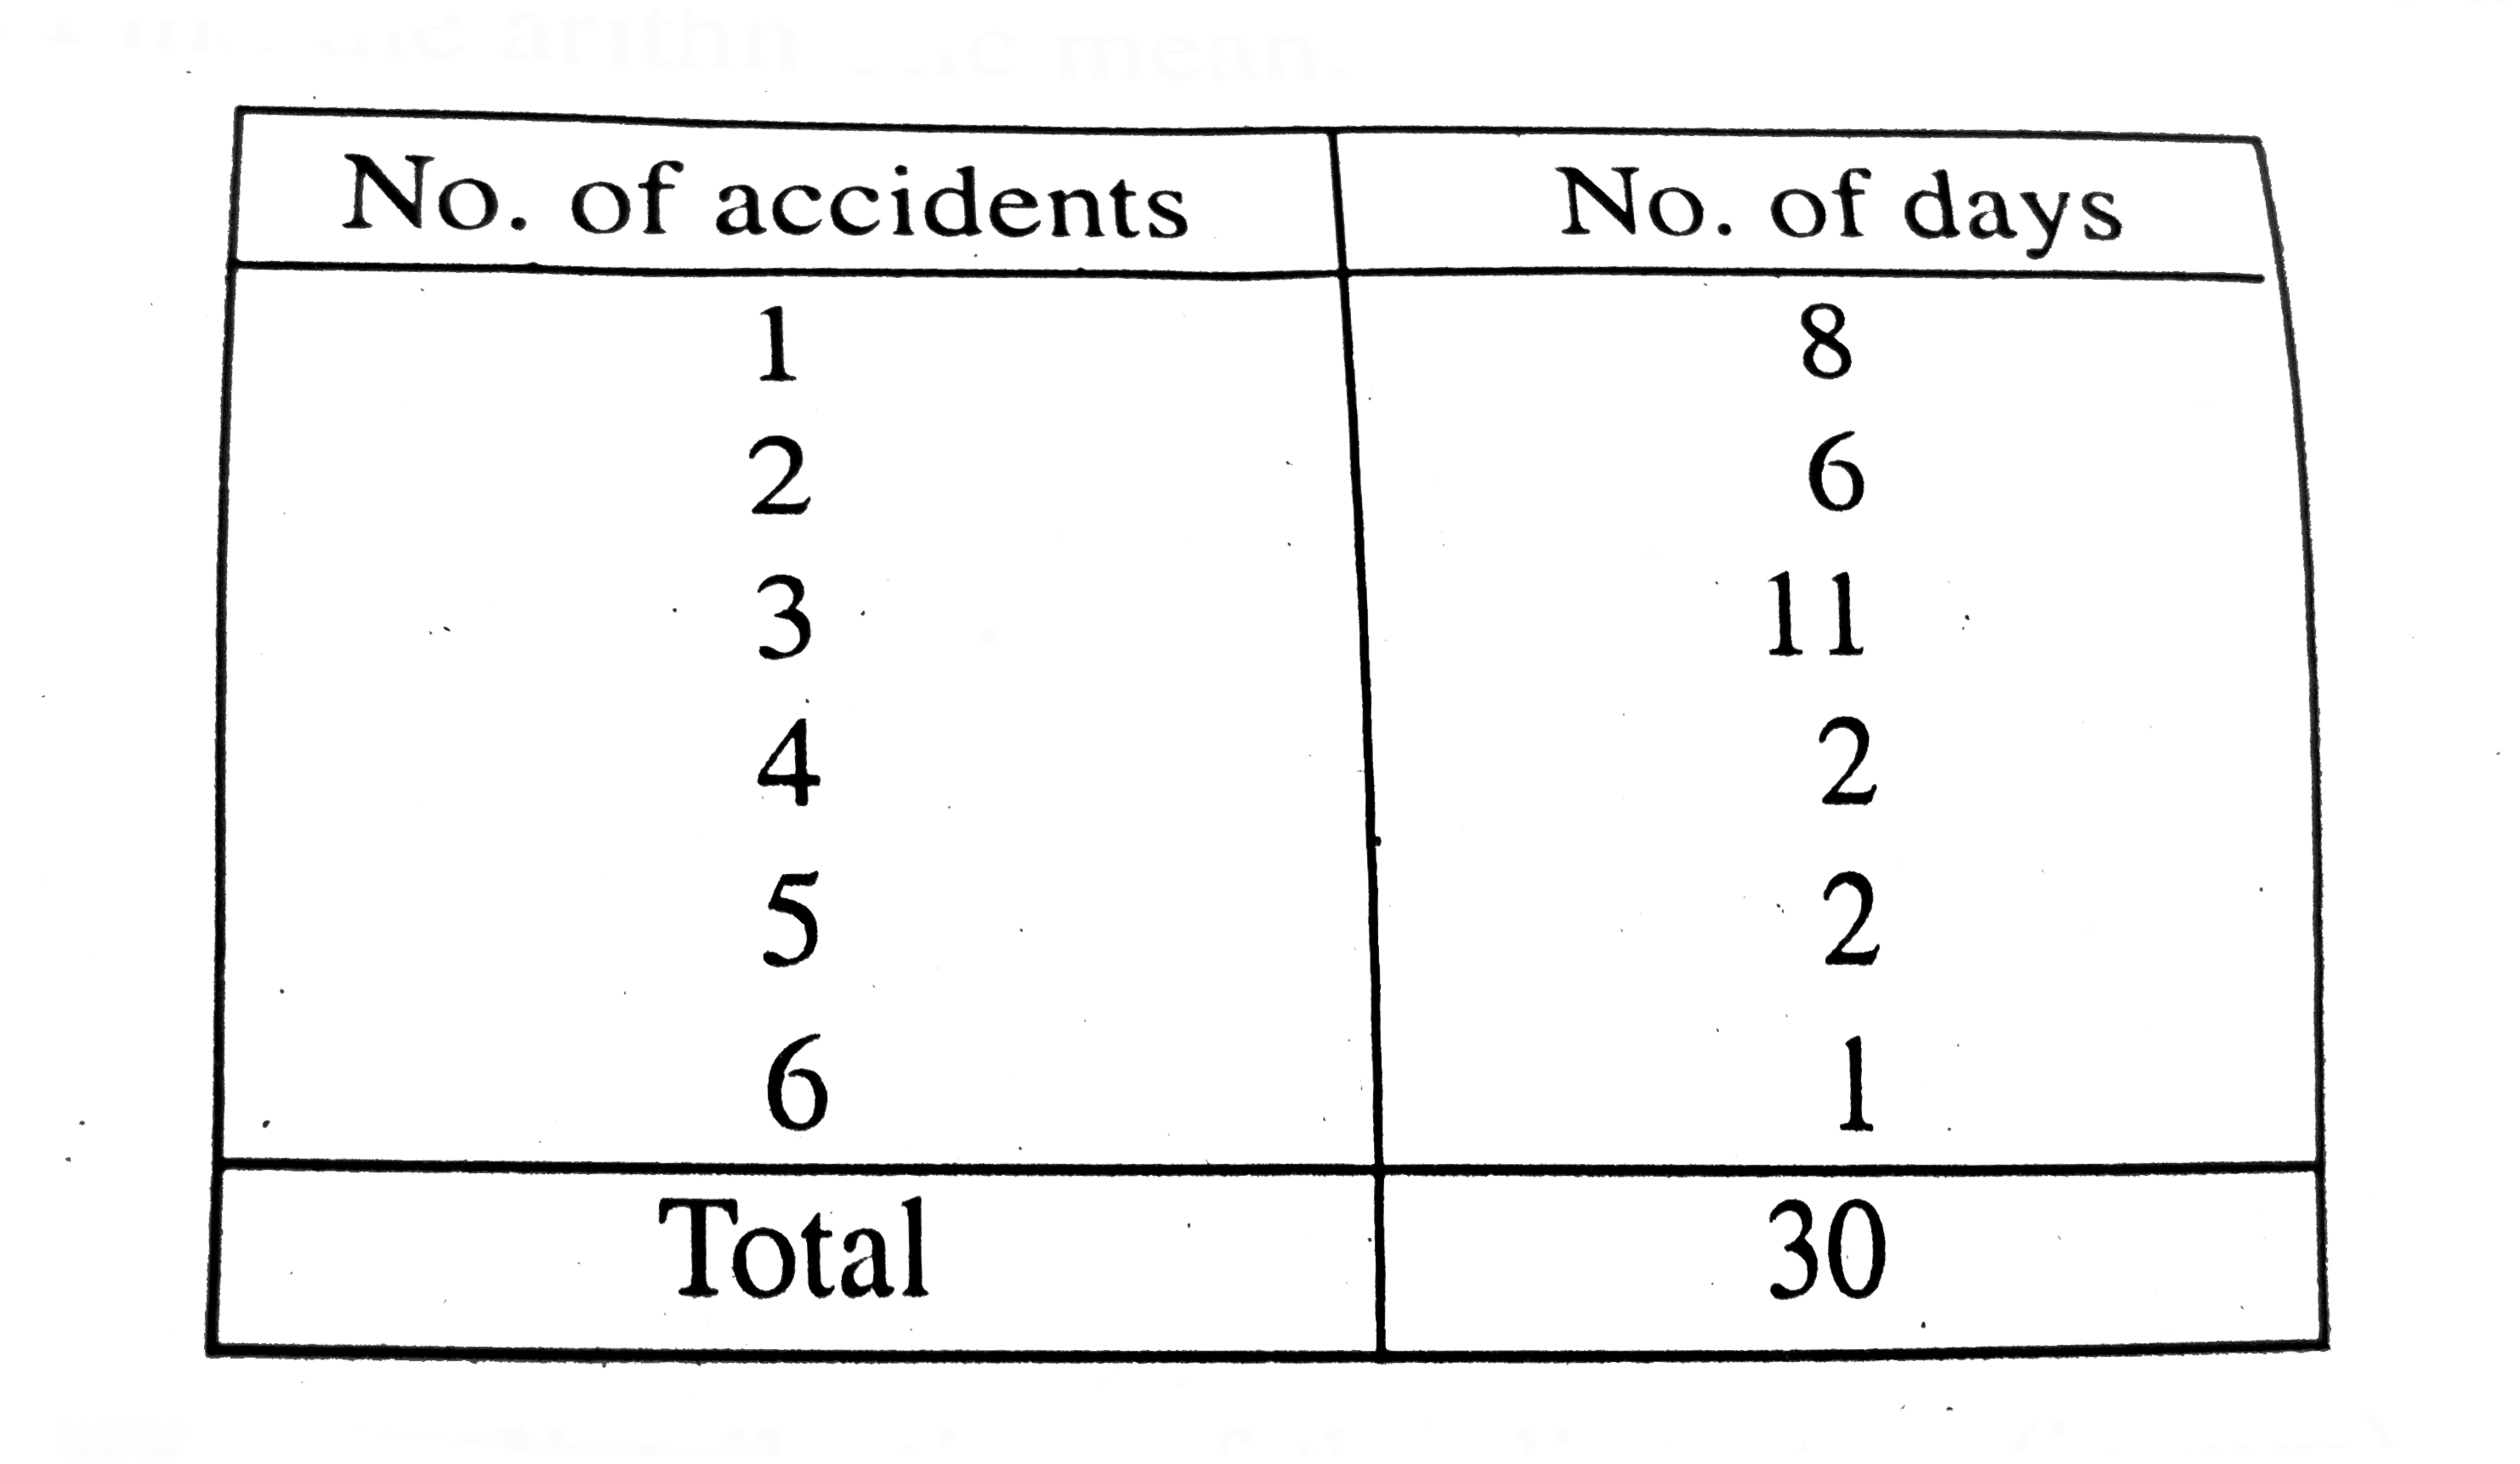
The frequency distribution of the number of accidents in 30 consecutive days in a city are given below. Find the arithmetic mean.
 Solution in Bengali
Step by step video & image solution for The frequency distribution of the number of accidents in 30 consecutive days in a city are given below. Find the arithmetic mean. by Maths experts to help you in doubts & scoring excellent marks in Class 10 exams.
Updated on:21/07/2023Topper's Solved these Questions
- MEASURES OF CENTRAL TENDENCYBOOK - CALCUTTA BOOK HOUSECHAPTER - MEASURES OF CENTRAL TENDENCYEXERCISE - EXERCISE
36 Videos
- CONSTRUCTION: CONSTRUCTION OF TANGENT TO A CIRCLEBOOK - CALCUTTA BOOK HOUSECHAPTER - CONSTRUCTION: CONSTRUCTION OF TANGENT TO A CIRCLEEXERCISE - Exercise-8.2
5 Videos
- MEDIAN AND MODEBOOK - CALCUTTA BOOK HOUSECHAPTER - MEDIAN AND MODEEXERCISE - EXERCISE
20 Videos
Similar Questions
How arithmetic mean is changed when the values of the variable are added or subtracted by a constant number ?
View SolutionConstruct two cricles of radii 4.2 cm and 2.8 cm , the distance between whose centres is 10 cm . Draw a direct common tangent to these two circles .
View SolutionWhat are the measure of central tendency. Define them.
View SolutionDetermine the point of symmetry of a regular hexagon.
View SolutionDtermine the images of the following figure about the given line :
View SolutionMatch the following Column A to Column B

View SolutionMatch the following Column A to Column B

View SolutionMatch the following Column A to Column B

View SolutionFind the area of figure given below.

View SolutionFind the perimeter of the figure given below.

View SolutionFind the area of the figure given below.

View SolutionThe area of the shaded part in the figure given below is ______.

View SolutionThe inequation represented by the graph given below is :
View SolutionThe inequation that best describes the graph given below is _________
View SolutionThe inequation that best describes the following graph is _________
View Solution
